1. Introduction
An image quality assessment (IQA) plays a crucial role in accurately measuring a degraded image from a reference image. In general, there are two types of IQA used to evaluate the quality of an image, i.e., subjective and objective [
1,
2,
3]. A subjective measure [
4] involves individuals (mostly groups of experts) inspecting an image, and then conducting an evaluation according to their specialties. This measure is considered the best strategy because it offers consistency when assessing the images. However, to reach a reliable conclusion after image measurements, a subjective measure is often inconvenient, time-consuming, and expensive. This is natural because the involvement of human beings is directly connected to their ability, knowledge, and insight. For instance, to analyze a medical image, a medical doctor specializing in radiology is necessary. Renieblas et al. reported inspecting bone plain films, magnetic resonance, and chest plain films, selecting four medical doctors with diagnostic experiences in measuring such images to participate [
5]. By realizing the shortcomings of a subjective method, several attractive measurements related to objectively evaluating such images have been developed during the past few decades. The most popular image quality measures are the mean square error (MSE), signal-to-noise ratio (SNR), contrast-to-noise ratio (CNR), and absolute error (AE), as well as a derivation of such measures, such as Laplacian MSE (LMSE), peak MSE (PMSE), normalized MSE (NMSE), PSNR, and NAE [
6,
7]. Although such measures are accepted as a universal image quality index, they provide less sensitivity compared with a human visual system (HVS) [
8]. They are considered common measurements because they can be calculated easily and may interpret the physical meaning of an image [
9,
10]. In addition, contrast-and-size detail (CSD) was developed to separate the visible and invisible inclusions in mimicking the breast environment through simulations by embedding a numerical tumor. In this case, an inclusion represents a breast tumor [
11,
12]. Again, this image quality metric (IQM) has issues in terms of inconsistency when increasing the contrast ratio with a raised inclusion size and an ambiguous threshold value. Therefore, it is challenging to implement this method and distinguish seeable and unseeable inclusions inside the breast tissue with a provided threshold value.
In early 2000, Wang et al. developed a new universal IQA and tried to replace conventional methods such as MSE and PSNR for measuring the quality of the images, namely the structural similarity (SSIM) index, and adapt to the HVS [
10,
13]. Their first attempt regarding the possibility of substituting traditional strategies with an applicable metric to measure various images from numerous sectors was reported in 2002. It was reported that the IQA calculates the distortions in a combination of the loss of correlation, luminance distortion, and contrast distortion [
14]. In addition, their results indicate that the novel universal index is more exceptional than MSE because the new index measures the information loss and is not focused on the energy loss. This is reasonable because the MSE values of two different distorted images can be the same, although one image is more flawless than another image. Their follow-up study complementing their previous research was published in 2004, and one of the most popular IQMs in this era, i.e., SSIM, was described [
10]. They proposed a novel philosophy by considering that image degradation is the perceived changes in structural information, whereas error sensitivity is an estimation of the perceived errors to assess a noised image in comparison with the original. This new philosophy is easy to understand because the human perceptual measure is comfortable quantifying the changes in structural information when two images are compared, and it is more complicated to indicate the error. Moreover, the novel metric suggests the IQA by considering three factors, i.e., luminance, contrast, and structure comparisons. In addition, they suggested that SSIM may be used for several applications [
15] other than image processing because SSIM quantifies two signals and compares them to obtain the similarity score, regardless of the complexity in calculating the SSIM when compared to that of the MSE. Research on a single mean SSIM (MSSIM) motivated several further developments of SSIM, and to date, numerous versions of SSIM have been achieved, for example, multiscale SSIM (MS-SSIM), gradient-based SSIM (GSSIM), a three-component weighting region, a four-component weighting region, a complex-wavelet, and an improved SSIM with a sharpness comparison (ISSIM-S) [
16,
17,
18,
19,
20,
21,
22]. The SSIM method has recently become popular as a way to improve the sensitivity according to the measurement scope and goal by applying an image processing procedure [
23]. Several publications have even reported SSIM implementation in clinical applications and biomedical fields [
24,
25,
26,
27,
28].
SSIM has shown signs of progress, not only in digital images for communication, video, monitor, television, and watermark technologies [
29,
30,
31,
32,
33,
34,
35] but also in medical image analyses [
36,
37,
38,
39,
40,
41,
42,
43,
44,
45] to assist clinicians or physicians in complementing an opinion before making a final decision [
46,
47,
48,
49]. SSIM can be considered a “second opinion” in an assessment. By understanding the recent progression of SSIM related to medical image quantification, this study reviewed articles concentrating on the SSIM implementation as an objective measure used to evaluate medical images from several modalities, such as magnetic resonance imaging (MRI), ultrasound (US), computerized tomography (CT) scans, X-rays, and optical imaging, as well as other implementations in the medical field. Moreover, we discuss the history and popular progress of SSIM from its origin to recent structural similarities, its strengths and shortcomings, and its potential future research directions in relation to medical image analyses. This review is expected to be a guide for researchers in identifying the potential application of SSIM when objectively measuring medical images.
The remainder of this study is organized as follows.
Section 2 describes the history and basic principles of SSIM, and
Section 3 describes the types of improvements made to this index.
Section 4 presents the use of SSIM in medical imaging, whereas
Section 5 presents some final concluding remarks by providing the future prospects of SSIM for medical image analyses.
2. Historical Review and Basic Principles of SSIM
Quantifying an image objectively to acquire quality statistics is a crucial task in an image processing procedure because it can provide the feature and property information of the image; thus, several attempts at develo** a computer-based observer have been conducted by researchers. Nevertheless, creating a reliable algorithm for measuring an image is challenging and is concerned with the HVS because humans are the end-users of the images. For example, in terms of video communication, a perfect IQM can be deployed as a benchmark for measuring other IQMs when assessing a particular task. We can select the best IQM algorithm based on performance [
33,
35,
50,
51]. Moreover, in the field of medical image analysis, with the assistance of computer vision, clinicians can improve their confidence when diagnosing patients. This becomes more vital if the task is related to human disease diagnosis [
52,
53,
54,
55,
56].
Two traditional quality metrics, MSE and PSNR, are widely used to evaluate images because they are able to provide a physical meaning and are relatively simple in terms of their calculation. However, such quality measures are frequently inconsistent with the HVS because they can provide the same value of quality for two completely different distorted images, even when one image is more perceivable than another [
6,
7]. The performances of common IQAs were shown by Eskicioglu and Fisher [
9] in 1995, inspiring Wang and Bovik [
14] to develop a novel universal IQM to overcome the MSE and PSNR incompatibility in 2002. At the time, MSE and SNR, along with their differentiations considered, were incompatible with HVS, particularly when employing a specific condition directed at an image with a particular level of degradation.
This first attempt in develo** a new universal quality index can be utilized not only in a two-dimensional image processing system but also in other areas, such as speech and pattern recognitions relative to a one-dimensional analysis, because the new universal quality metric offers comparisons between two signals. These two signals refer to one signal as a reference and the other acting as the original signal with implemented noise. Using these two signals, we can calculate the signal quality quantitatively. Therefore, their study was recognized as a full-reference (FR) [
57] IQA when considering that the model of the image distortion is influenced by three aspects, i.e., correlation loss, luminance distortion, and contrast distortion. A description of the developed novel universal quality index is as follows:
where
is the original image, and
denotes the image under test, with
and
as the average grayscale level (luminance) for the original and test images, respectively. In addition,
and
are squares of the standard deviation for the original and test images, and
refers to the covariance between the original and test images. Moreover, the quality score
is within the range of
to
; however, in most cases,
is from
to
with
representing a non-similarity and
demonstrating a perfect match between the reference and noised images. To simplify Equation (1) into three important components,
can be defined as
Because an image is space-variant, for measuring an image, a local assessment is preferred over a global evaluation that quantifies the image by employing a sliding window. This window slides over the entire image from the left-top to right-bottom corners pixel by pixel both horizontally and vertically. During each stride, we obtain
, and thus if the window slides over the image for
strides, we acquire the total quality
, and
can be written as
indicating the mean quality score.
Furthermore, Wang and Bovik indicated that the new quality metric is superior to the MSE. They employed the same MSE value with various distortions to the “Lena” image. They set the MSE value to approximately ; however, the score could validate the quality by showing the different scores with respect to the perception of a human observer. However, in this first effort, they did not claim to use any HVS models.
Two years later, in 2004, they published their study on SSIM with the help of two additional co-authors [
10]. They reported that the assumption of HVS can be well adapted with the perception of the structural information and that human observers have limitations in recognizing errors. This is reasonable because humans can easily identify changes in physical information while complicatedly detecting the variations of an error in the images. To match with the HVS, SSIM demonstrates comparisons of
luminance,
contrast, and
structure, which are specified as
where
and
denote the mean intensity for reference image
and distorted image
, respectively. Compared with Equation (2), Equations (4) and (5) have the same definitions as luminance and contrast comparisons, and meanwhile, Equation (6) has a different description from the correlation to be applied in a structural comparison. Likewise, SSIM considers constant values to avoid instability when
,
, and
are extremely close to zero. These constants are
,
, and
. In addition,
and
should be
and
is
for an
-bit grayscale image or an image in three channels, such as red, green, and blue (RGB). As in Equation (2), the SSIM also can be formulated as
with
, and thus a specific form can be defined as
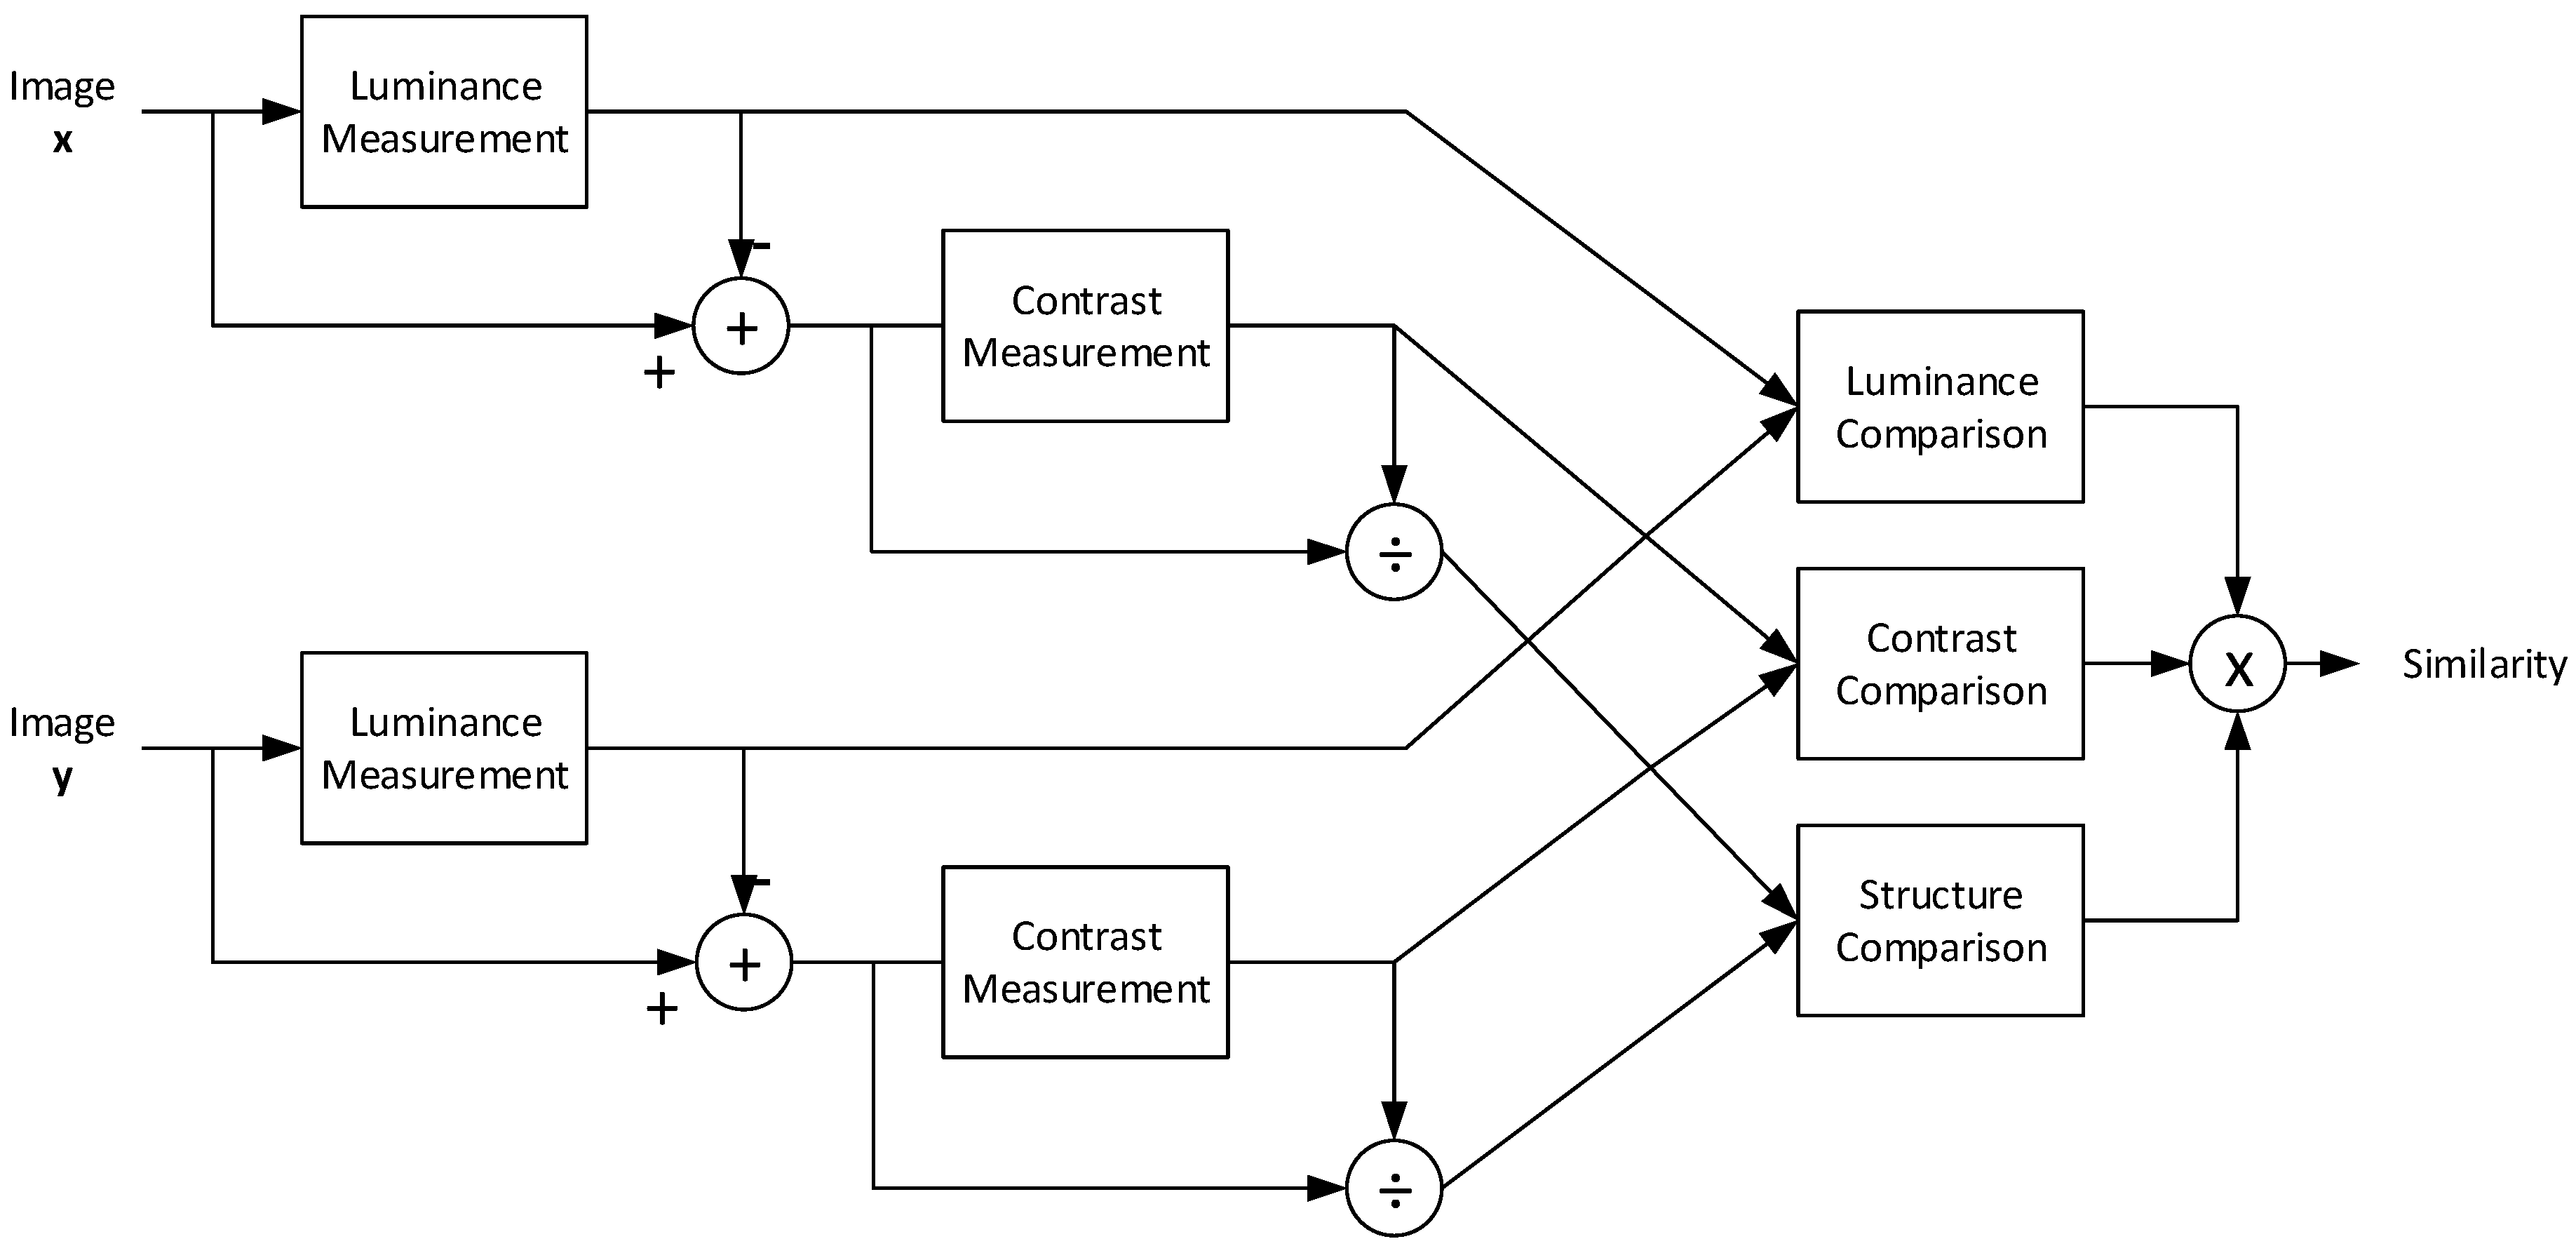
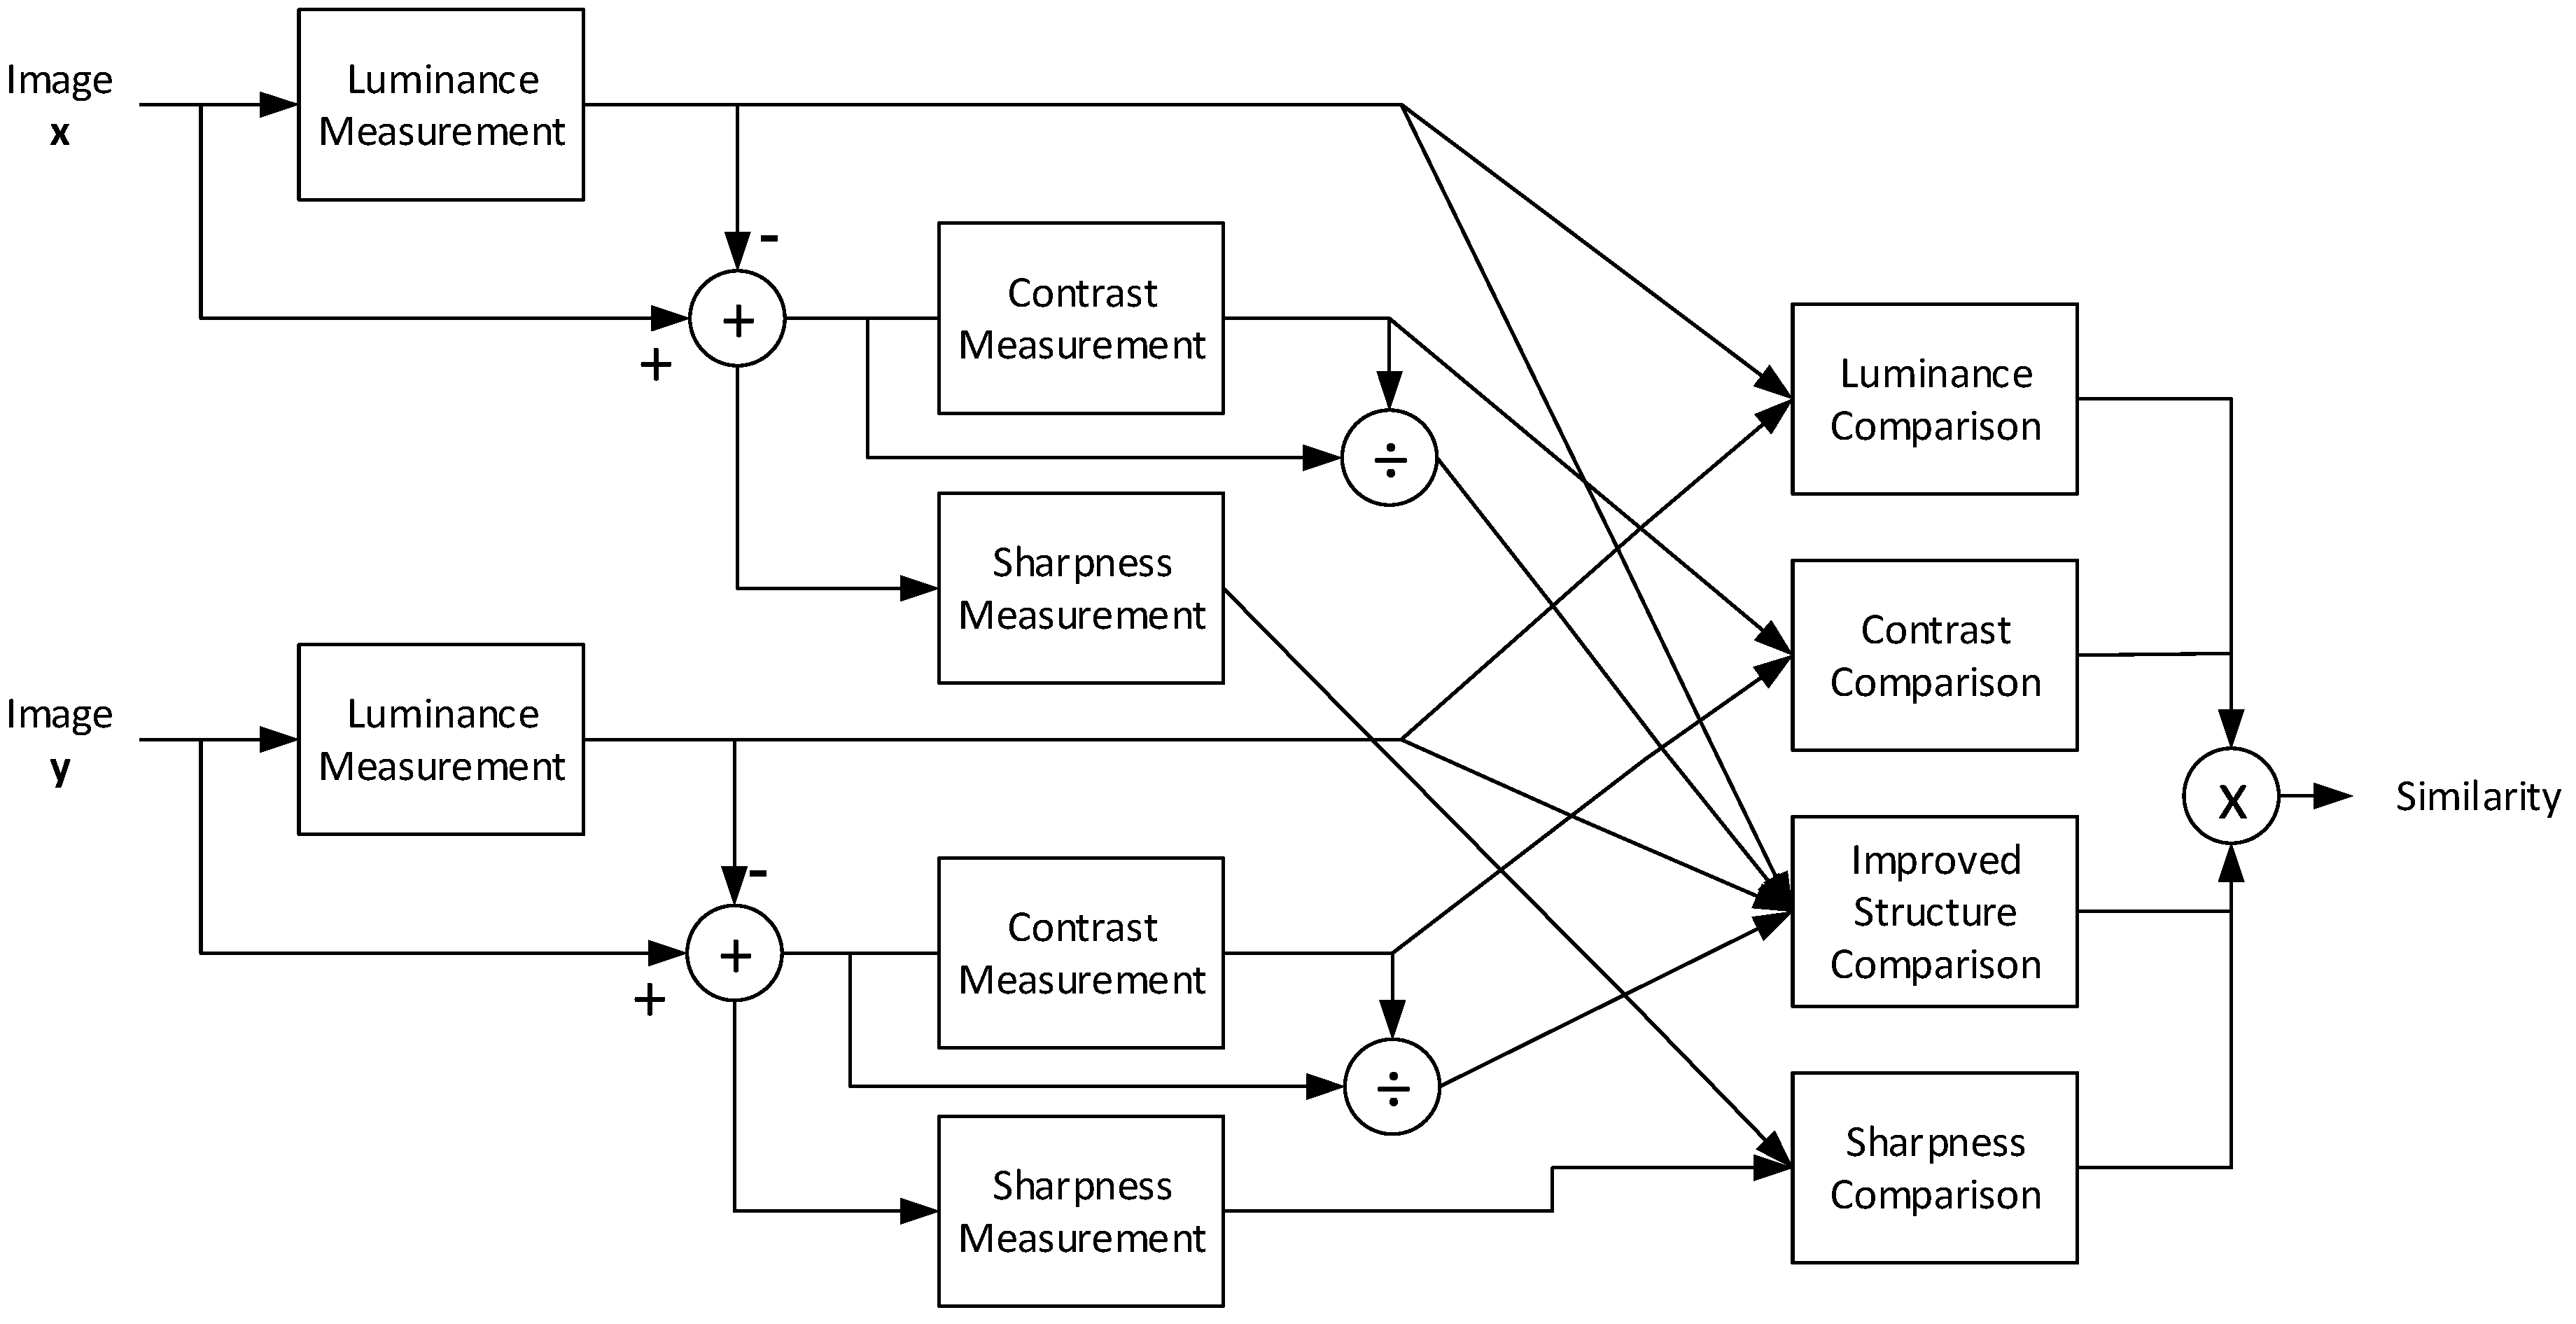
Figure 1 shows a diagram of the SSIM measurement procedure. First, the luminance is calculated over the two images by utilizing Equation (4) when employing a sliding window; here, image
is a reference image, whereas image
denotes a noise-degraded image. The contrast is then measured using Equation (5). To obtain the structure, the covariance between
and
must be computed using Equation (6). Once these three factors have been obtained, the combination of the comparisons, as indicated in Equation (7), shows a quality score within the range of
to
because of the structural influence. However, in various cases, the score is between
and
. Therefore, the SSIM satisfies the following conditions:
Symmetry:
Boundedness:
Unique maximum: if and only if .
As in previous studies regarding the universal quality index (UQI) [
14], SSIM is also effective in inspecting the image locally by implementing a sliding window. Hence, according to the original article on SSIM [
10], the sliding window was
. In addition, there was an improvement in the sliding window by applying a Gaussian weighting function
with a standard deviation of
. The value of
should fulfill a unit sum of
. Because of this Gaussian weighting function with a
local window, the local statistics, such as
,
,
,
, and
, have the following adjustments:
where
and
are
and
, respectively. When completing the SSIM computation over the entire image using a local window, the mean SSIM (MSSIM) can be obtained as
where
and
denote the reference image and the image under testing, respectively, whereas
and
are the images at the
-th window when the local window slides over the original and distorted images, and
is the number of local windows in the image.
MSSIM showed consistency when compared with human observers. In addition, these results were confirmed by implementing the PSNR as an evaluation tool to measure other IQAs, which, in this case, is MSSIM. Further, the previous UQI with
and
is
, which presents the smallest correlation with the human observers. These results indicate that MSSIM can improve the UQI ability in avoiding a zero in the denominator by setting
and
as
. Hence, SSIM has become popular as an objective investigative tool for other fields included in medical image analysis [
58,
59,
60,
61,
62,
63,
64,
65,
66,
67].
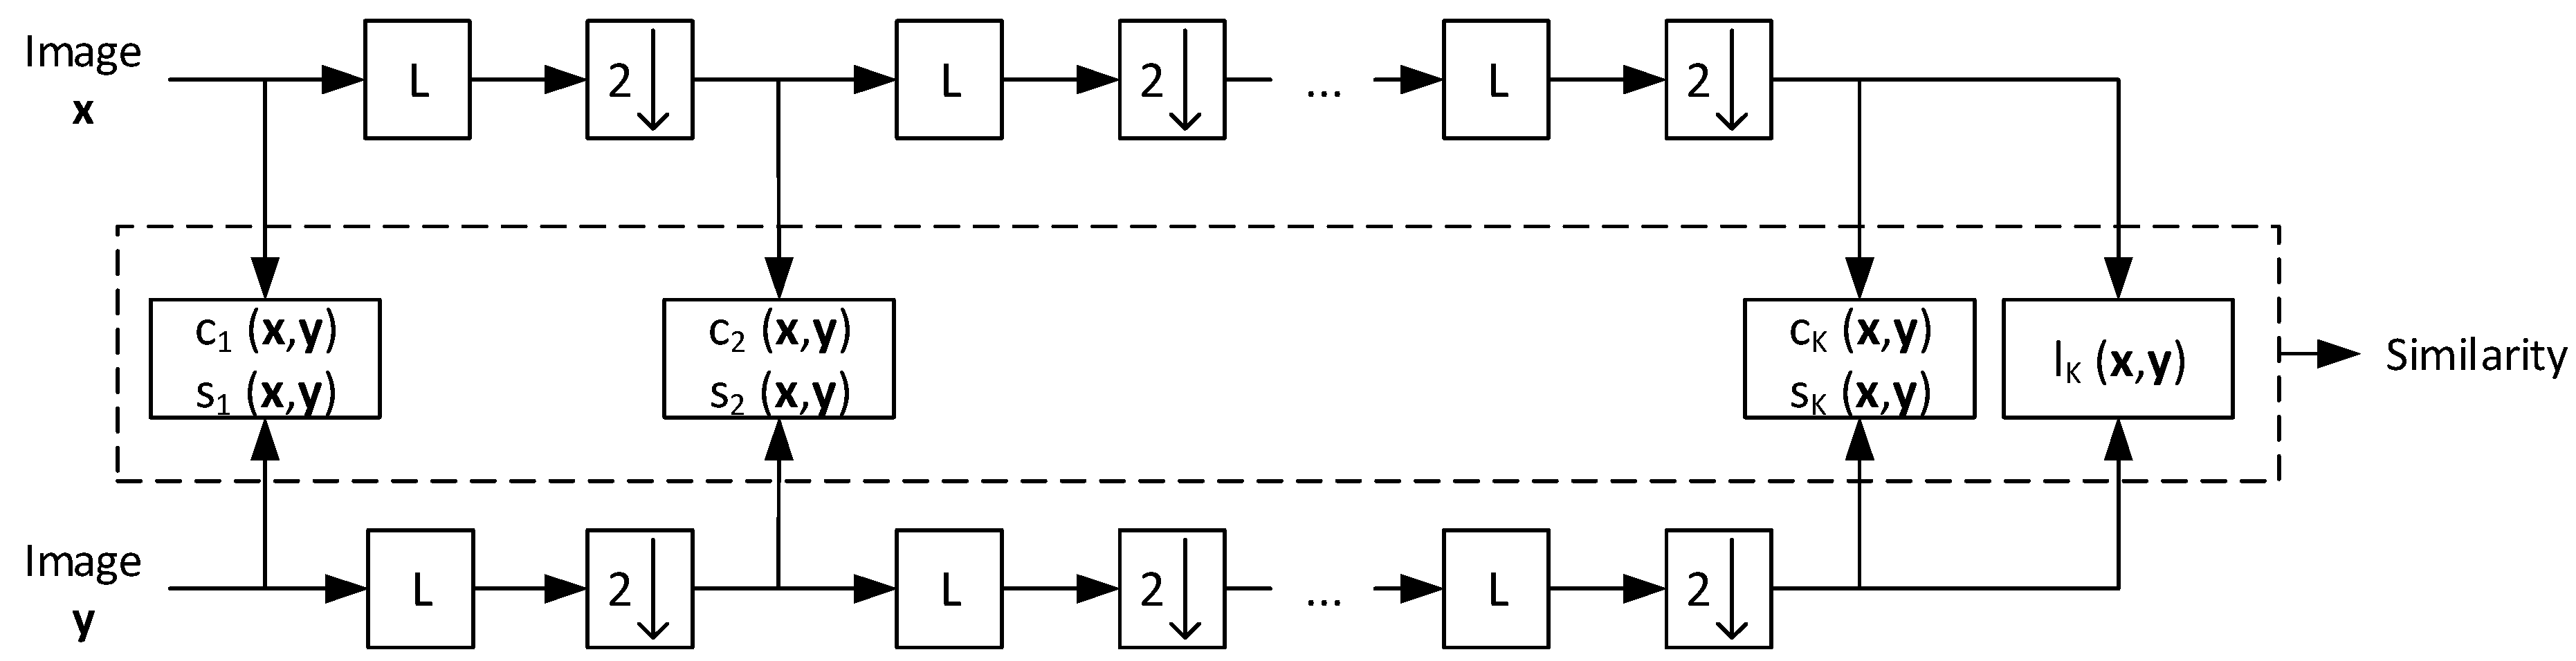
To overcome the weakness of a single-scale SSIM associated with a limitation of view, a multi-scale SSIM (MS-SSIM) was established [
22]. The viewing conditions are incorporated with the display resolution, distance when reading the image, luminance background, and other set environments that can affect the image investigation results.
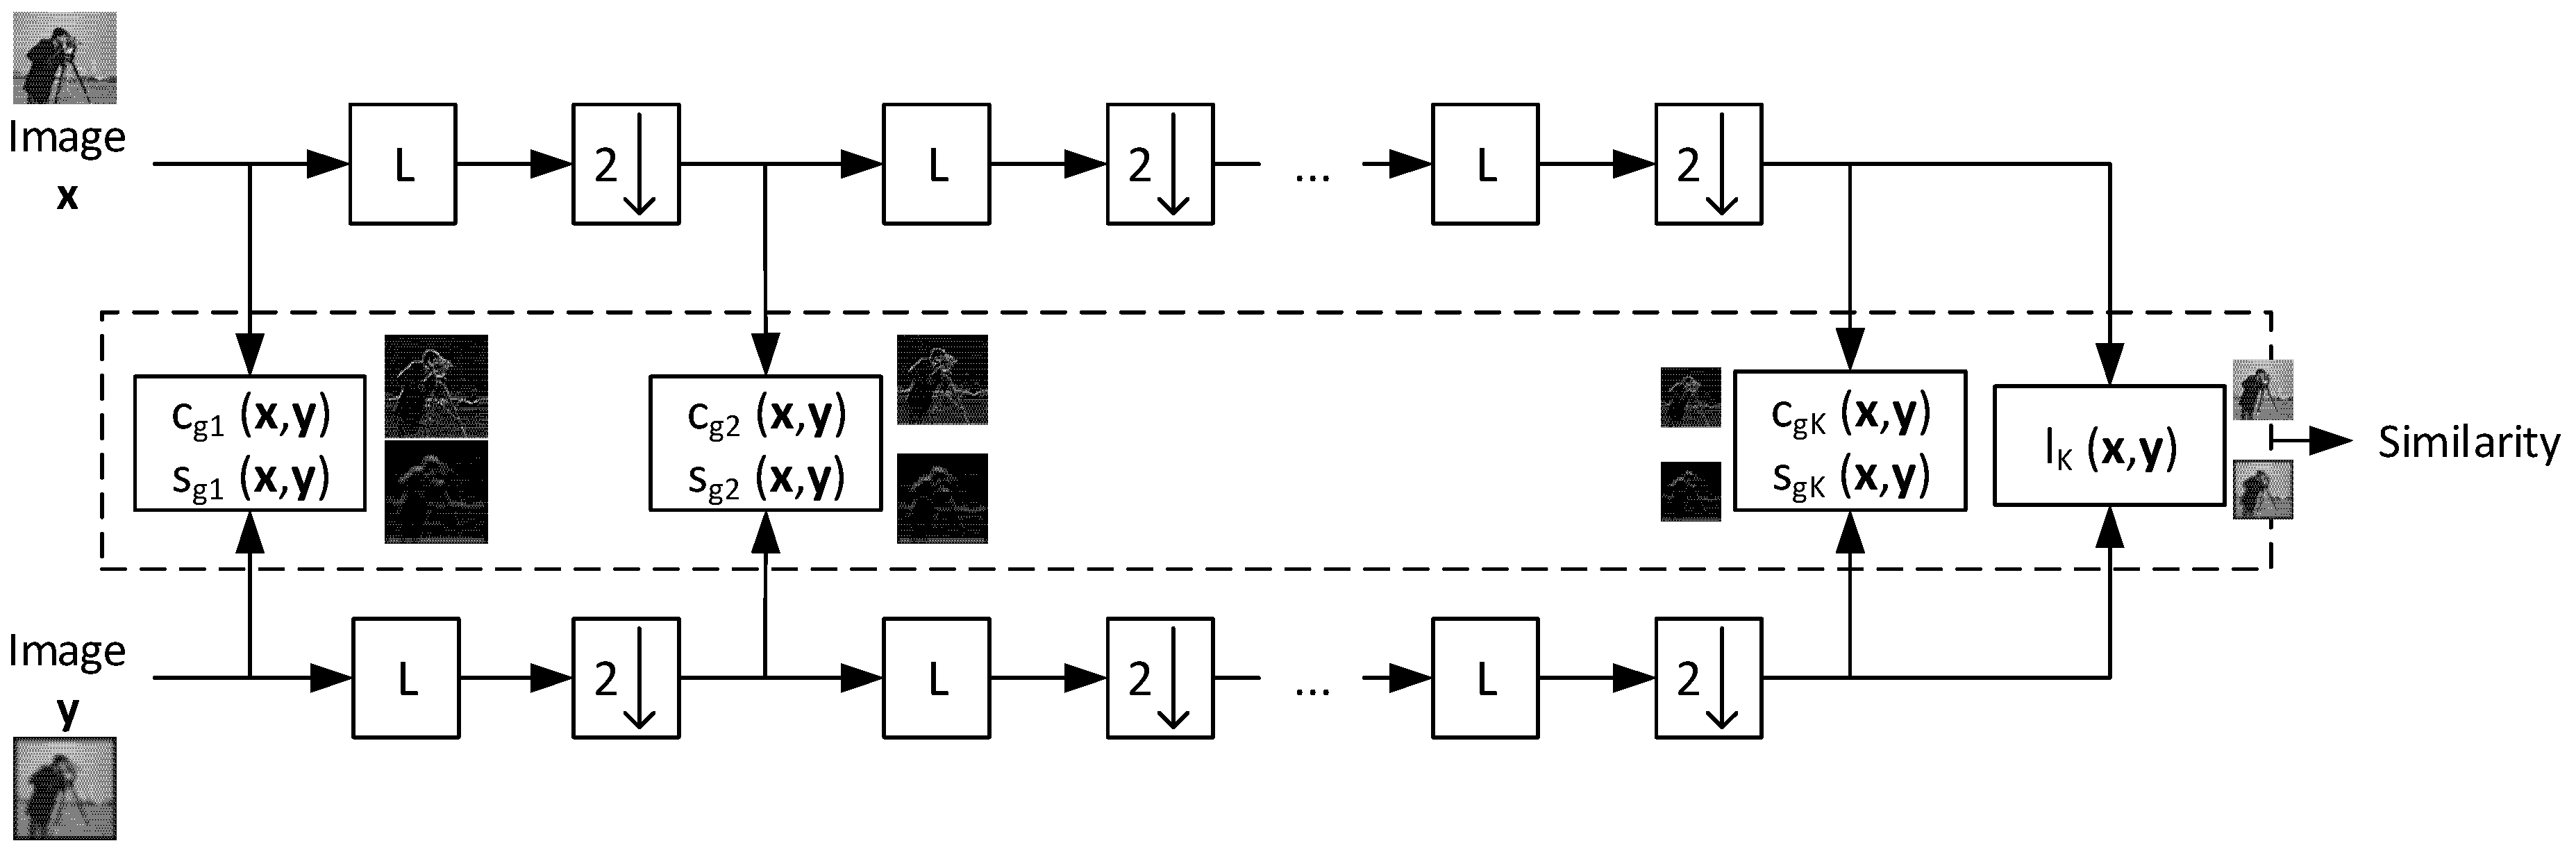
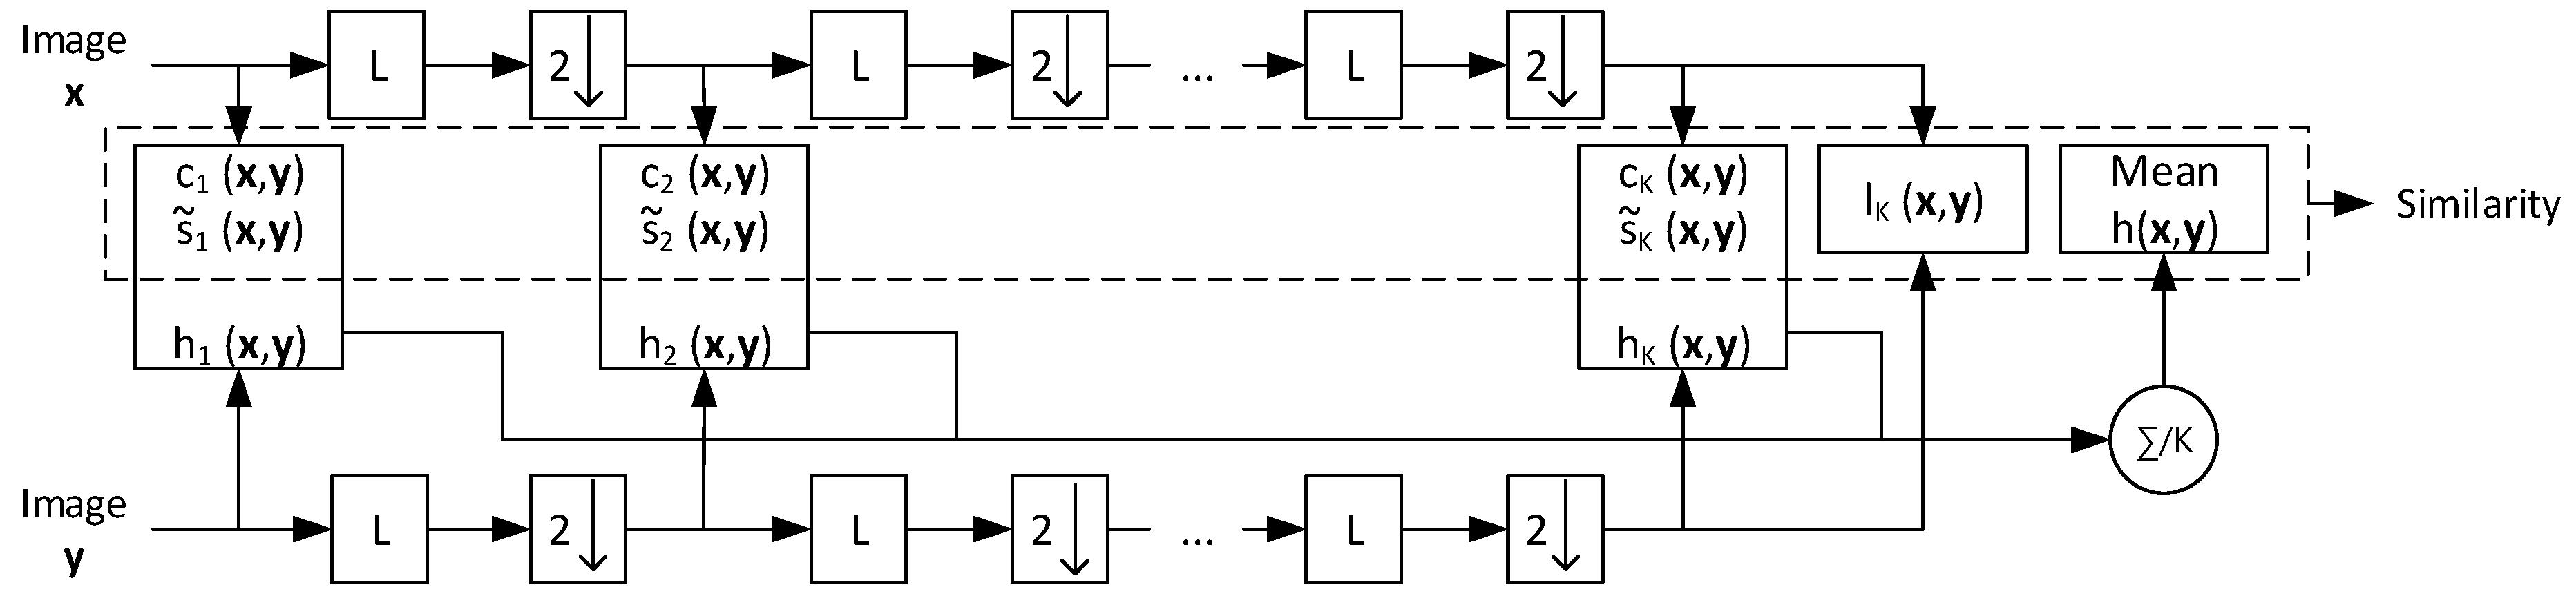
Figure 2 shows the procedure used by MS-SSIM in evaluating an image. First, images
and
are processed inputs, as in a single-scale SSIM for a scale of
. In this process, we only store the contrast
and structure
for such a scale, namely,
and
. Then, the reference and noised images are filtered using an LPF followed by downsampling by
. In this step, again, the downsampled images are computed using single-scale SSIM formulas to obtain
and
. This procedure is repeated until
iterations. Once iteration
is completed, we save all three parameters,
,
, and luminance
. Thus, the MS-SSIM is formulated as
Here,
,
, and
accommodate the comparative importance of the three components. In addition, for simplification, because
, thus
when the normalization of the cross-scale setting is established. The genuine MS-SSIM sets
with
,
,
,
, and
[
20,
22].
MS-SSIM has shown promising results in comparison with a PSNR, single-scale SSIM, and Sarnoff. MS-SSIM outperformed when evaluated by human observers’ perception. Its correlation presented the highest.
We have reviewed the historical background of SSIM and several of its basic principles, and have found that UQI, MSSIM, and MS-SSIM are triggers acting as the foundations for all types of SSIM. Developed some years later, they have tried to complement and improve on the original SSIM in terms of image processing when applied to a specific area. In the next section, we described the types of SSIM developed from 2006 to 2021.
4. SSIM in Medical Imaging
This section discusses the implementation of SSIM, particularly for imaging techniques such as MRI, ultrasonography, CT scan, X-rays, and optical imaging. This section aims to emphasize reviews of SSIM applied to the measurement of medical images. We reviewed SSIM in medical imaging based on the published year of the articles.
To identify the relevant studies, a systematic methods overview [
80] along with several major databases were used to search the matched keywords, such as “SSIM” AND “Magnetic Resonance Imaging” OR “Computed Tomography” OR “Ultrasonography” OR “Ultrasound” OR “X-ray” OR “Optical Imaging” OR “Medical Images” OR “Medical Imaging”. The main databases included Google Scholar, PubMed, IEEE, MDPI, Springer, Elsevier, and others. There were 125 identified articles related to the keywords including journals, conference proceedings, and book chapters, consisting of the original articles on UQI, SSIM, MS-SSIM, three- and four-component weighted SSIMs, CW-SSIM, ISSIM-S, and other SSIM families, as well as the SSIM implementation for MRI, CT, ultrasonography, X-ray, and optical imaging. Overall,
articles relevant to the goal of this review paper regarding SSIM applied in medical imaging were reviewed. We did not exclude the same SSIM implementation in medical imaging as with an IQA, and instead, we mentioned, classified, and briefly reviewed them in
Section 4.1 and
Section 4.5 according to the medical imaging technique used. We provided this method because we prefer to offer a wide range of SSIM implementations and fulfill the objective of this review paper of providing the readers or researchers with potential medical image examination research methods that can be improved using SSIM. Additionally,
Section 4.6 provided a thorough review of
articles related to SSIM application in medical imaging for loss function in convolutional neural network (CNN), reducing metal artifact, contour extractor, and IQA. Thus, we described in detail the image acquisition method, filtering, or the other approaches used to acquire the distorted images for comparing with the original image from the medical modality imaging scheme. Additionally, this study’s limitation was stated in
Section 4.7.
To avoid misleading and maintain the objective of this review, we emphasized that the SSIM measure has an original goal to substitute the common measures, such as MSE and PSNR in measuring any signals in 1D, 2D, and 3D, as long as there is a reference signal. Thus, the SSIM measure can assess digital images including medical images. To offer a better representation of the methodology when using SSIM to evaluate medical images, we provided
Figure 13,
Figure 14 and
Figure 15 to depict medical images when they were processed using three- and four-component SSIMs, as well as ISSIM-S. However, since this study’s goal is to provide the SSIM prospect in medical images, we did not measure each SSIM type (three-component SSIM, four-component SSIM, and ISSIM-S) similarity score. We used a digital database for screening mammography (DDSM) [
81] containing
cases of normal, benign, and malignant breast cancers extracted from calcification and breast masses abnormalities.
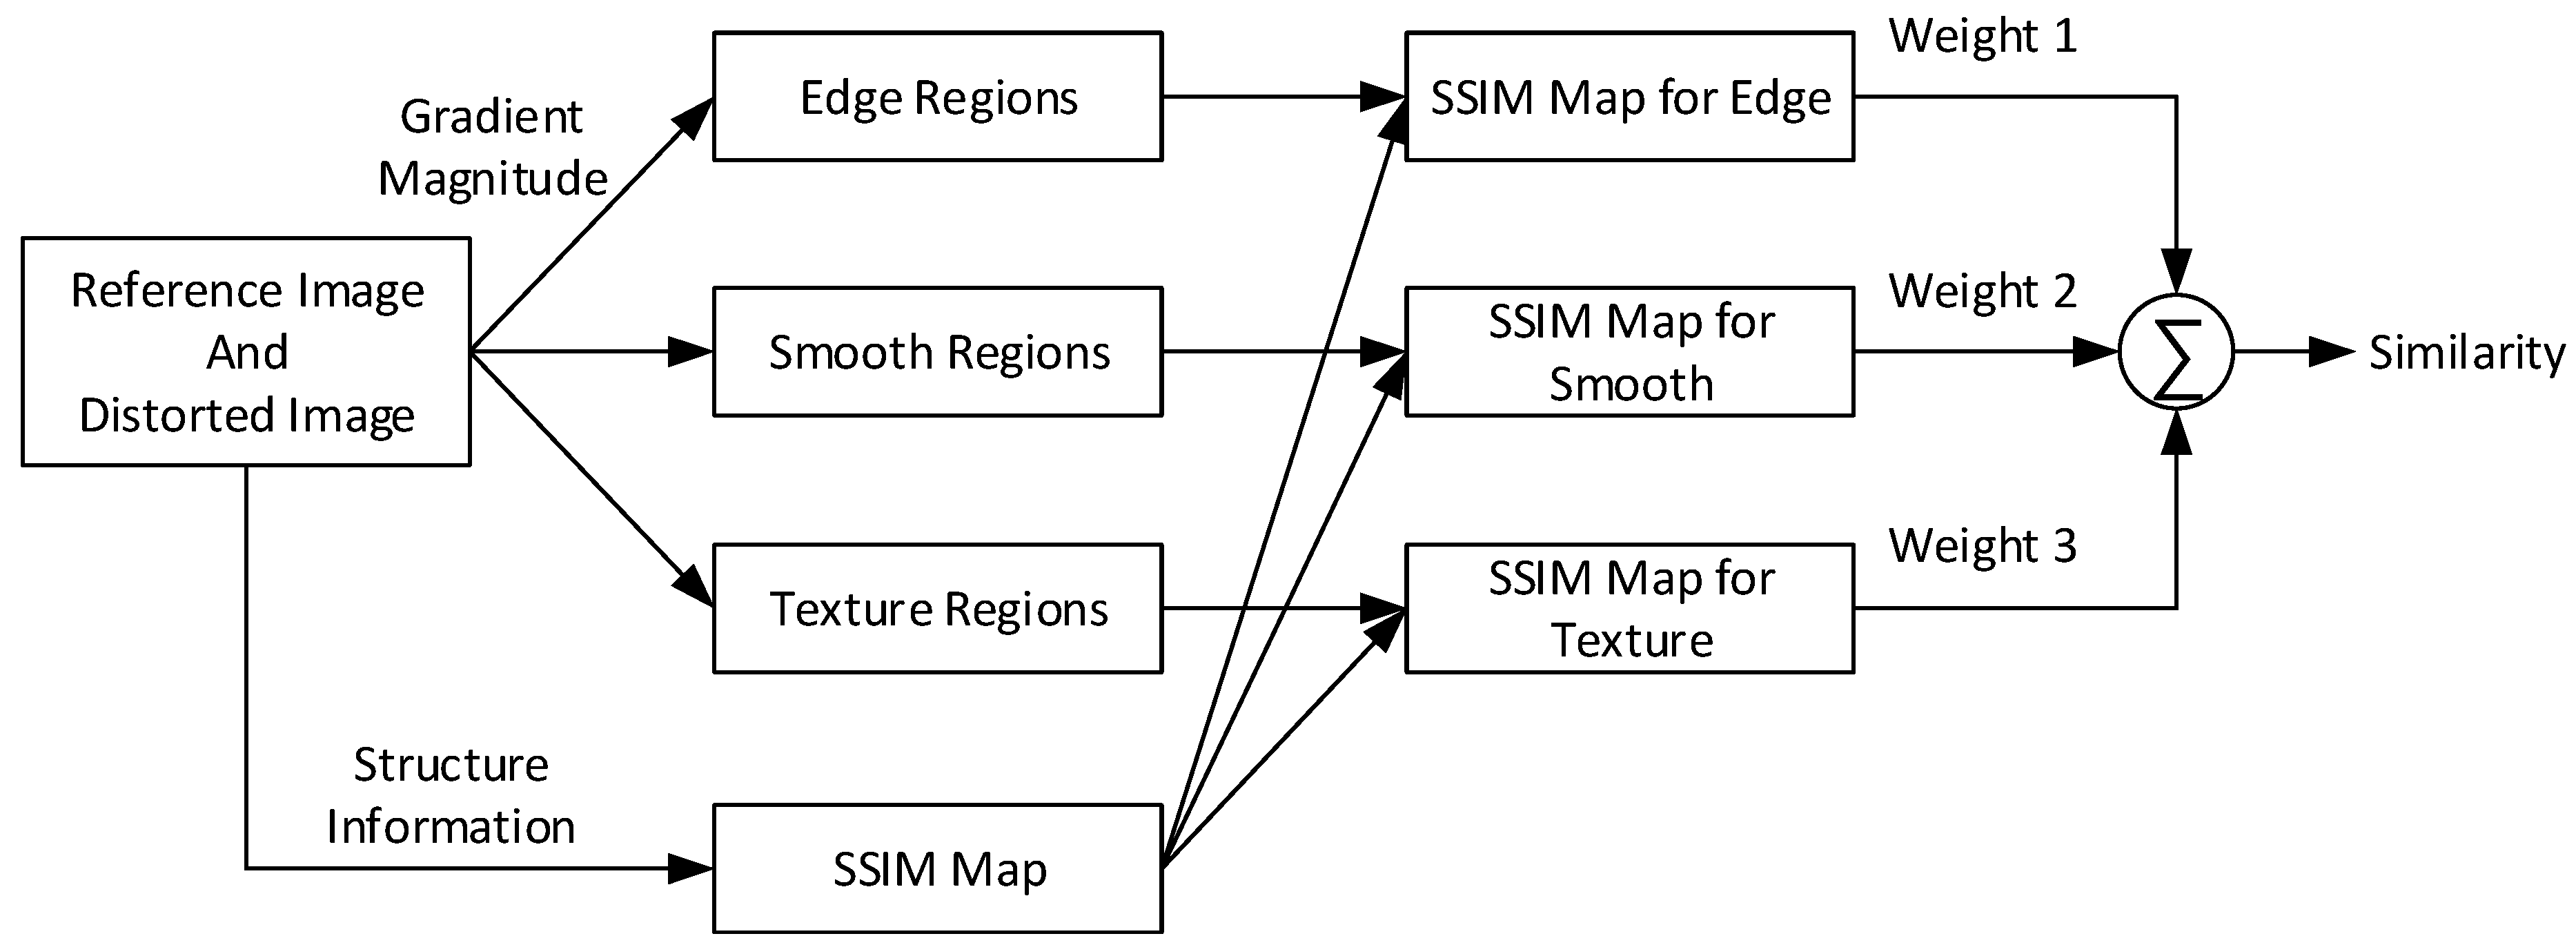
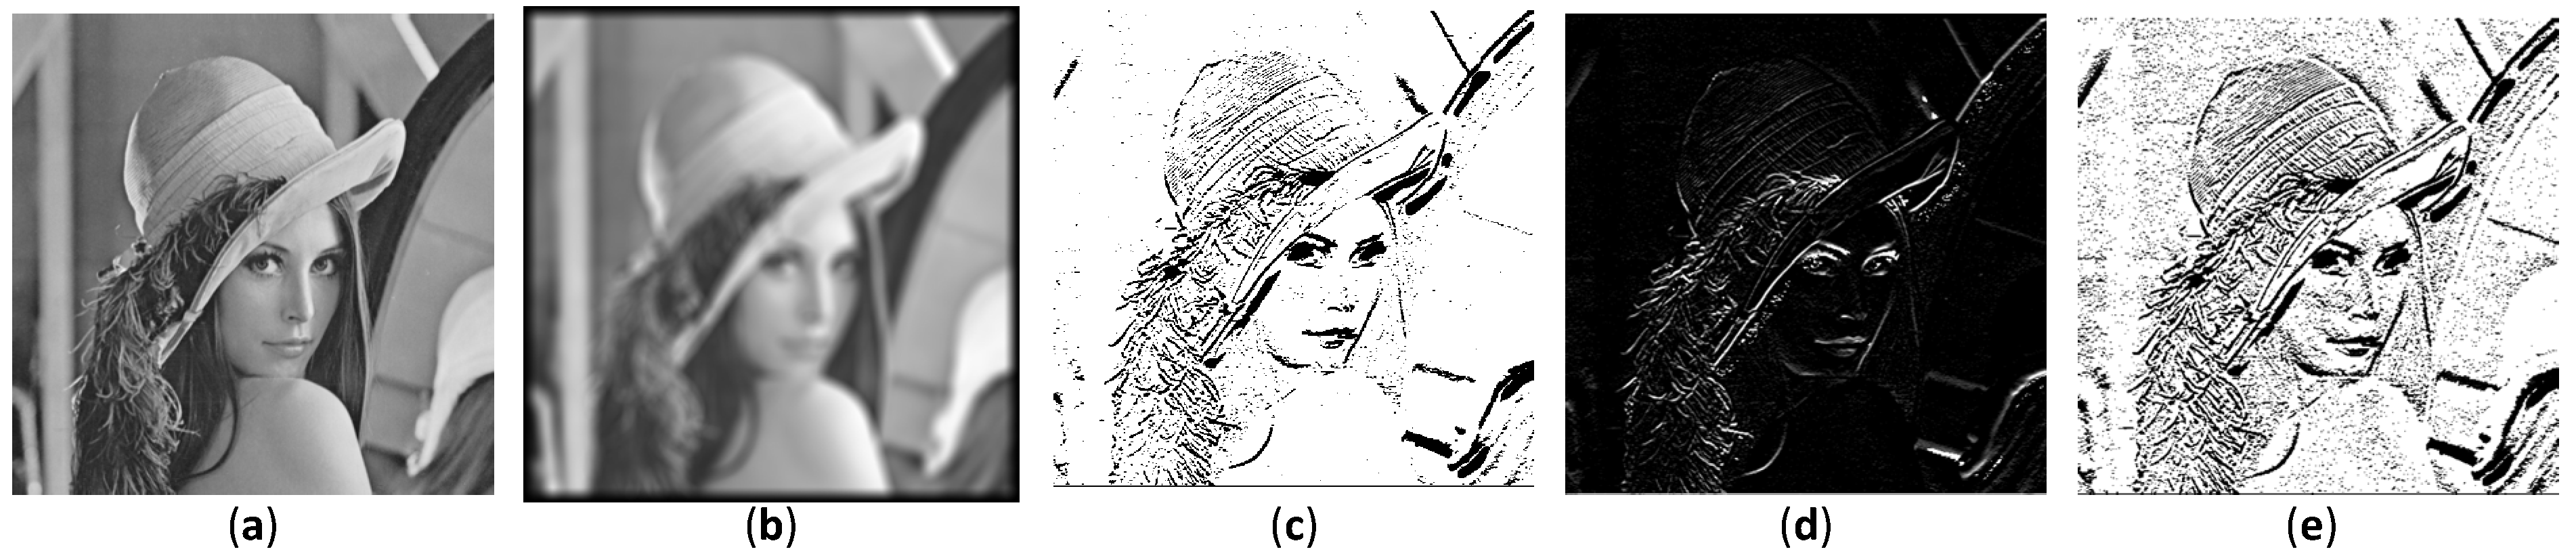
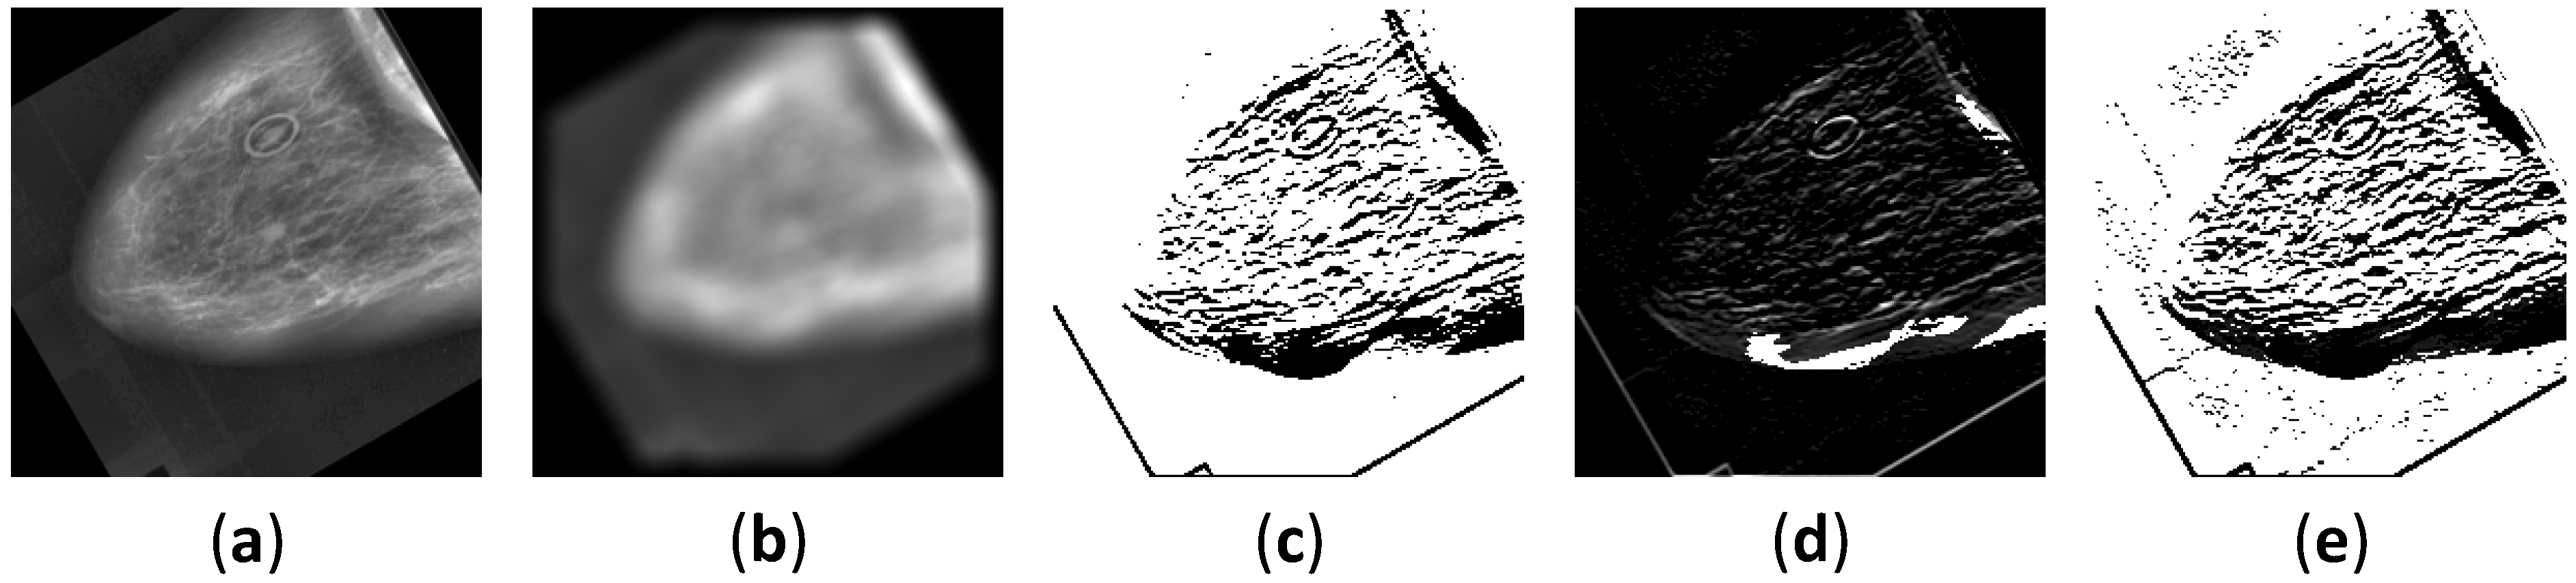
Figure 13 shows the images for every process in a specific region for three-component SSIM.
Figure 13a depicts the original DDSM right breast masses benign cancer with craniocaudal (CC) view image,
Figure 13b shows its blurred image,
Figure 13c depicts the edge region image,
Figure 13d shows the smooth region image, and
Figure 13e depicts the texture region image.
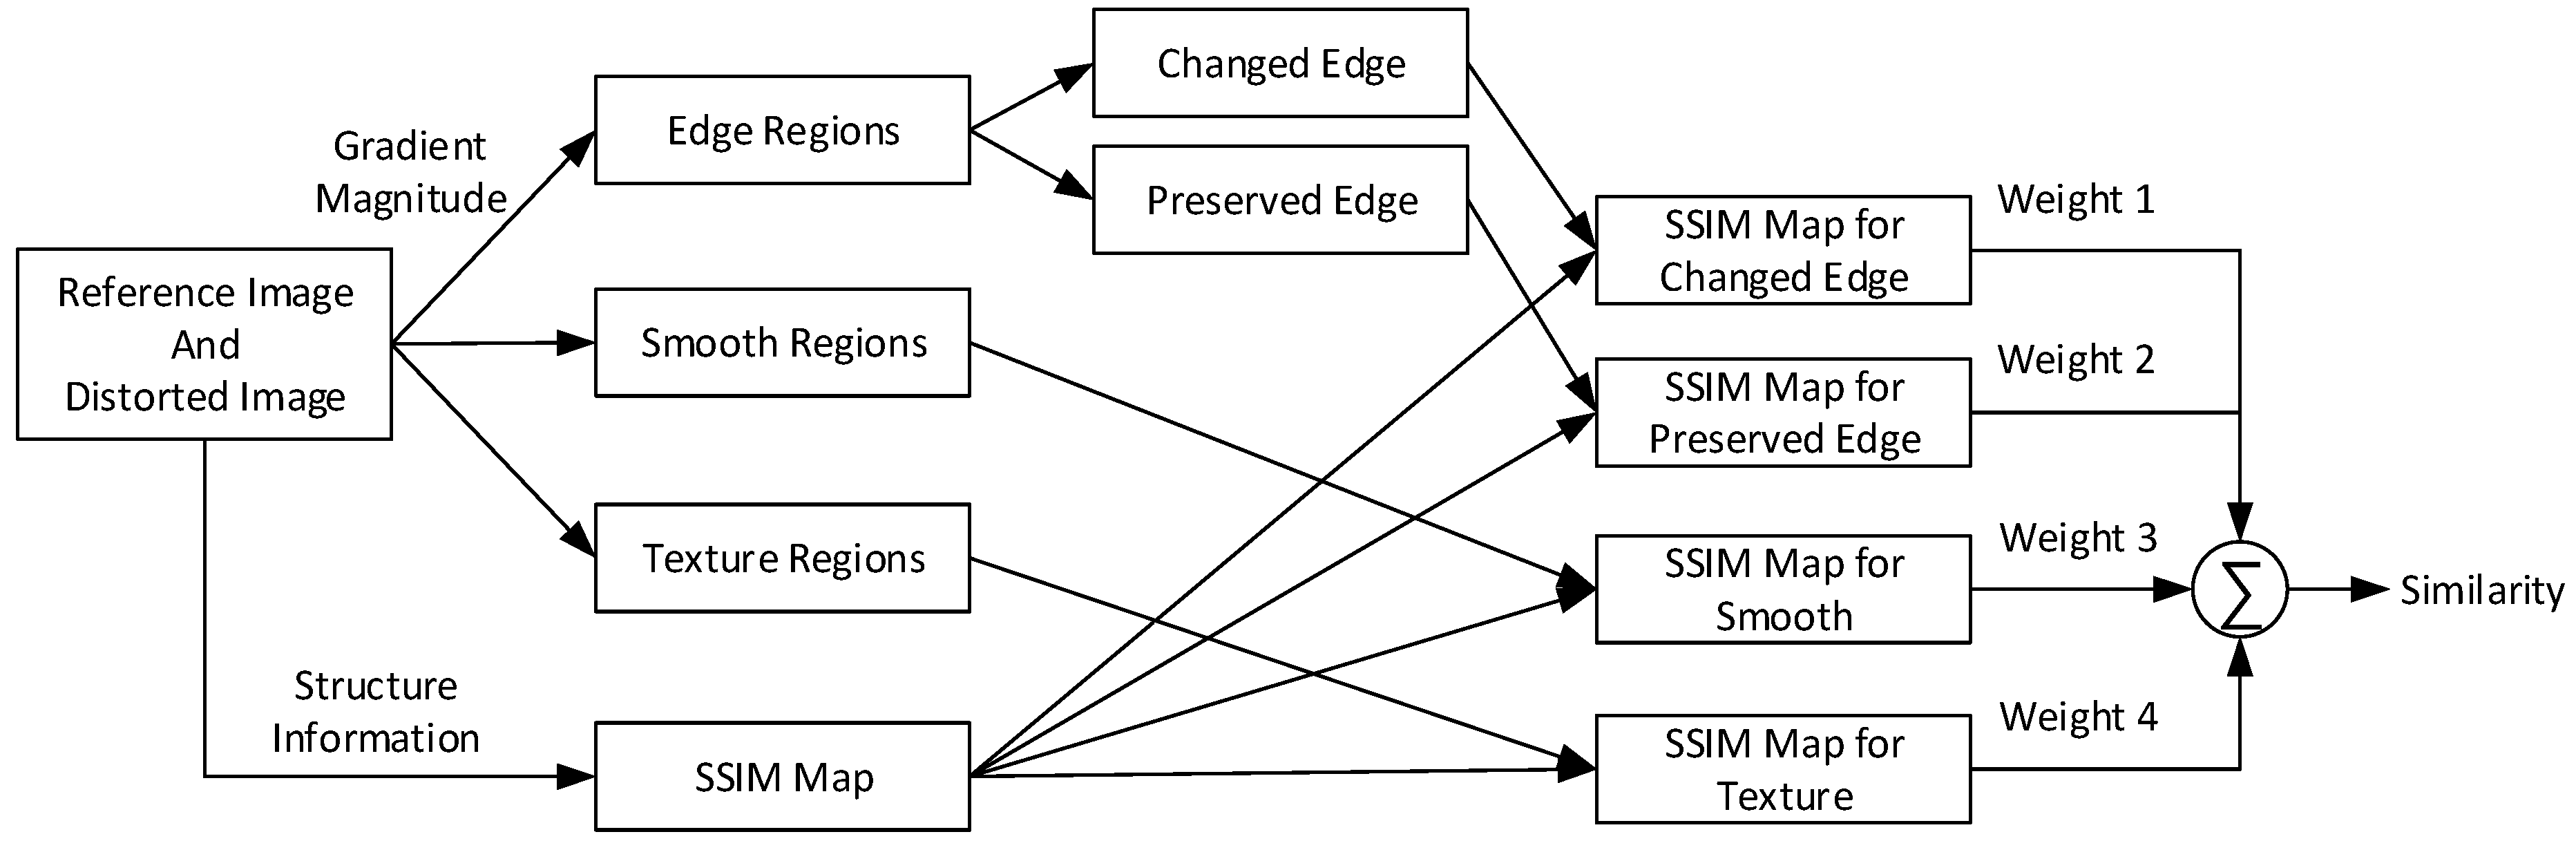
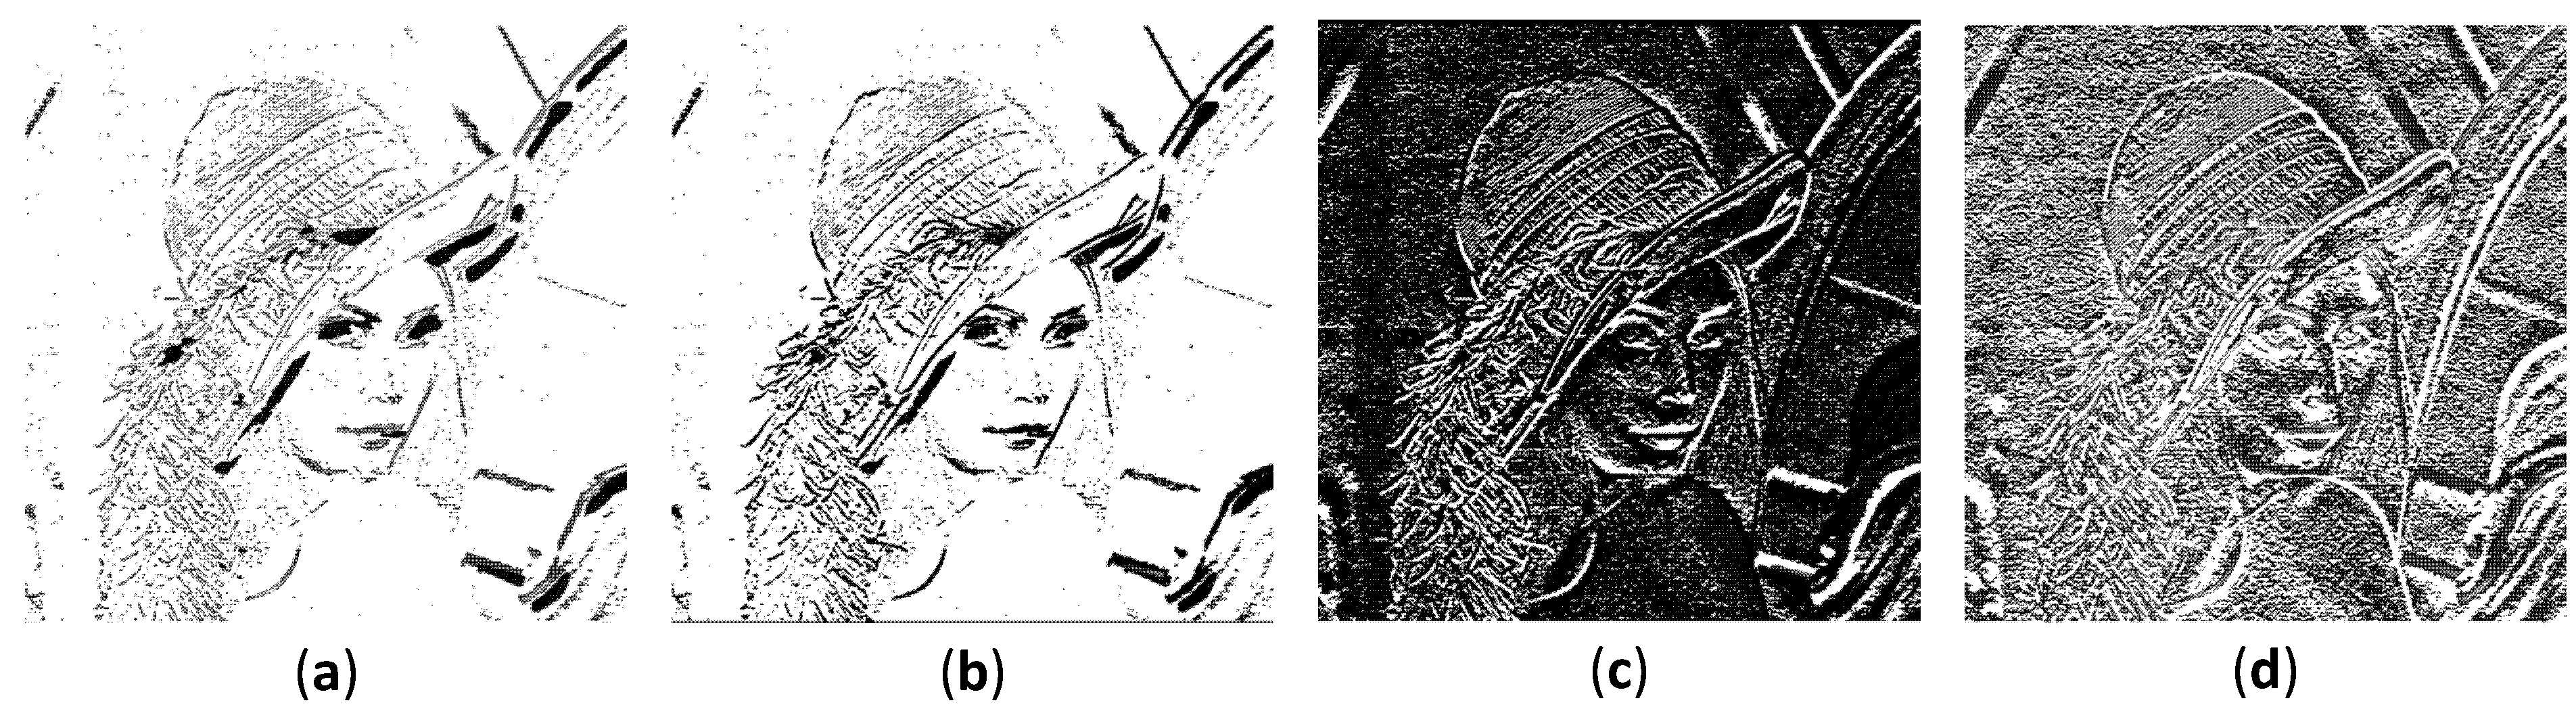
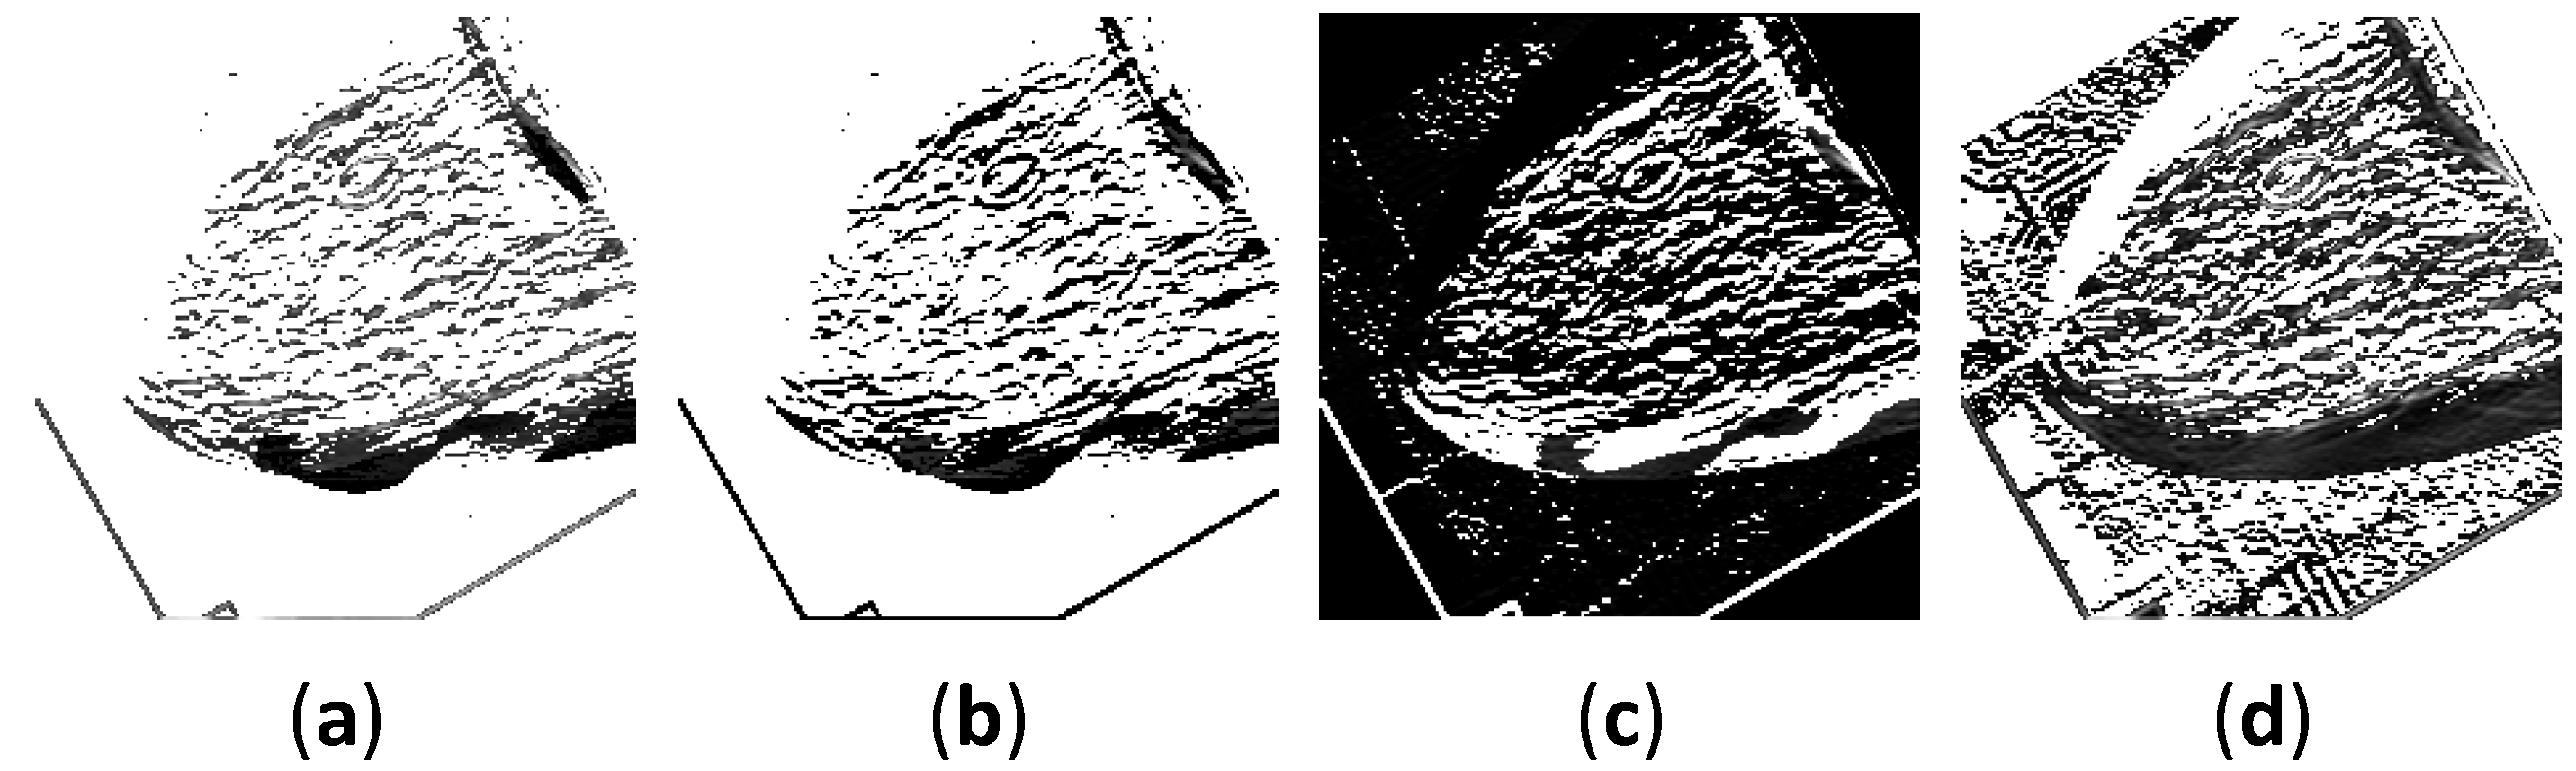
Figure 14 shows the images for every process within a specific region for four-component SSIM.
Figure 14a depicts a preserved edge image of DDSM right breast masses benign cancer with CC, whereas
Figure 14b shows a changed edge region image. In addition,
Figure 14c displays a smooth region image, and
Figure 14d depicts a texture region image.
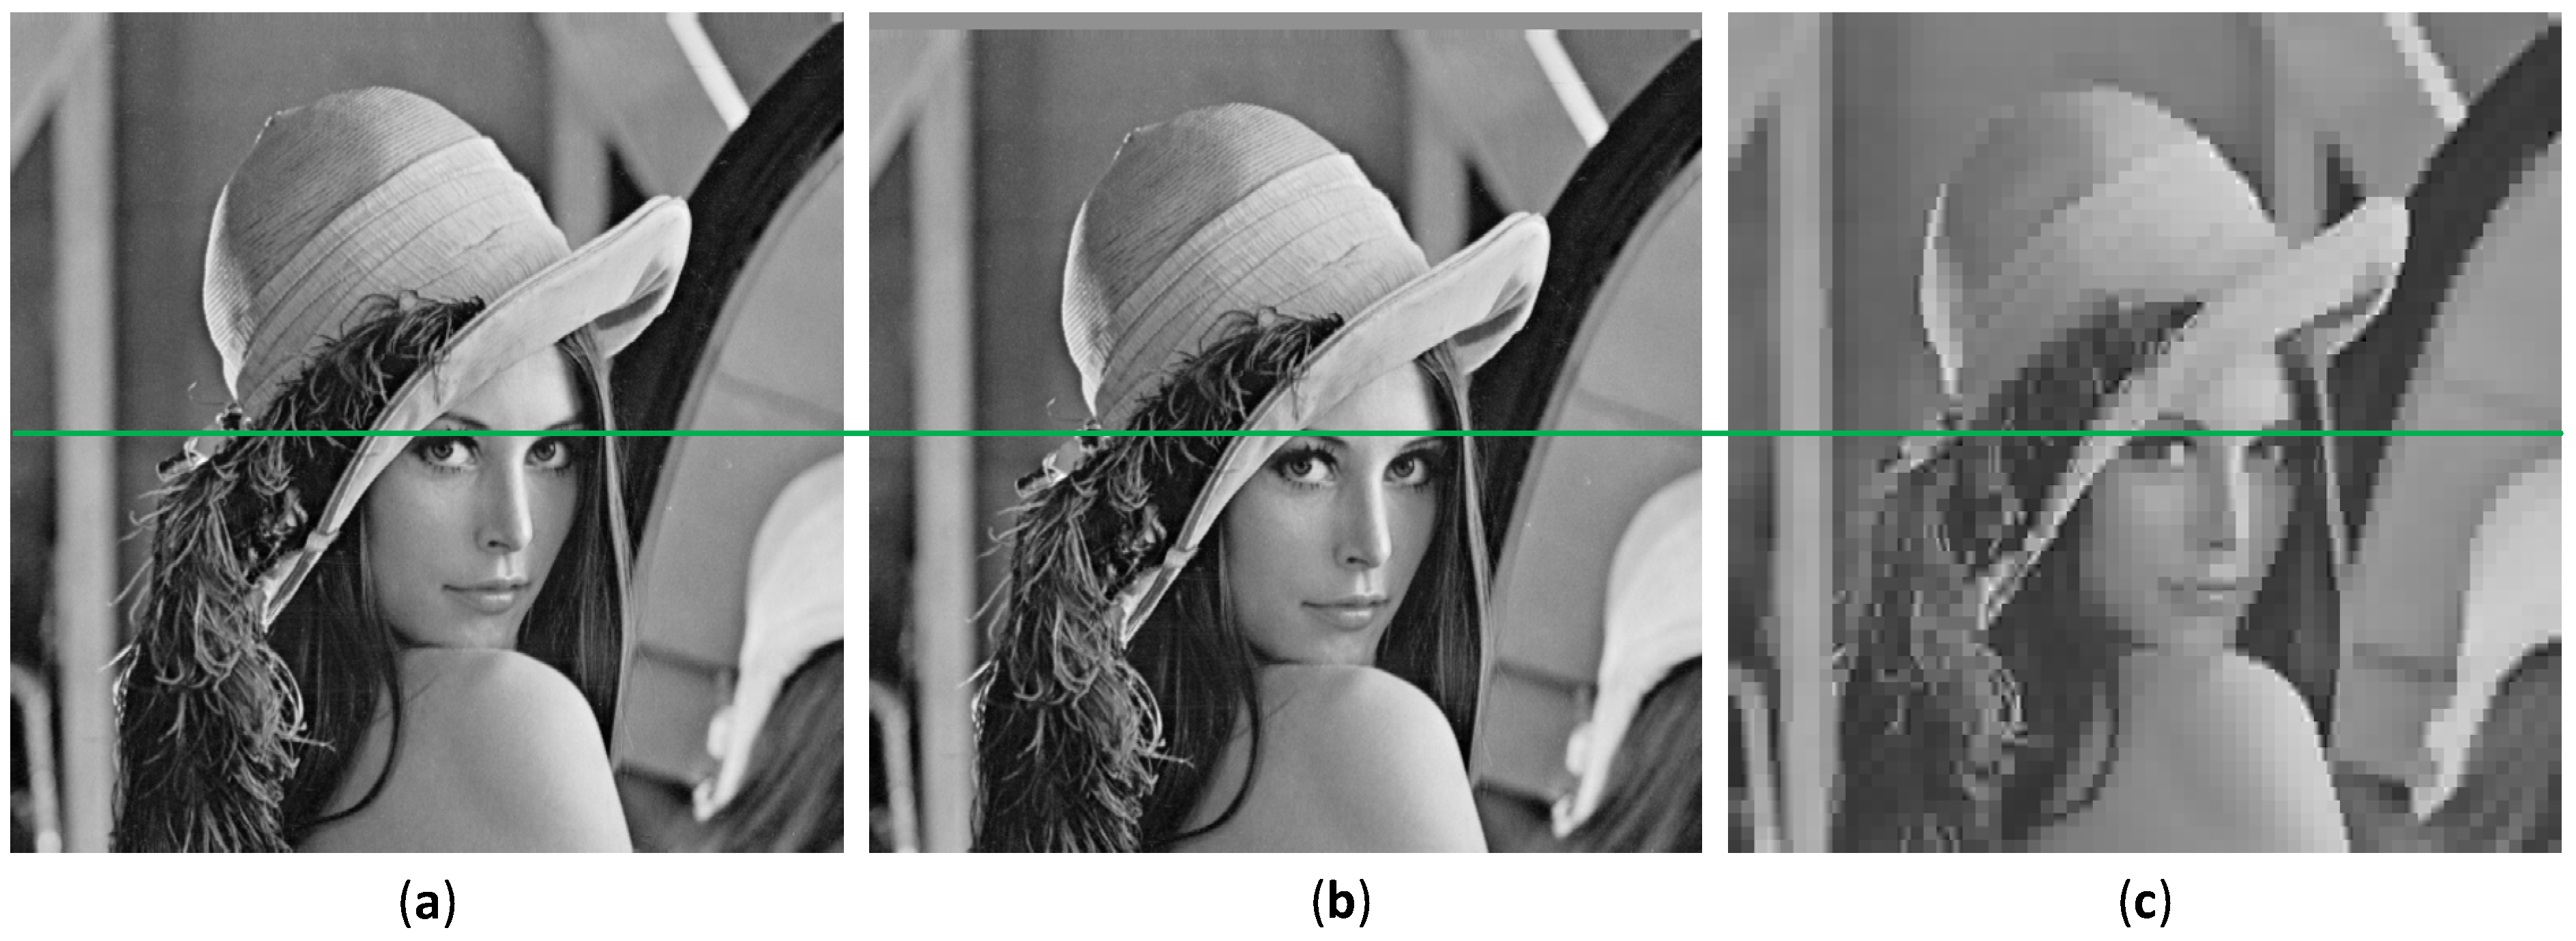
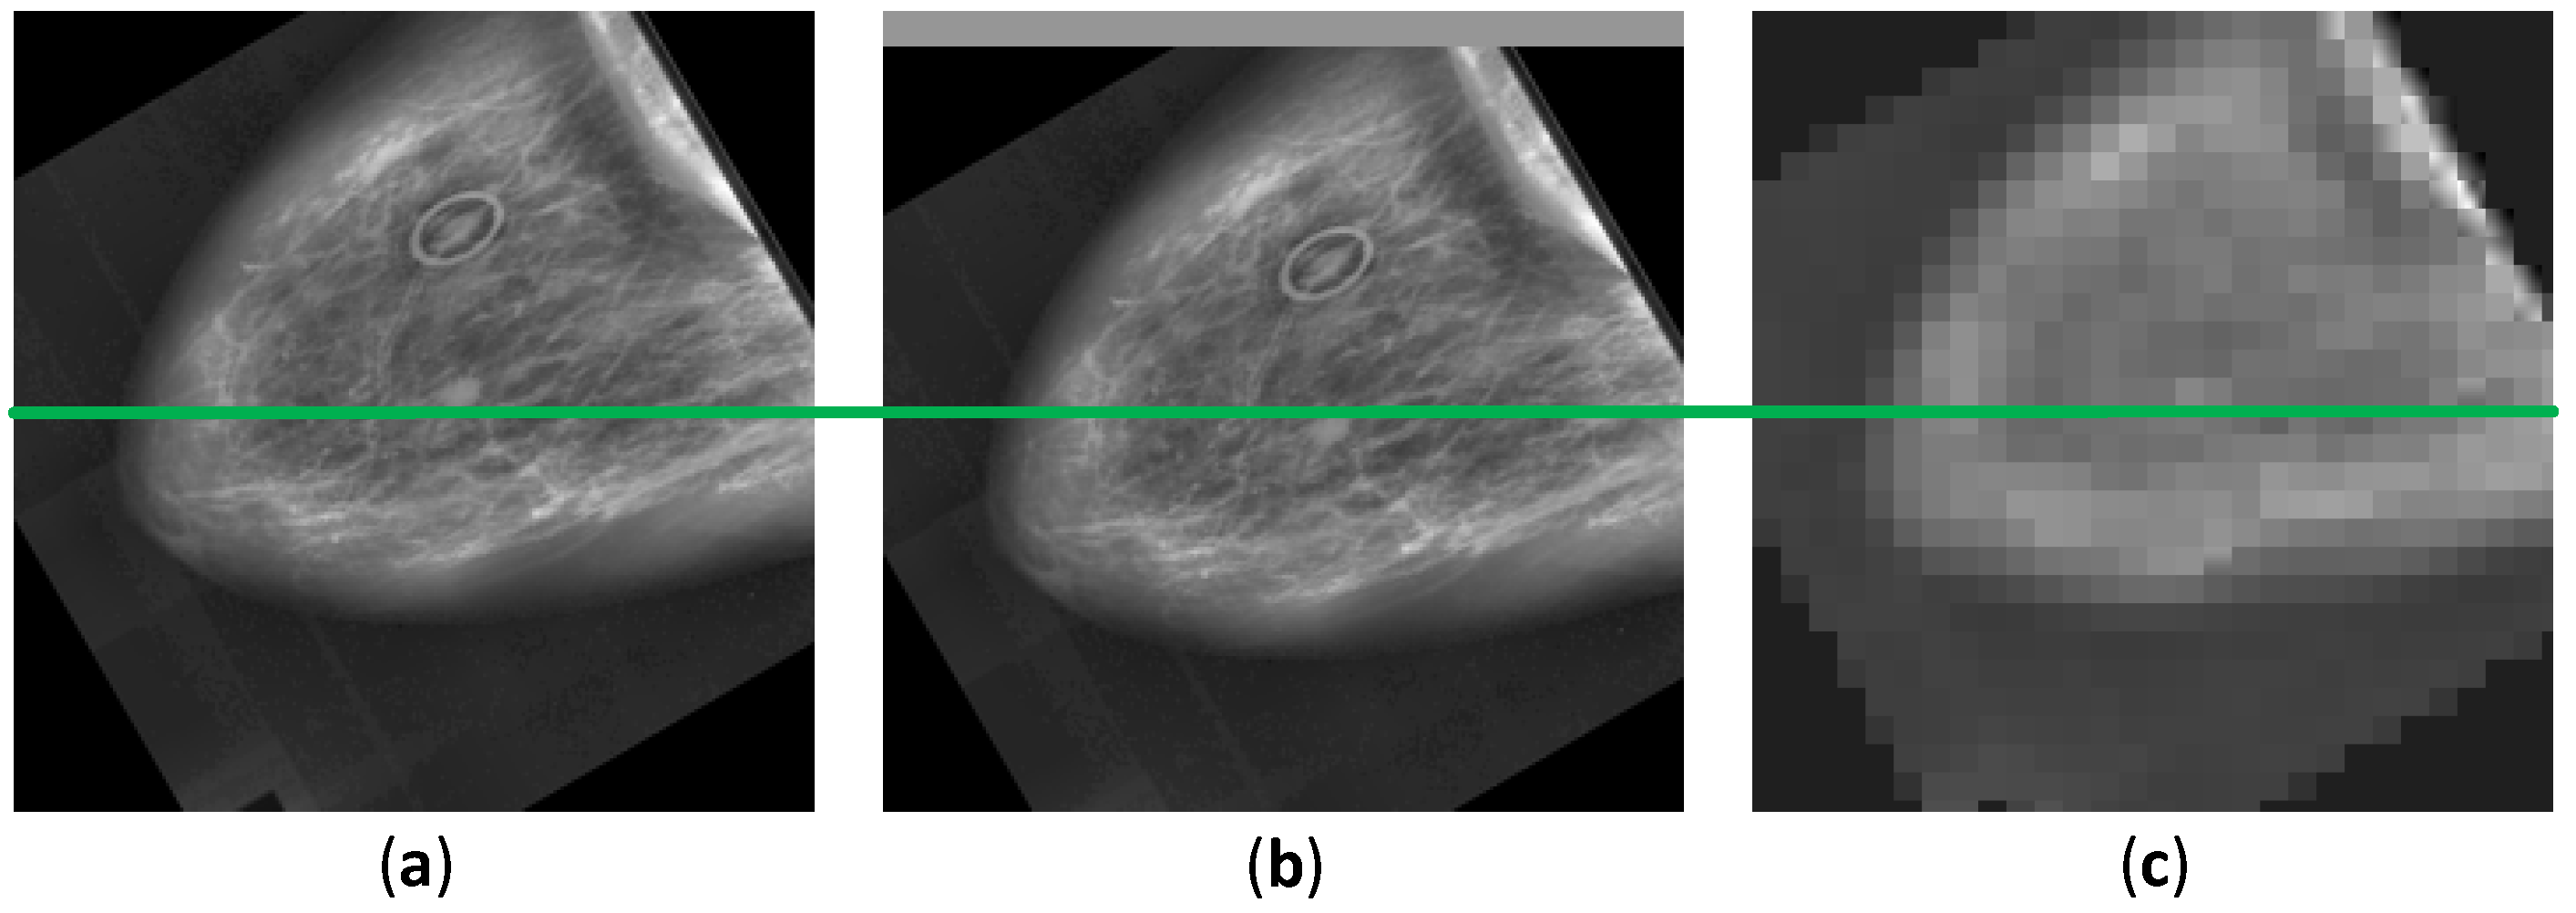
Figure 15 shows a demonstration of using DDSM right breast masses benign cancer with CC image to present the original, spatial translated, and JPEG compressed images with a green line in the vertical center of the images. As compared, the JPEG compression image is less perceptible than the image with the spatial translation, as shown in
Figure 15b,c when they are compared with the reference image, as shown in
Figure 15a. As depicted in
Figure 13,
Figure 14 and
Figure 15, using the image processing steps for medical images, we may compute the similarity score to obtain the image quality. These motivated us to review articles related to SSIM in the medical field.
4.1. Magnetic Resonance Imaging
To the best of our knowledge, the first SSIM implementation for evaluating the images of MR was in 2005 [
82,
83]. The attempt in [
83] used distorted MR images and then compared them with the original MR image. Three modules creating a closed-loop system containing de-noising filters, evaluations method, and adjustment rules were used. The corrupted images were examined using SSIM along with the mean absolute error (MAE), root-mean-square error (RMSE), SNR, and PSNR. Their results indicate that SSIM shows a high similarity score when the distorted images are close to the reference image. This is the first time an exploration of the original SSIM was started for use in other applications, such as MR medical images. As we mentioned previously, the original SSIM may interpret the blurred images with a high similarity score owing to the effect of the structural comparison. However, their results indicate that SSIM has the potential to assess medical images. In addition, in [
82], the SSIM showed a relatively decent performance to quantify the head MR images. However, there were inconsistencies in the
and
quality factors. Various quality factors were deployed to acquire the similarity value. Nonetheless, with the higher quality factor of compression, the SSIM predicted the similarity with a low score and was deemed unsuitable for the quality metric in [
82].
In 2007, a group of researchers applied an SSIM application for security in the MR and computed tomography (CT) images related to the watermarked medical images [
31]. Medical image watermarks are crucial because they may comprise the medical information of the patients, proving ownership, and alternating location on the images. Moreover, watermarked medical images frequently store hidden messages for later extraction to obtain the reports. Their results showed that SSIM is less capable of measuring the degradation of medical images when the images are embedded with a watermark. They speculated that the best metric for a watermarking measure is a steerable visual difference predictor (SVDP). By contrast, SSIM and a quality index based on local variance (QILV) have been exploited for the quality measure of estimating the magnitude of MR based on the linear minimum mean squared error (LMMSE) [
84]. The SSIM in this task performed competitively in measuring images fused with an LMMSE estimator.
The compression of medical images is challenging in teleradiology because teleradiology requires transmission to transfer the images [
85]. In the transferring process, the image quality may be reduced owing to the limited communication, and thus the image fidelity can be decreased. The quality measure is necessary to determine the threshold value to compress these medical images; hence, in the transmission, the important information of the images is not diminished. A partitioning in hierarchical tree (SPIHT) compression algorithm has also been used to determine the maximum threshold standard for compression. The compressed images were compared with their original to assess their similarity. In this specific task, SSIM and PSNR showed agreeable results with the mean opinion score (MOS), and thus for this case, SSIM is considered appropriate to cut off the threshold value when the medical images are compressed with a defined bit rate. Subsequently, medical image fusion to improve the confidence of radiologists in diagnosing a specific disease was accomplished in 2009 by Zhang and Zheng [
86]. The objective of this research is to decrease the inconsistency of a diagnosis when subjective observers read the medical images. In addition, SSIM contributed significantly to the fusion approach. A unique SSIM implementation in this article was shown because SSIM was not used as the IQA metric; instead, it was utilized as the image fusion itself. Based on an understanding of the image fusion from several imaging modalities, the decision confidence may be improved, and the images combined from MRI and CT were employed to generate more perceivable images. Because CT can offer better information in denser tissue with less distortion and MRI provides adequate imaging for soft tissue, a fusion was executed to reduce the workload of the radiologists. Their results indicated that image fusion using SSIM is remarkable compared with existing image fusion methods, such as a Laplacian pyramid (LP), gradient pyramid (GP), contrast pyramid (CP), steerable pyramid (StrP), and discrete wavelet transform (DWT).
For a denoising method to remove Rician noise from MR images, the SSIM and MSE as objective metrics were compared with the MOS to measure the denoising methodology using the discretized total variation [
87]. In this study, SSIM performed suitably with the MOS, which is related to HVS. With the highest standard deviation, the SSIM scores diminished following the subjective measurement scores. In addition, in 2013, to reduce the presence of aliasing, an improve compressed sensing technique was introduced, whereas the SSIM and PSNR were the objective measures used to assess the effectiveness of this approach [
37]. Their results showed that SSIM is suitable for use with the proposed method as an objective IQM. Subsequently, in 2015 and 2017, to restore the MR images from the existence of noise during the acquisition steps, the SSIM along with SNR, PSNR, MSE, and RMSE was used to evaluate novel denoising algorithms [
40,
88,
89,
90]. With the computational improvements, an artificial intelligence (AI) method including deep learning has been proposed to solve the medical image analysis issues, and the results were compared using SSIM [
38,
39,
91,
92,
93,
94]. SSIM was also compared with other objective IQAs to obtain comprehensive insight related to an effective IQM for diagnosis by five radiologists [
36] and was employed in measuring an image acquisition [
95].
To conclude this subsection,
Table 1 briefly presents the SSIM applications for MR medical images. In
Table 1, SSIM is adopted not only for IQA but also for other purposes, such as image fusion, segmentation, clustering, and loss function. In addition, compared to other metrics, SSIM performances are competitively adequate according to the applied task. Most of the SSIM implementations as an IQA showed that SSIM is suitable for an assigned task, indicating that it offers reliable performance for measuring an enhancement of the image quality in comparison to the other traditional measures.
4.2. Computed Tomography
To the best of our knowledge, SSIM was used for the first time to evaluate CT images in 2007 and was assigned as the IQM for image fusion between CT and MR images [
96], as well as for CT, US, and X-ray medical image compression using DCT [
97]. According to [
94], SSIM was able to quantify the improvement of fused images by showing the tumor location, whereas in [
97], the SSIM aided in assessing the compressed medical images to determine the optimal block size for use in a compression method. SSIM showed a decreasing similarity score when the compressed block size was increased. This situation states that the SSIM can measure well the quality of the images according to the compression level. More compression makes more blurriness. With a certain blurriness, the medical images may not be easily readable, thus leading to the wrong diagnosis in telemedicine. The compression level is crucial because, with abundant compression, the important structural information of the images may be lost. By implementing the objective IQM, the threshold value of the compression level can be identified. Herein, we imply implicitly that SSIM has the potential to develop into the direction of a computer-aided diagnosis (CAD) method.
In 2016, studies related to SSIM for CT images were identified for investigating the ability of a denoised method utilizing a Wiener filter and the threshold in the wavelet domain [
62]. In addition, a two-dimensional (2D) filter to enhance the CT image resolution by maximizing the SSIM similarity value [
98], a low-dose CT denoising algorithm using locally consistent non-local means (LC-NLM) [
63], and fusion between CT and MR images implementing a principal component analysis (PCA) and the maximum selection [
99] were developed. These four studies presented SSIM as a reliable quality measure to assess the improvement of the images. In 2017–2019, SSIM was found to be a quality metric for measuring the results from 3D printed lung vessels [
100], an approach to reducing the metal artifact in CT images by excluding the luminance comparison [
101], an IQM for deep learning [
41,
43,
102], and an alternative random forest (ARF) regression tool [
103]. It was also used for CT tooth images extracted from denoised images filtered using a wavelet and bilateral filter [
65], the removal of Gaussian noise [
42], and image restoration and reconstruction [
64]. In [
101], the role of SSIM was distinguished from IQA as a method to reduce the artifacts caused by metal. In addition, a modified SSIM was utilized to construct this task by ignoring the luminance factor but maintaining the contrast and structural comparisons. This modified SSIM should be completed because the metal artifacts and a superposition map may vary substantially, whereas the structural or edge information can be indistinguishable. With the role of SSIM, correlated images can be obtained, and two correlation maps can then be compared to acquire reduced metal artifact images. In 2020–2021, SSIM was used as an evaluation metric for ovarian cancer [
104], a generative adversarial network (GAN) [
105], and Franken-CT [
67].
To conclude this subsection,
Table 2 describes SSIM used for CT medical images. As indicated in
Table 2, SSIM has been embraced not only for IQA but also for other objectives, such as noise reduction. In addition, compared to other metrics, SSIM performs competitively well according to the specialized task. In practical terms, all SSIM roles listed in
Table 2 are for image quality measures. They indicate that SSIM has the potential to become a favorable IQA.
4.3. Ultrasonography
We review SSIM applications for ultrasonography in this section. We found that the first implemented SSIM for US was in 2007. SSIM along with the SNR, coefficient of correlation (CoC), edge preservation index (EPI), and QI were used to quantify the image enhancement when a versatile wavelet domain algorithm was utilized [
106]. In the same year, US with two other medical images, CT and X-ray images, were measured using SSIM, MSE, PSNR, CC, and PRD to identify the effectiveness of a novel algorithm for compressing images in the field of teleradiology using an adaptive threshold value of variance [
107]. In 2008, an algorithm was developed to reduce the effects of speckle, and the developed algorithm was measured with the Michelson contrast measure (CM), the Beghdadi and Le Négrate contrast measure (CBN), PSNR, and SSIM [
108]. Their results showed that SSIM has potential effectiveness as an IQM for the US, although, at the time, SSIM had existed for only 3 or 4 years.
The reduction in speckle in US images has brought several types of studies to this issue. In 2016, the least-squares Bayesian [
60], adaptive non-local means [
109], local statistic, and non-local mean filter [
110] algorithm estimations were established to reduce the speckle in US images, and several IQAs including SSIM, SNR, MSE, and a sum of the variance (SV) were designated to evaluate the improved algorithms. An uncommon SSIM implementation was conducted using CW-SSIM as a contour extractor of a tongue by Xu et al. [
61,
111]. They compared the performance of MSSIM and CW-SSIM with the normalized PSNR (NPSNR). MSSIM and the NPSNR demonstrated similar results, whereas CW-SSIM presented superior results by showing the tongue position with the peak of CW-SSIM.
Apparently, more attention from researchers was drawn in 2017–2021 for creating an efficient algorithm to eliminate speckle in US images [
58,
59,
66,
112,
113,
114,
115,
116,
117,
118]. In addition, US images can be analyzed using deep learning to conduct breast tumor segmentation and reconstruct images from raw channel data [
53,
119]. In [
53], the combination between SSIM and L1-norm in the loss function was applied to capture the local context information from the surrounding tumor area, whereas in [
119], MS-SSIM and PSNR were utilized as the loss function.
To conclude this subsection,
Table 3 illustrates the purposes of using SSIM for US medical images. As indicated in
Table 3, SSIM is accepted not only for IQA but also for other purposes, such as a contour extractor and loss function. In addition, compared to other metrics, SSIM performances are competitively appropriate according to their dedicated assignment.
4.4. X-ray
The fourth discussion on medical images is focused on X-ray images. Unlike MRI, CT, and US images, SSIM implementation for medical X-ray images was introduced in 2012 for the first time to the best of our knowledge. As is typical, SSIM was constructed to measure a designated algorithm to estimate the similarity score between the ground-truth image and the denoised images. In 2012, SSIM, PSNR, SNR, and MSE were appointed to evaluate an improved algorithm [
120]. Similarly, in 2016, a method to eliminate Gaussian noise was established using an edge preserved wavelet packet transformation [
121], and the denoising of a contrast-enhanced X-ray image was accomplished [
122]. In addition, SSIM was allocated together with the MSE, RMSE, SNR, PSNR, recall, accuracy, precision, and error rate as an objective IQA. Subsequently, in 2017, a security watermark algorithm was developed to secure the diagnostic information of a patient, as well as the ownership and authentication [
123] in X-ray and MR images. Again, SSIM has a role as an IQM along with wavelet domain SNR (WSNR) and PSNR. The feasibility of SSIM was not only shown for a numerical analysis but also in regard to deep learning, such as a CNN. The improved algorithm with deep learning may be measured using SSIM related to compression and noise reduction [
124,
125,
126,
127]. Moreover, comparisons of filter techniques used to reduce the noise and image reconstruction, as well as apply image compression, were conducted using X-ray images [
44,
128,
129,
130].
To conclude this subsection,
Table 4 exemplifies the purposes of using SSIM for X-ray medical images. As in
Table 4, we describe the whole article using X-ray images conveying the SSIM metric as an IQM.
4.5. Optical Imaging
To complete the reviews of SSIM implementation in medical imaging systems, we presented a novel modality using optical imaging. Because optical imaging is a relatively new modality, acquiring SSIM applications in optical imaging is considered rare. Despite our best efforts, we found only two articles comprising SSIM as an IQM to measure the distorted medical images related to the reference images. We excluded optical imaging using SSIM for a scope other than the medical field, such as optical imaging for communication and simulations to predict the optical properties of a reconstruction. In 2020, SSIM along with MAE were utilized to examine images from a single snapshot of optical properties (SSOP) and the ground-truth images [
131].
In 2021, SSIM was used for comparing the optical images of a mouse with an embedded tumor [
132]. The article reported the application of machine learning, such as K-means and fuzzy c-means, to automatically cluster the tumor. They compared the results between manual clustering and automatic clustering with the aid of SSIM and the Dice coefficient to evaluate the similarity of two images. Here, SSIM performed satisfactorily in objectively examining the segmentation results through a manual approach, showing a similarity score of
. In addition, when Gaussian noise was added to the background, SSIM demonstrated a robust performance by showing a stable similarity score. With the assistance of SSIM, the article reported that their clustering algorithms are robust to noise.
To conclude this subsection,
Table 5 represents the purposes of using SSIM for optical medical images. As in
Table 5, we describe two articles using optical images assigning the SSIM metric as an IQM.
4.6. Current Status of SSIM Research in Medical Imaging
We identified that the SSIM applications evolve from only for IQA to be able to implement as a loss function in CNN, reducing metal artifact, and contour extractor. Therefore, this section describes the articles using SSIM for such goals with a “*” mark, as shown in
Table 1,
Table 2,
Table 3 and
Table 4.
4.6.1. Loss Function
The loss function along with the activation function, optimizer, and other hyperparameters in CNN is an essential parameter to predict the model architecture ability. A common loss function is MSE since it can provide simple mathematical expressions. In 2021, Jaubert et al. attempted to develop a CNN-based algorithm to suppress the artifact of phase-contrast cardiac MR images in real time. Here, they assigned MAE and SSIM as the loss function when training the model architecture. They called their CNN model U-Net MAE and U-Net SSIM [
38].
To begin their study, they prepared the synthetic dataset using breath-hold, retrospectively cardiac gated, uniform density phase-contrast MR in the aortic position. The dataset was comprised of combinations between magnitude and phase subtracted images. They split the dataset into training images and 15 images were for validation and test dataset each. The ground-truth training dataset was obtained by interpolating the phase-contrast MR images to the target temporal resolution. To generate the corrupted images, the original dataset was processed using Fourier transform and undersampled utilizing the chosen trajectory. Then, with the inverse Fourier transform, they acquired the aliased data. The ground-truth and noise-contaminated images were normalized and cropped into .
After the dataset preprocessing, they fed the dataset into the U-Net architecture for training. U-Net model consisted of max-pooling, transpose three-dimensional (3D) convolution, 3D convolution, and 1D convolution layers. They trained the model by implementing an adaptive moment estimation algorithm (Adam) as the optimizer, a batch size of
, an epoch of
, as well as with an initial learning rate of
. To complete the configuration, they assigned two loss functions, namely MAE and SSIM (AvgSSIM). Especially for SSIM, the loss can be computed with the complex images over the real (real) and imaginary (imag) elements, as follows
These loss functions were utilized to obtain the selected best performance of the U-Net with the most minimum loss calculated from the validation dataset. To measure the effectivity of their U-Net, MAE, PSNR, average SSIM, magnitude SSIM, and phase SSIM were applied.
According to their results, U-Net MAE and U-Net SSIM have a significant improvement to suppress the artifact when compared to the gridded images. Additionally, U-Net SSIM enhanced the images’ sharpness, whereas U-Net MAE was deemed blurrier. U-Net MAE was superior when the metric evaluations were MAE and PSNR; meanwhile, U-Net SSIM was exceptional in the average SSIM, magnitude SSIM, and phase SSIM. Moreover, they compared the U-Net MAE and U-Net SSIM using flow compensated, flow encoded, and combined images to obtain the denoised images. Both U-Net performed sufficiently with the magnitude images. However, U-Net SSIM was remarkable in denoising the phase images compared to U-Net MAE. With these results, U-Net SSIM outperformed U-Net MAE for the pediatric patients with congenital heart disease.
4.6.2. Reducing Metal Artifact
A metal artifact can exist due to the presence of high-density objects, i.e., dental fillings and surgical clips. In CT imaging, the presence of metal artifacts causes issue of complications in imaging the region of interest (ROI) and may reduce the dose calculation accuracy. In order to suppress the metal artifact, a robust metal artifact reduction (MAR) algorithm is vital to be established. Therefore, in 2019, Kim et al. tried to develop a MAR algorithm based on the tilted CT scan images. Their idea began from the understanding of the normal CT scan position may produce metal artifact contaminated images, and the tilted CT scan can complement the original CT scan position by offering reconstructed images with less metal artifact. Additionally, to obtain the less metal artifact images, they implemented modified SSIM by neglecting the luminance factor and only considering the contrast and structure components in the calculation. They claimed that the luminance factor containing intensity in the areas with the metal artifact between CT images and the superposition map is different completely, whereas the edge information is fairly identical. Thus, the correlation map calculated using the original SSIM may not accurately predict the metal artifact similarity score [
99].
The algorithm steps are described in Algorithm 1 for MAR with SSIM.
| Algorithm 1. MAR with SSIM |
Input: Reconstructed original CT and tilted CT images
Output: Reconstructed image with the smallest SSIM
for reconstructed images of original CT and tilted CT do Subtract original CT and tilted CT images Obtain the artifact map windows Obtain the original CT and tilted CT correlation maps Compare original CT and tilted CT correlation maps that contain SSIM score if original CT SSIM < tilted CT SSIM do Choose the intensity of the original CT image as the best reconstruction image Otherwise do Choose the intensity of the tilted CT image as the best reconstruction image End if End for
|
To show the superiority of their proposed MAR, they compared the proposed method with well-known linear interpolation metal artifact reduction (LI-MAR), normalized metal artifact reduction (NMAR), and refined metal artifact reduction (RMAR). They obtained an exceptional result when using MAR with SSIM by presenting a mean absolute percentage error (MAPE) of , whereas the original CT scan, tilted CT scan, LI-MAR, NMAR, and RMAR exhibited , , , , and , respectively, in the simulation study. Moreover, in the experiment study, they extended the proposed method by combining it with RMAR and generated two new methods, namely tilted CT-based MAR (T-MAR) and augmented tilted CT-based MAR (AT-MAR). Particularly when employing AT-MAR, their results indicated that the metal artifact suppression algorithm can reduce the existence of streaks and bright/dark band artifacts near metallic objects by demonstrating MAPE of , whereas original CT scan, tilted CT scan, T-MAR, LI-MAR, NMAR, and RMAR had MAPE of , , , , , and , respectively.
4.6.3. Contour Extractor
Contour extraction for tongue image sequences may be beneficial for speech recognition, speech production, and swallowing study. The tongue images can be obtained utilizing the US modality. In 2016, Xu et al. compensated the manual tongue contour tracking by employing CW-SSIM for re-initializing the tongue contour position automatically [
61]. They considered CW-SSIM due to its invariant with a few rotations, translations, and scaling distortions. They started the procedure by computing the similarity score between the reference image (the first frame image in this case) and the current frame image. In total, they can have a thousand images depending on the number of frames. Then, they set a threshold value of CW-SSIM for the purpose of re-initializing the contour position to the first frame if the similarity score was greater than the designed threshold value (
). Their results indicated that the CW-SSIM along with similarity constraint achieved the best performance by showing the less mean sum of distances (MSD) for three subjects, i.e.,
,
, and
.
4.6.4. Image Quality Assessment
Most of the SSIM implementation is for IQA/IQM since the initial objective of SSIM is to substitute the traditional measures, such as MSE and PSNR. Thus, in this subsubsection, we reviewed one article allocating SSIM as an IQA to complete the comprehensive insight regarding the SSIM prospect for medical image analysis.
The image compression and quality enhancement in medical image processing are substantial factors in reducing the content redundancy to attain the image optimal form when storing and transferring the images. Thus, Pourasad and Cavallaro in 2021 demonstrated two novel algorithms, namely lossless and lossy compression algorithms [
44]. After they compressed the images, they applied several enhancement techniques to acquire the leverage image quality from the compressed images. To assess the algorithms’ performance, they analyzed them with MSE, PSNR, and SSIM. Moreover, lossy compression was used to execute DCT and DWT. Likewise, the lossless method with run-length encoding (RLE) and block truncation coding (BTC) was operated for the study. To achieve a satisfactory medical image quality, two spatial domain enhancement techniques have been used, such as adaptive histogram equalization (AHE) and morphological operations (MO).
Their study employed the medical images from MedPix®, which is a free and open access medical images, teaching cases, and clinical topics database. This database has approximately medical images with patients case scenarios and topics. Their findings indicated that neither AHE nor MO is not suitable for image quality enhancement because the SSIM and PSNR score is decreased after processing the image quality enhancement algorithms. However, their image compression methods are outstanding compared to the other studies, such as the joint photographic experts group (JPEG) and JPEG2000. The best compression can be achieved using DCT with an SSIM of .
4.7. Limitation
We attempted to collect the SSIM-related articles in the medical image analysis to provide a comprehensive review for researchers in guiding the SSIM application for the medical field. However, we limited our reviews by merely describing more detailed information about SSIM implementation as a loss function, MAR, contour extractor, and IQA. We did not describe the SSIM implementation as the segmentation and clustering algorithms as in [
90,
93] in detail. Additionally, for effectiveness, we reviewed one article on the IQA SSIM because SSIM-related articles are usually relative to IQA; thus, it is reasonable to review only one article representing the other IQA SSIM studies. Furthermore, by providing a brief review in
Section 4.1,
Section 4.2,
Section 4.3,
Section 4.4 and
Section 4.5, we may hope this review is valuable for readers.


