1. Introduction
In the field of pavement engineering, one crucial aspect that affects the grade of pavement performance is the occurrence of distresses or diseases in asphalt pavements over time [
1]. These distresses can manifest in various forms, such as cracks, potholes, rutting, and surface deterioration [
2]. The pavement management system (PMS) encompasses a comprehensive range of interconnected activities, including road planning, design, construction, maintenance, evaluation, and research [
3]. Its primary objective is to optimize the utilization of various resources such as capital, labor, machinery, materials, and energy [
4]. Within the PMS framework, the maintenance management system plays a crucial role. It aims to maximize available resources to maintain optimal pavement performance throughout the entire life cycle [
5]. Evaluating the service performance of pavements at different stages of their life cycle is essential to proactively address necessary repairs before they reach critical failure conditions [
6]. By implementing maintenance management systems, it becomes possible to reduce maintenance and repair costs while ensuring the safety of transportation networks [
7]. The assessment of pavement performance is a key component of maintenance management and directly impacts the quality of highway service [
8]. Therefore, accurately evaluating the grade of pavement performance is of paramount importance.
To enhance the objectivity and persuasiveness of the evaluation process, numerous quantitative analysis studies have been conducted to assess pavement performance. Majidifard et al. [
9] employed novel machine learning techniques to predict rut depth, thereby enhancing the accuracy of rut curves. Fan and Dai [
10] devised a comprehensive pavement performance evaluation method that considers five performance indexes. Olowosulu et al. [
11] utilized a fuzzy evaluation method, presenting a novel framework for accurate assessment and analysis of flexible pavement performance. Li et al. [
12] proposed an enhanced entropy weight analytic hierarchy process for evaluating pavement maintenance. In recent years, evaluation models have expanded to machine learning models, including the BP neural network [
13], NARX neural network [
14], and TOPSIS theory [
15]. These models employ single or comprehensive evaluation indexes to gain insights into the actual pavement condition, thereby providing a scientific foundation for maintenance decision-making schemes and designs [
16,
17]. However, current research on pavement performance evaluation primarily focuses on single evaluation indexes, with limited consideration given to the weight of individual evaluation indexes, comprehensive evaluation methods, and reliability analysis of comprehensive evaluation indexes.
With the rapid expansion of highway transportation demand in China, there has been significant construction of highway infrastructure, leading to increased research on pavement performance evaluation methods [
18]. The Pavement Quality Index (PQI) is a comprehensive indicator that encompasses sub-indexes such as the Pavement Condition Index (PCI), Riding Quality Index (RQI), Rutting Depth Index (RDI), and Skidding Resistance Index (SRI) [
19]. These sub-indexes are weighted to derive the comprehensive evaluation index, which provides an overall assessment of pavement condition [
20]. In engineering applications, the evaluation of pavement performance often relies on the average value and discrete grade of the performance indexes [
21]. The average value approach calculates the mean of the observed data along the entire road section, while the discrete grade approach involves statistical analysis to determine the proportions of excellent, good, fair, poor, and very poor road conditions based on unit pavement performance evaluation results [
22]. However, the evaluation method based on the average value tends to compress the information contained in the data, potentially leading to the neglect of important details. Predictions based solely on the average value may result in symmetric dispersion around the average index value, which can misrepresent the actual pavement condition [
23]. Moreover, the process of converting continuous unit-kilometer metrics to discrete pavement levels can mask detailed information about pavement performance, further contributing to evaluation inaccuracies [
24]. To address these limitations, it is important to consider more advanced evaluation methods that capture the variability and nuances of pavement performance [
25]. This may involve incorporating additional factors, such as the weight of individual evaluation indexes, the use conditions of each measuring point, and the reliability analysis of the comprehensive evaluation index [
26]. Utilizing more sophisticated techniques can improve the objectivity and accuracy of pavement performance evaluation, providing a solid foundation for maintenance decision-making and design.
In this study, the probability function of each evaluation index parameter is established to gain insights into the probability distribution characteristics of pavement performance evaluation metrics. Fitting tests are conducted to analyze various influencing factors. By utilizing probability distribution methods, it becomes possible to analyze potential indicators per kilometer without losing information due to averaging and discretization of evaluation results [
27]. This approach ensures the maximum retention and utilization of all indicator data at the unit kilometer level. However, it is important to note that due to the different distribution forms of variables, a unified equation form cannot be adopted when dealing with each index. Each evaluation index may follow a distinct probability distribution, and therefore, specific distribution functions need to be employed for accurate analysis. Furthermore, pavement performance evaluation often involves uncertain information, including randomness, fuzziness, gray areas, and unascertained factors [
28]. Incorporating statistical techniques to handle uncertainty becomes crucial in accurately assessing pavement performance and making informed decisions. By considering the probability distribution characteristics and addressing uncertainties, this study aims to enhance the understanding of pavement performance evaluation and provide a more comprehensive and reliable assessment of the condition of highway pavements.
Therefore, this study presents the concept of blind-number theory and its application in evaluating the performance of pavement surfaces. A reliability framework for the pavement evaluation indicator using blind numbers is proposed. This framework integrates obscured data into the evaluation system, ensuring that it remains unaffected by probability distribution functions. By clearly defining the evaluation grade and its corresponding confidence, the rigor of the evaluation process is enhanced.
3. Analysis of Examples
3.1. Statistical Result Analysis
To fulfill the requirements of probability function analysis and fitting tests for pavement performance evaluation metrics, an operational program was developed for analysis and calculation. The statistical results are shown in
Table 4. The probability density and fitting analysis results of PCI, RQI, RDI, SRI, and other indicators are presented in
Figure 1. The analysis of the results indicated that when comparing PCI, RQI, RDI, and SRI using the Kolmogorov–Smirnov and Anderson–Darling test methods, the Log-Logistic (3P) distribution provided the most suitable fitting results. When using the Chi-Squared method for comparison, the Log-Logistic (3P) distribution yielded the best fitting results for RQI and RDI. The PCI achieved the best result through Logistic fitting method, followed by Log-Logistic (3P) fitting. However, the SRI obtained the best result through Log-Logistic fitting. By comprehensively comparing the calculation results from all three methods, it can be concluded that the probability density distributions of PCI, RQI, RDI, and SRI can be effectively characterized by the Log-Logistic (3P) distribution.
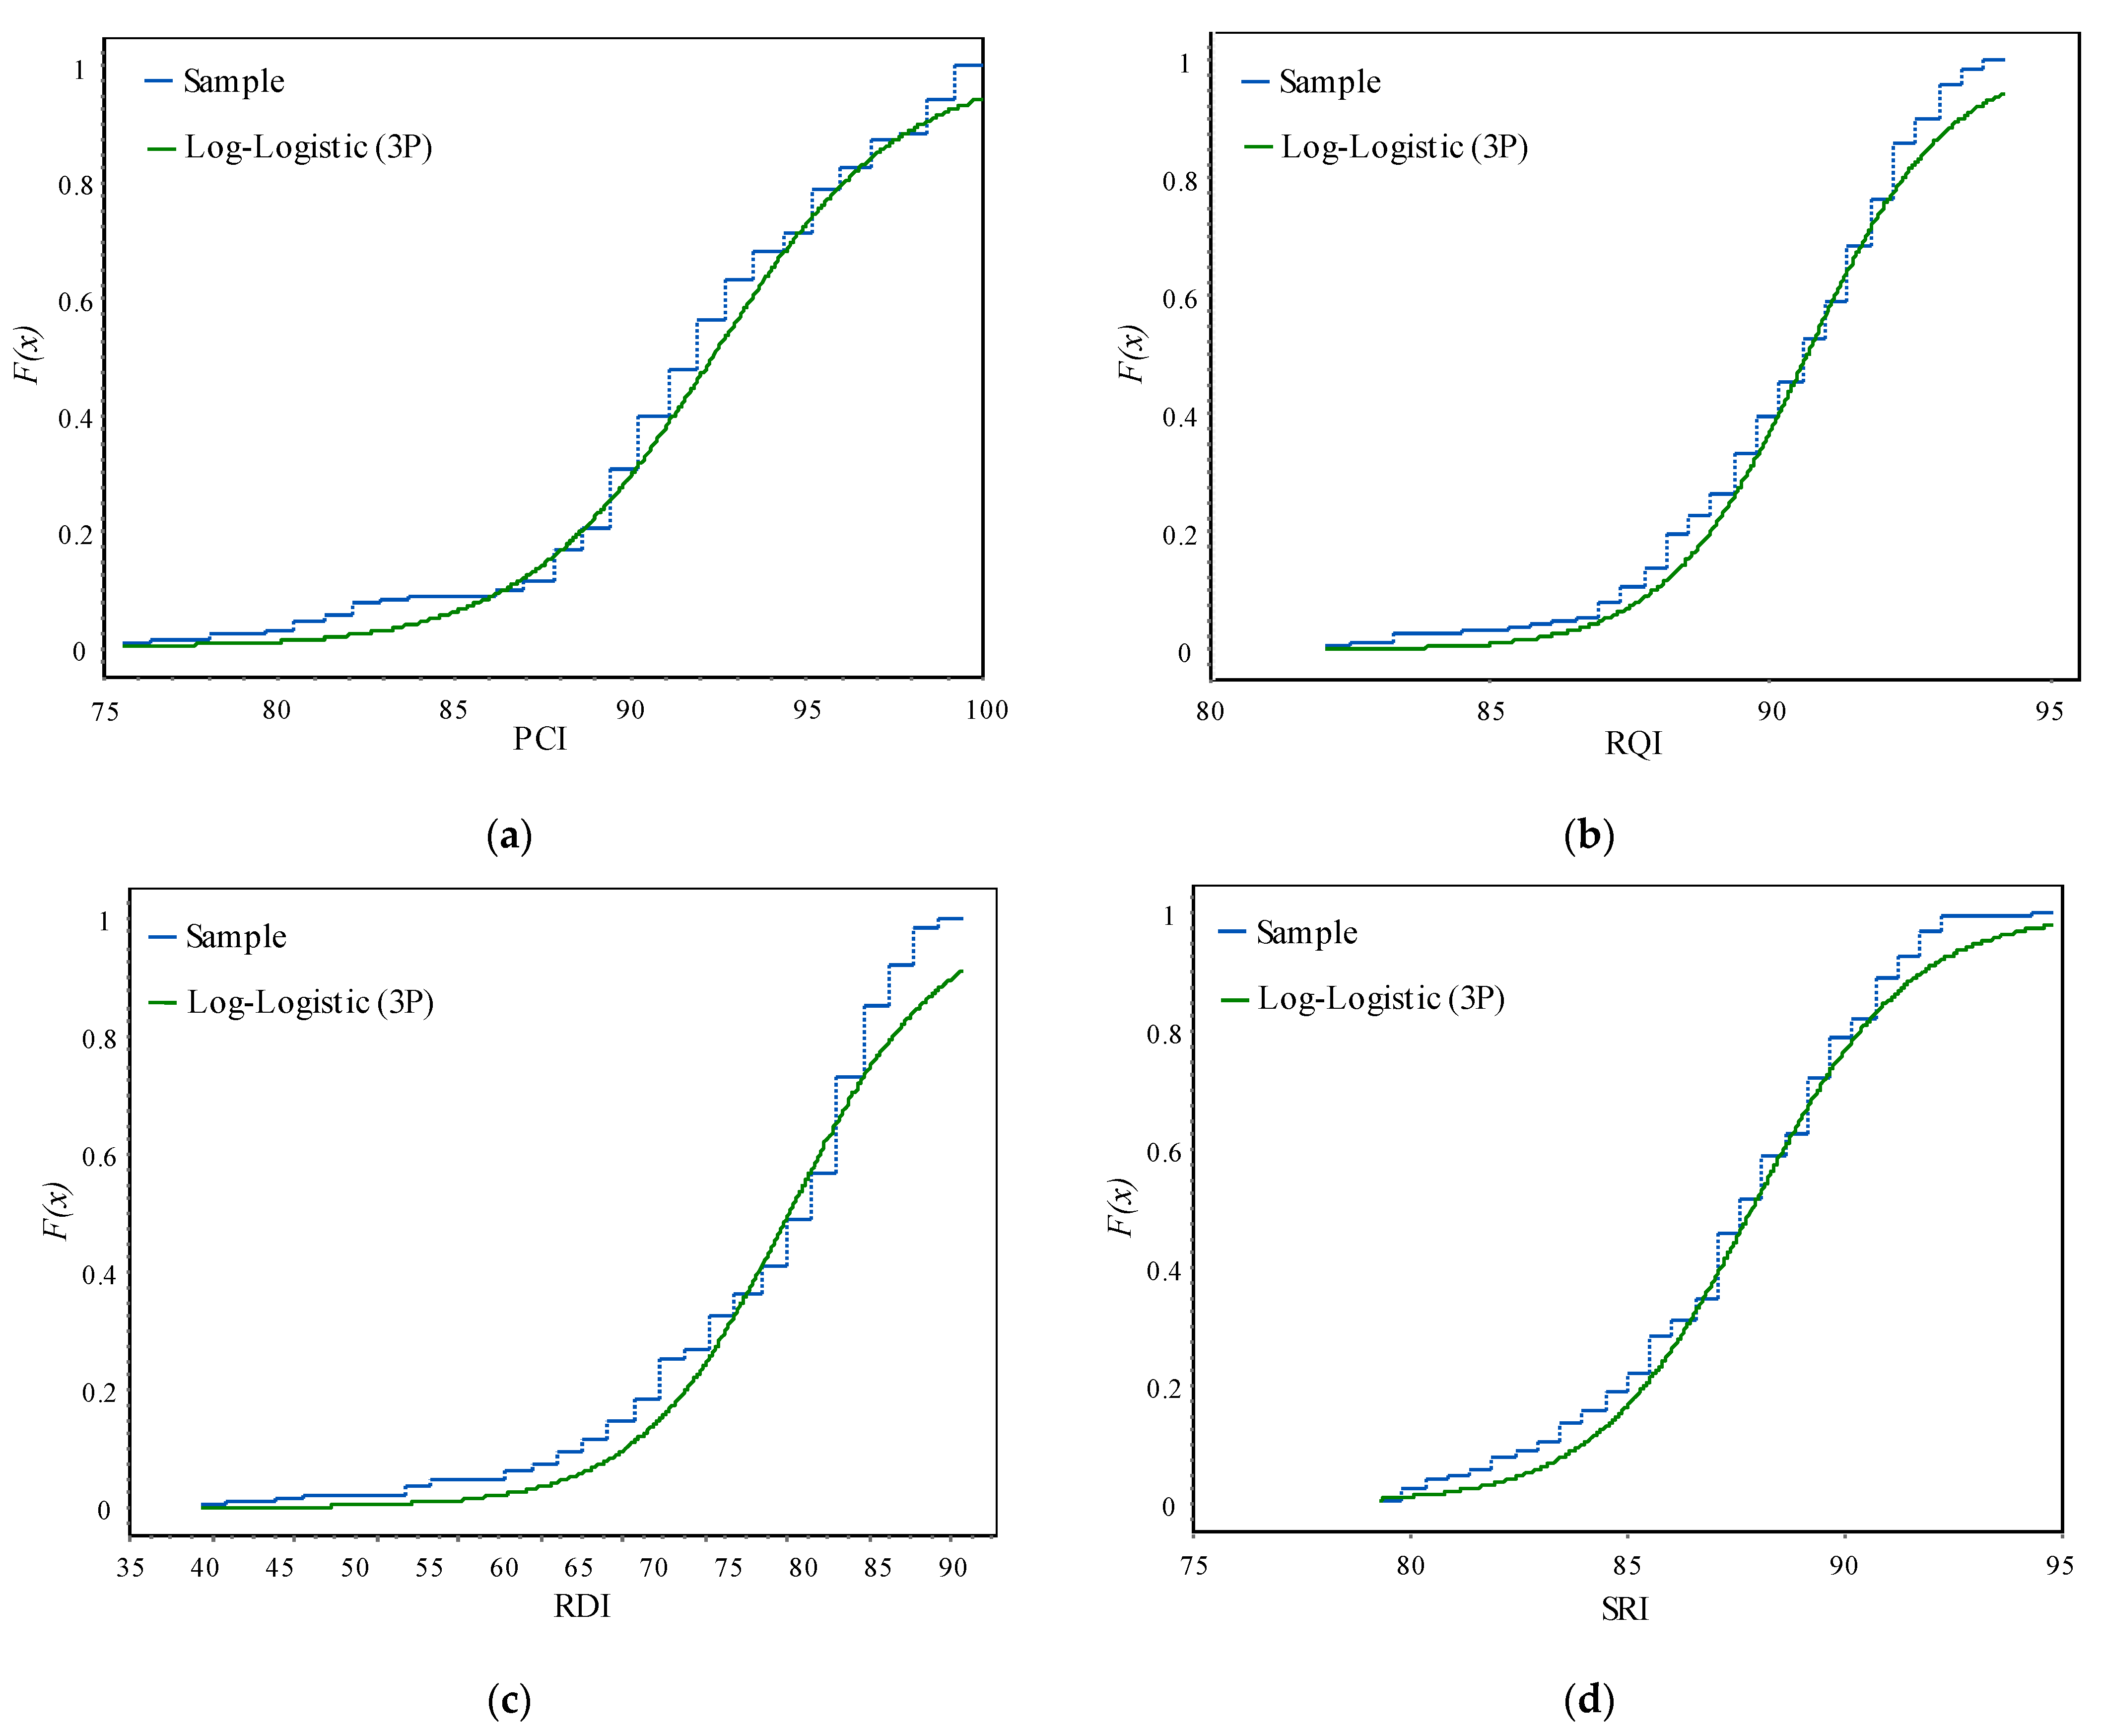
The cumulative probability density functions of PCI, RQI, RDI, and SRI, as well as the comparison between measured values and fitting values, are presented in
Figure 2 and
Figure 3. In the case of the PCI, the Log-Logistic (3P) fitting is not effective in the range of [80, 85], meaning that the fitted function does not accurately represent the distribution of the index within this range. However, the fitting becomes stable and reliable in the range of [85, 100], indicating that the fitted function accurately represents the distribution of the PCI within this range. For the RQI, the Log-Logistic (3P) fitting is not effective in the ranges of [82, 87] and [93, 94], suggesting that the fitted function does not accurately represent the distribution of the index within these ranges. However, the fitting becomes stable and reliable in the range of [87, 93], indicating that the fitted function accurately represents the distribution of the RQI within this range. The overall trend of the RDI obtained through Log-Logistic (3P) fitting to the cumulative probability density function is evident. This suggests that the fitted function accurately represents the distribution of the RDI across its entire range. Similarly, the cumulative probability density function of the SRI obtained through Log-Logistic (3P) fitting shows an ideal effect within the range of [84, 92] and is stable and reliable. This indicates that the fitted function accurately represents the distribution of the SRI within this range.
The measured and fitted values of pavement performance indicators are compared using Log-Logistic (3P) fitting. In the range of the PCI [0, 0.6], the fitting results fluctuate significantly, and the fitting effect is poor. In the range of [0.6, 0.9], the fitting results fluctuate slightly and are distributed on both sides of the line, indicating relative reliability and stability. For the RQI, in the range of [0, 0.2] and [0.5, 1], the fitting results fluctuate greatly, and the fitting effect is poor. However, in the range of [0.2, 0.5], the fitting results fluctuate slightly and are distributed on both sides of the straight line, indicating stability and reliability. The fitting values obtained for the RDI fluctuate around the actual values, with local fluctuations being significant. In the range of the SRI [0.4, 0.9], the fitting values exhibit a high correlation with the measured values, indicating a better effect.
Indeed, studying the probability distribution characteristics of asphalt pavement performance evaluation indexes is an important research endeavor. The analysis conducted above indicates that the PCI, RQI, RDI, and SRIes do not follow a normal distribution entirely, and the probability distribution of pavement performance evaluation indexes varies. The gradual decay of pavement performance over time is influenced by various factors such as climate, geology, traffic load, material properties, and structural geometry parameters. Consequently, the probability distribution of pavement performance evaluation indexes will also change throughout different stages of the pavement’s life cycle. The current deterministic evaluation method, which employs fixed weights, is insufficient to meet the practical requirements of the project. To ensure accurate and reliable pavement performance evaluation, it is crucial to consider the probabilistic nature of these indexes and incorporate appropriate statistical models or methods for analysis.
3.2. Confidence Analysis Based on Blind-Number Theory
Taking into account the uncertainty associated with randomness, fuzziness, grayness, and uncertainty in the evaluation of pavement performance, the blind number theory is employed to establish blind number expressions for pavement performance evaluation indexes. Additionally, a confidence model is developed to analyze the confidence of pavement performance. The integration of blind information into the evaluation system ensures that it remains unaffected by probability distribution functions. This approach not only provides a clear assessment grade for pavement performance but also assigns corresponding credibility to the assessment grade, thereby enhancing the scientific nature of the evaluation. The sample data and weight coefficients used in this study are based on the research conducted by Li, Wei, Yao, Hu, and Wang [
12]. By utilizing Equations (14)–(16), blind numbers and reliabilities for the pavement performance indexes are computed, as shown in
Table 5.
The results of these calculations are presented in
Table 4. It is evident that the calculated PQI
^ results do not align with those obtained using the current standard. The PQI
^ interval determined by the current standard is [83.64, 92.94], whereas the PQI interval computed is [73.32, 91.01]. Three of the judgment values for the optimal pavement performance evaluation grade exceed 1, indicating that the confidence of judgment values greater than 1 in the sample group is 0.075. There are 36 judgment values for the good pavement performance evaluation grade that surpass 1, signifying a confidence of 0.9 or 90% for judgment values greater than 1 in the sample group. Moreover, confidence is considered as 1 for values exceeding 0.9. According to the current standard, the evaluation outcome indicates that 30 samples are classified as good, while 10 samples are deemed excellent. For instance, considering sample 14, the current standard assigns a PQI evaluation result of 83.64, corresponding to a good evaluation grade. However, when employing the information entropy weight determination calculation for PQI
^, the result is 73.32, indicating a medium evaluation grade. These evaluation results differ significantly.
Analyzing the pavement performance sample data reveals that the evaluation grade for the RDI is poor, while the PCI, RQI, and SRI receive excellent and good evaluation grades, respectively. The current standard assigns weights of 0.35 and 0.4 to the PCI and RQI, respectively, while the weight assigned to the pavement rutting depth index is relatively small [
31]. Consequently, the overall pavement evaluation result becomes overly optimistic. In contrast, Li, Wei, Yao, Hu, and Wang [
12] adopt the information entropy weight determination method, which considers the difference in evaluation indexes and reflects the contribution rate of these indexes to the system. This approach leads to an improved weight for the road rutting depth index. By comparing the scores provided by different experts, it is observed that the weight determination using information entropy weight aligns more closely with the actual road condition level.
Through the proposed confidence model for pavement performance analysis, not only is the evaluation level of pavement performance clearly defined, but the corresponding confidence for each evaluation level is also provided. Moreover, it significantly expands the application scope of pavement performance confidence analysis.
4. Conclusions and Outlook
This study has examined the probability distribution characteristics of the evaluation index for asphalt pavement performance and introduced the concept of blind-number theory to investigate the confidence model for analyzing the confidence of asphalt pavement performance. The key findings are as follows:
- (1)
The Pavement Condition Index (PCI), Riding Quality Index (RQI), Rutting Depth Index (RDI), and Skidding Resistance Index (SRI) of pavement facilities do not exhibit complete adherence to the normal distribution. Furthermore, the probability distribution of the pavement performance evaluation index differs.
- (2)
A blind-number expression for the pavement performance evaluation index is developed in this study. Additionally, a confidence model for analyzing the confidence of pavement performance is constructed using the method of determining the weight information entropy weight of the pavement performance evaluation index. The model effectively integrates blind information into the pavement performance evaluation system, making it independent of the probability distribution function.
- (3)
Compared to the traditional method, the proposed confidence model for pavement performance confidence analysis has several advantages. Firstly, it provides a clear evaluation level for pavement performance, allowing for a more precise assessment. Secondly, it also assigns corresponding credibility to the evaluation level, which enhances the scientific and rational nature of the evaluation process. This improvement ensures that the evaluation takes into account the confidence of the data and the assessment results.
Overall, the confidence model significantly enhances the scientific rigor and advanced nature of pavement performance evaluation, thereby expanding the application scope of pavement performance confidence analysis and enabling more accurate and reliable assessments across a wide range of scenarios. In future research, it is highly recommended to expand the sample size to enhance the richness and representativeness of the data. By incorporating a larger number of samples, the confidence model can comprehensively reflect the performance of pavements under diverse road sections and conditions, thereby enhancing its accuracy and reliability. While this study covers several critical pavement performance evaluation indexes, future investigations should consider incorporating additional relevant indexes, such as traffic flow and climate conditions, which also exert significant influence on pavement performance. The careful consideration of these additional factors can further enhance the applicability and prediction capability of the confidence model.
Moreover, future work should focus on expanding and refining the credibility model of pavement performance based on blind number theory, thereby increasing its applicability to road projects in different regions and under varying conditions. This will provide road maintenance activities with more scientific and reliable decision support. By continuously advancing the credibility model, road engineers can make well-informed decisions regarding maintenance strategies, ensuring the long-term functionality and safety of transportation networks in diverse geographical locations and environmental conditions.


 ” denote the four arithmetic operations applied to the blind numbers. A^ and B^ can be any element within the matrix of possible values, expressed as A⊗B, where i = 1, 2 … k and j = 1, 2 … m. To illustrate the blind number operation using addition, this study considers x1, x2, …, xk and y1, y2, …, yn as lists of real numbers in descending order, referred to as the sequence of possible values for A^ and B^. The vertical side of a matrix is denoted by x1, x2, …, xk, while the horizontal edge is represented by y1, y2, …, ym. The bounded matrix is perpendicular horizontal and vertical axes, and the possible values of A^ and B^ are associated with the edges and matrices, as depicted in Table 2.


