
Assessment of Extreme Wave Impact on Coastal Decks with Different Geometries via the Arbitrary Lagrangian-Eulerian Method


Abstract
:1. Introduction
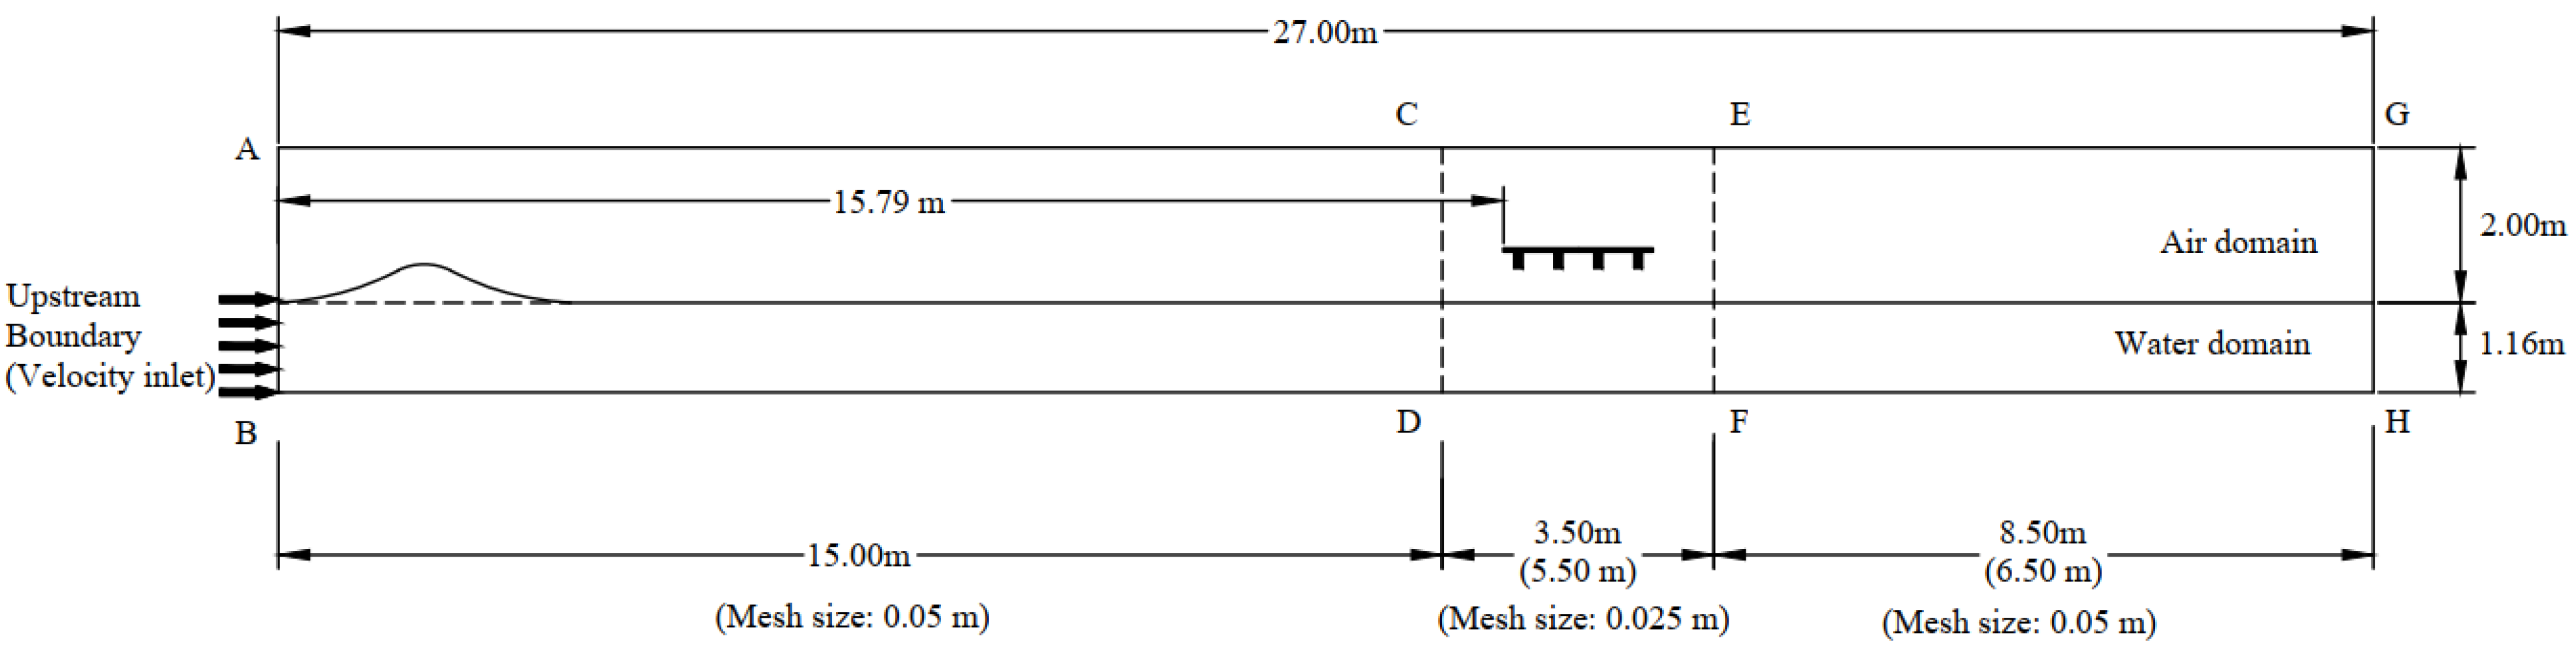
2. Numerical Modeling
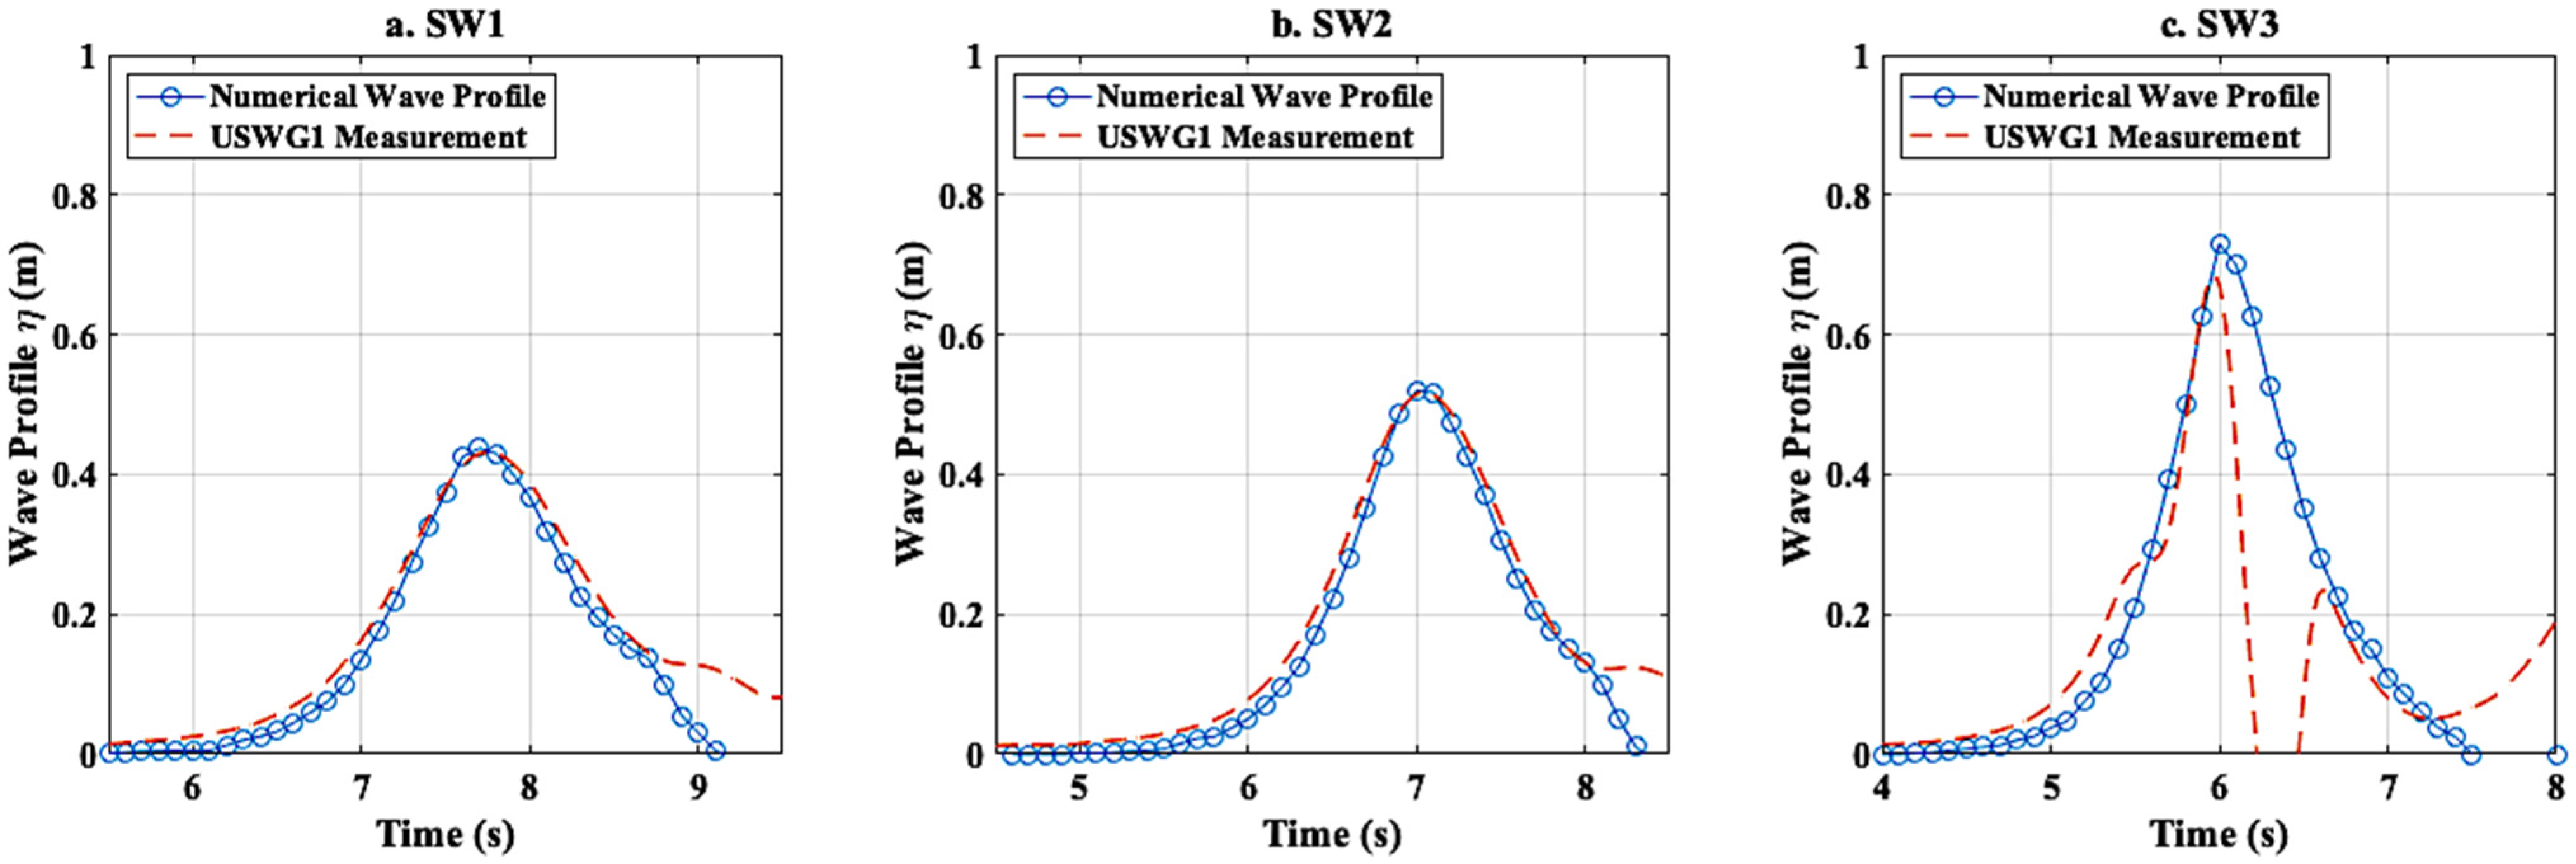
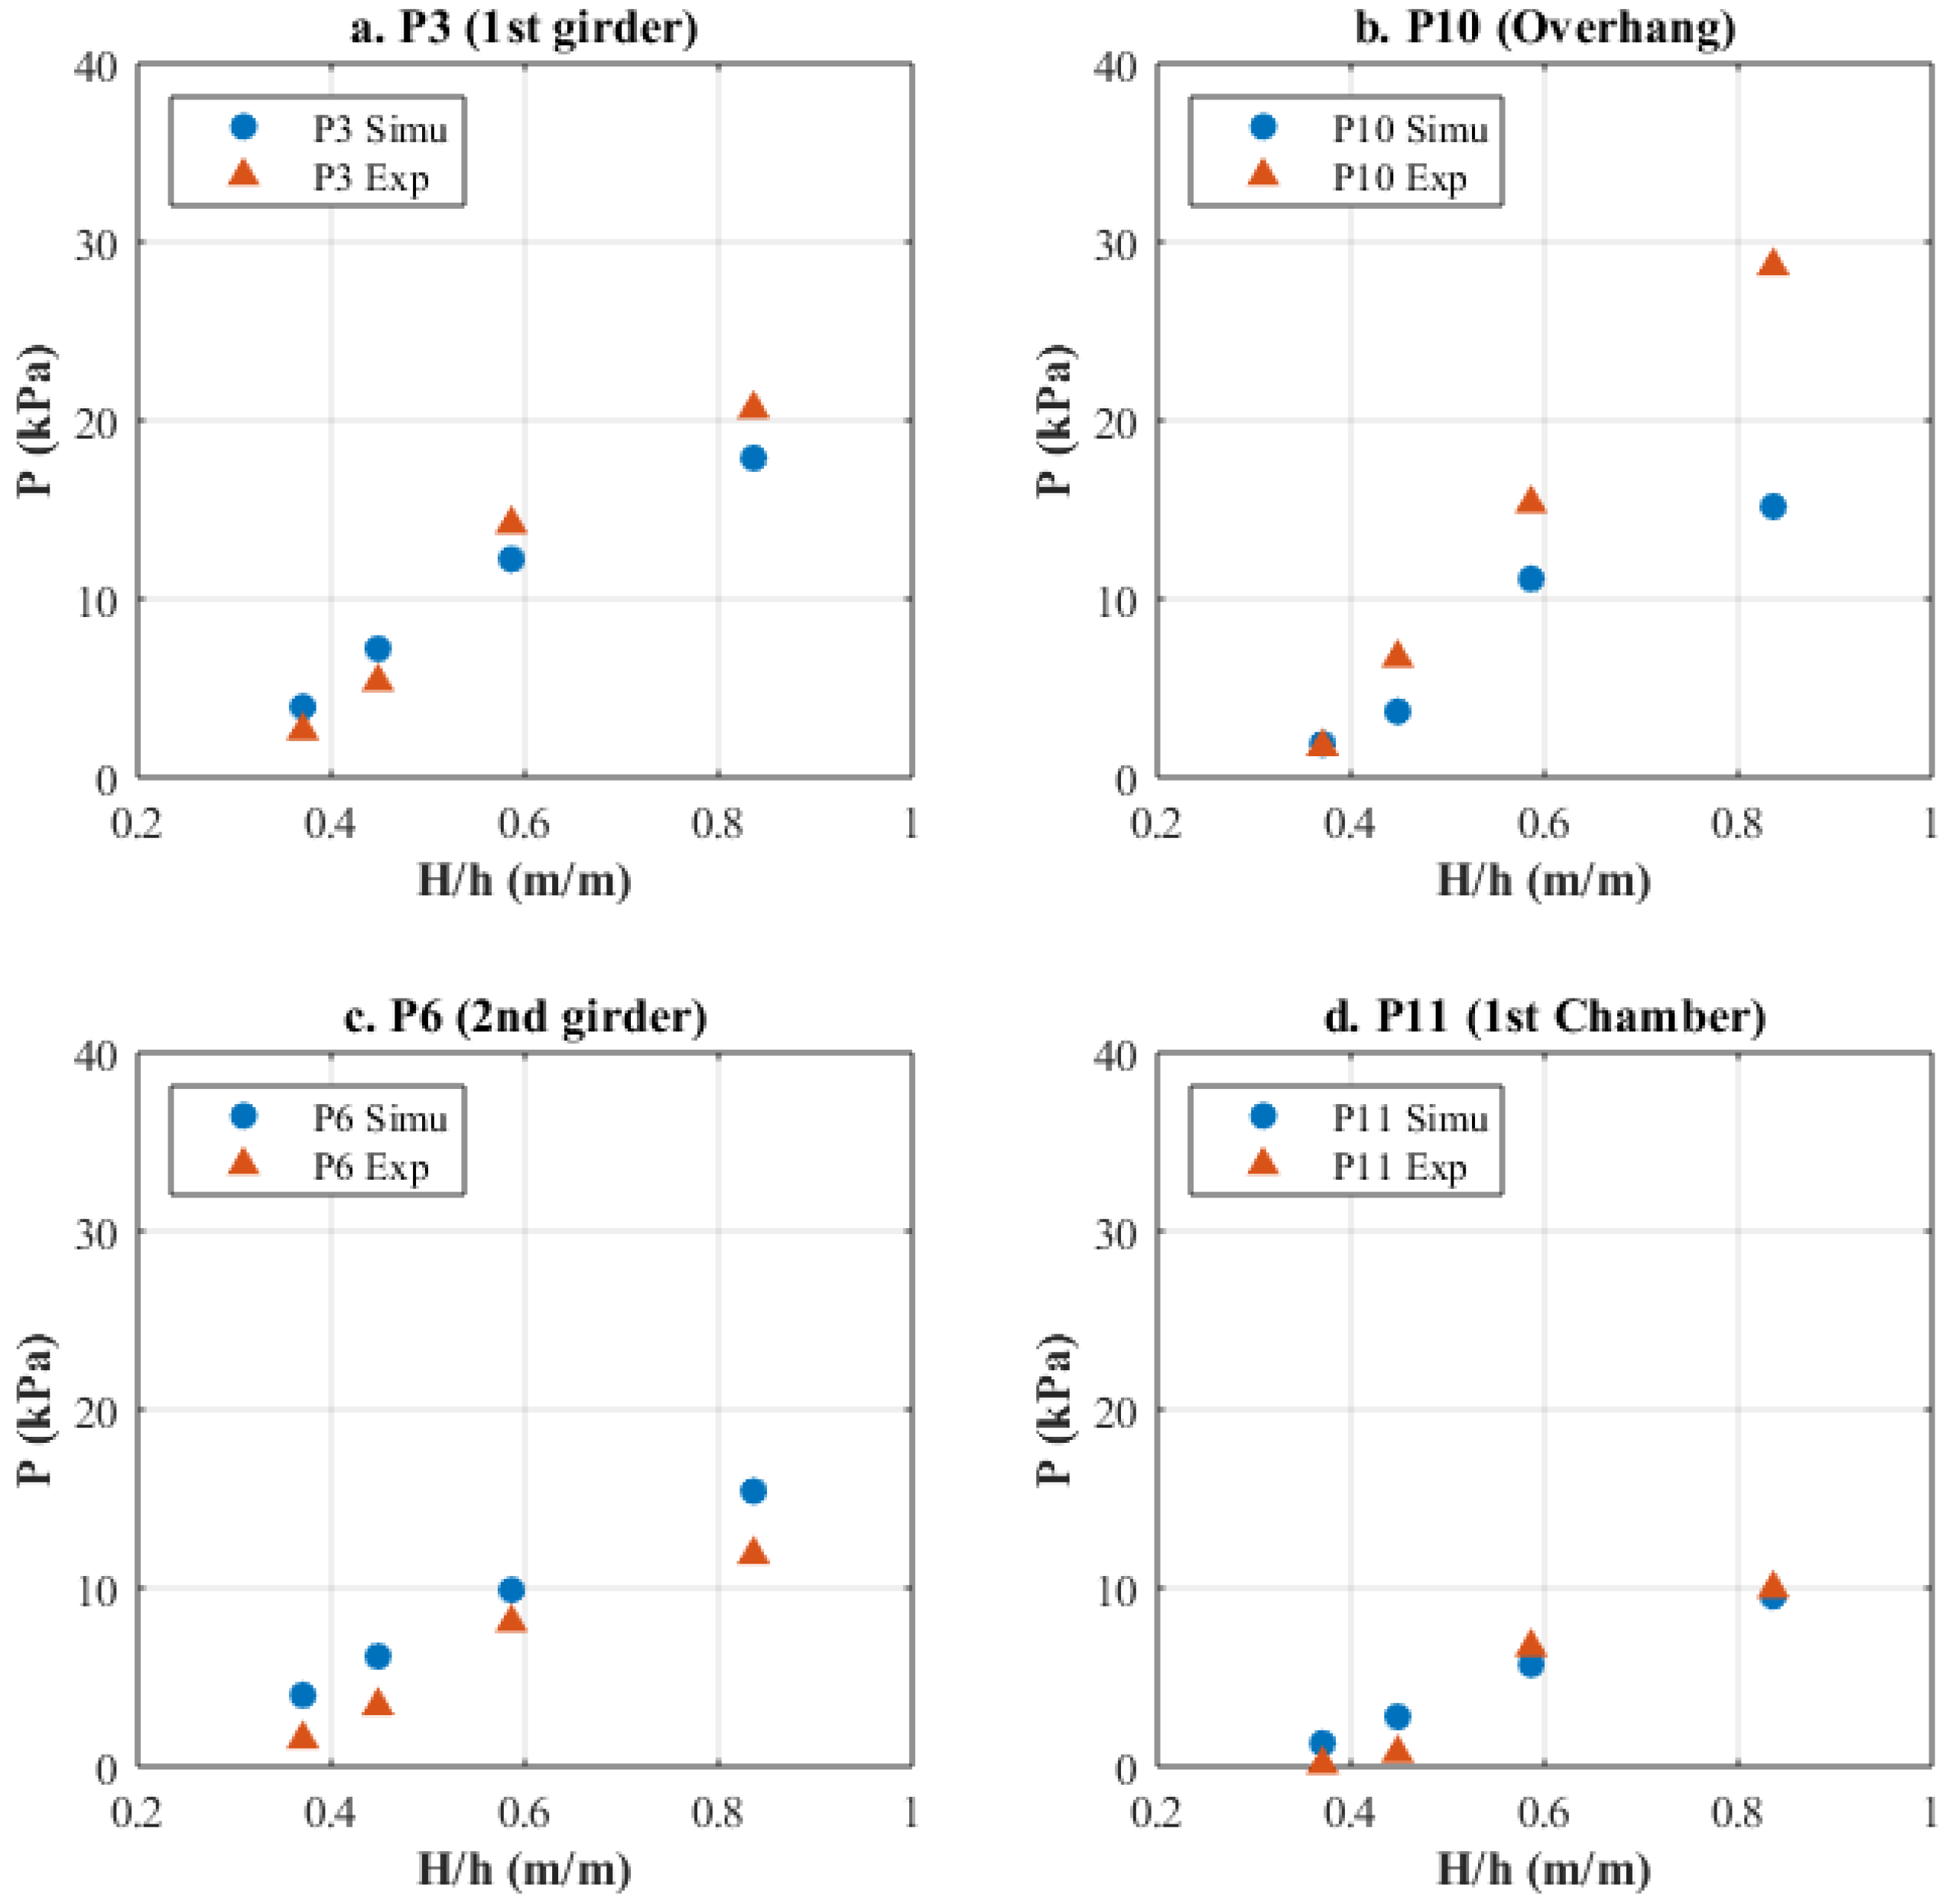
2.1. Governing Equations and Validation
3. Effect of Number of Girders
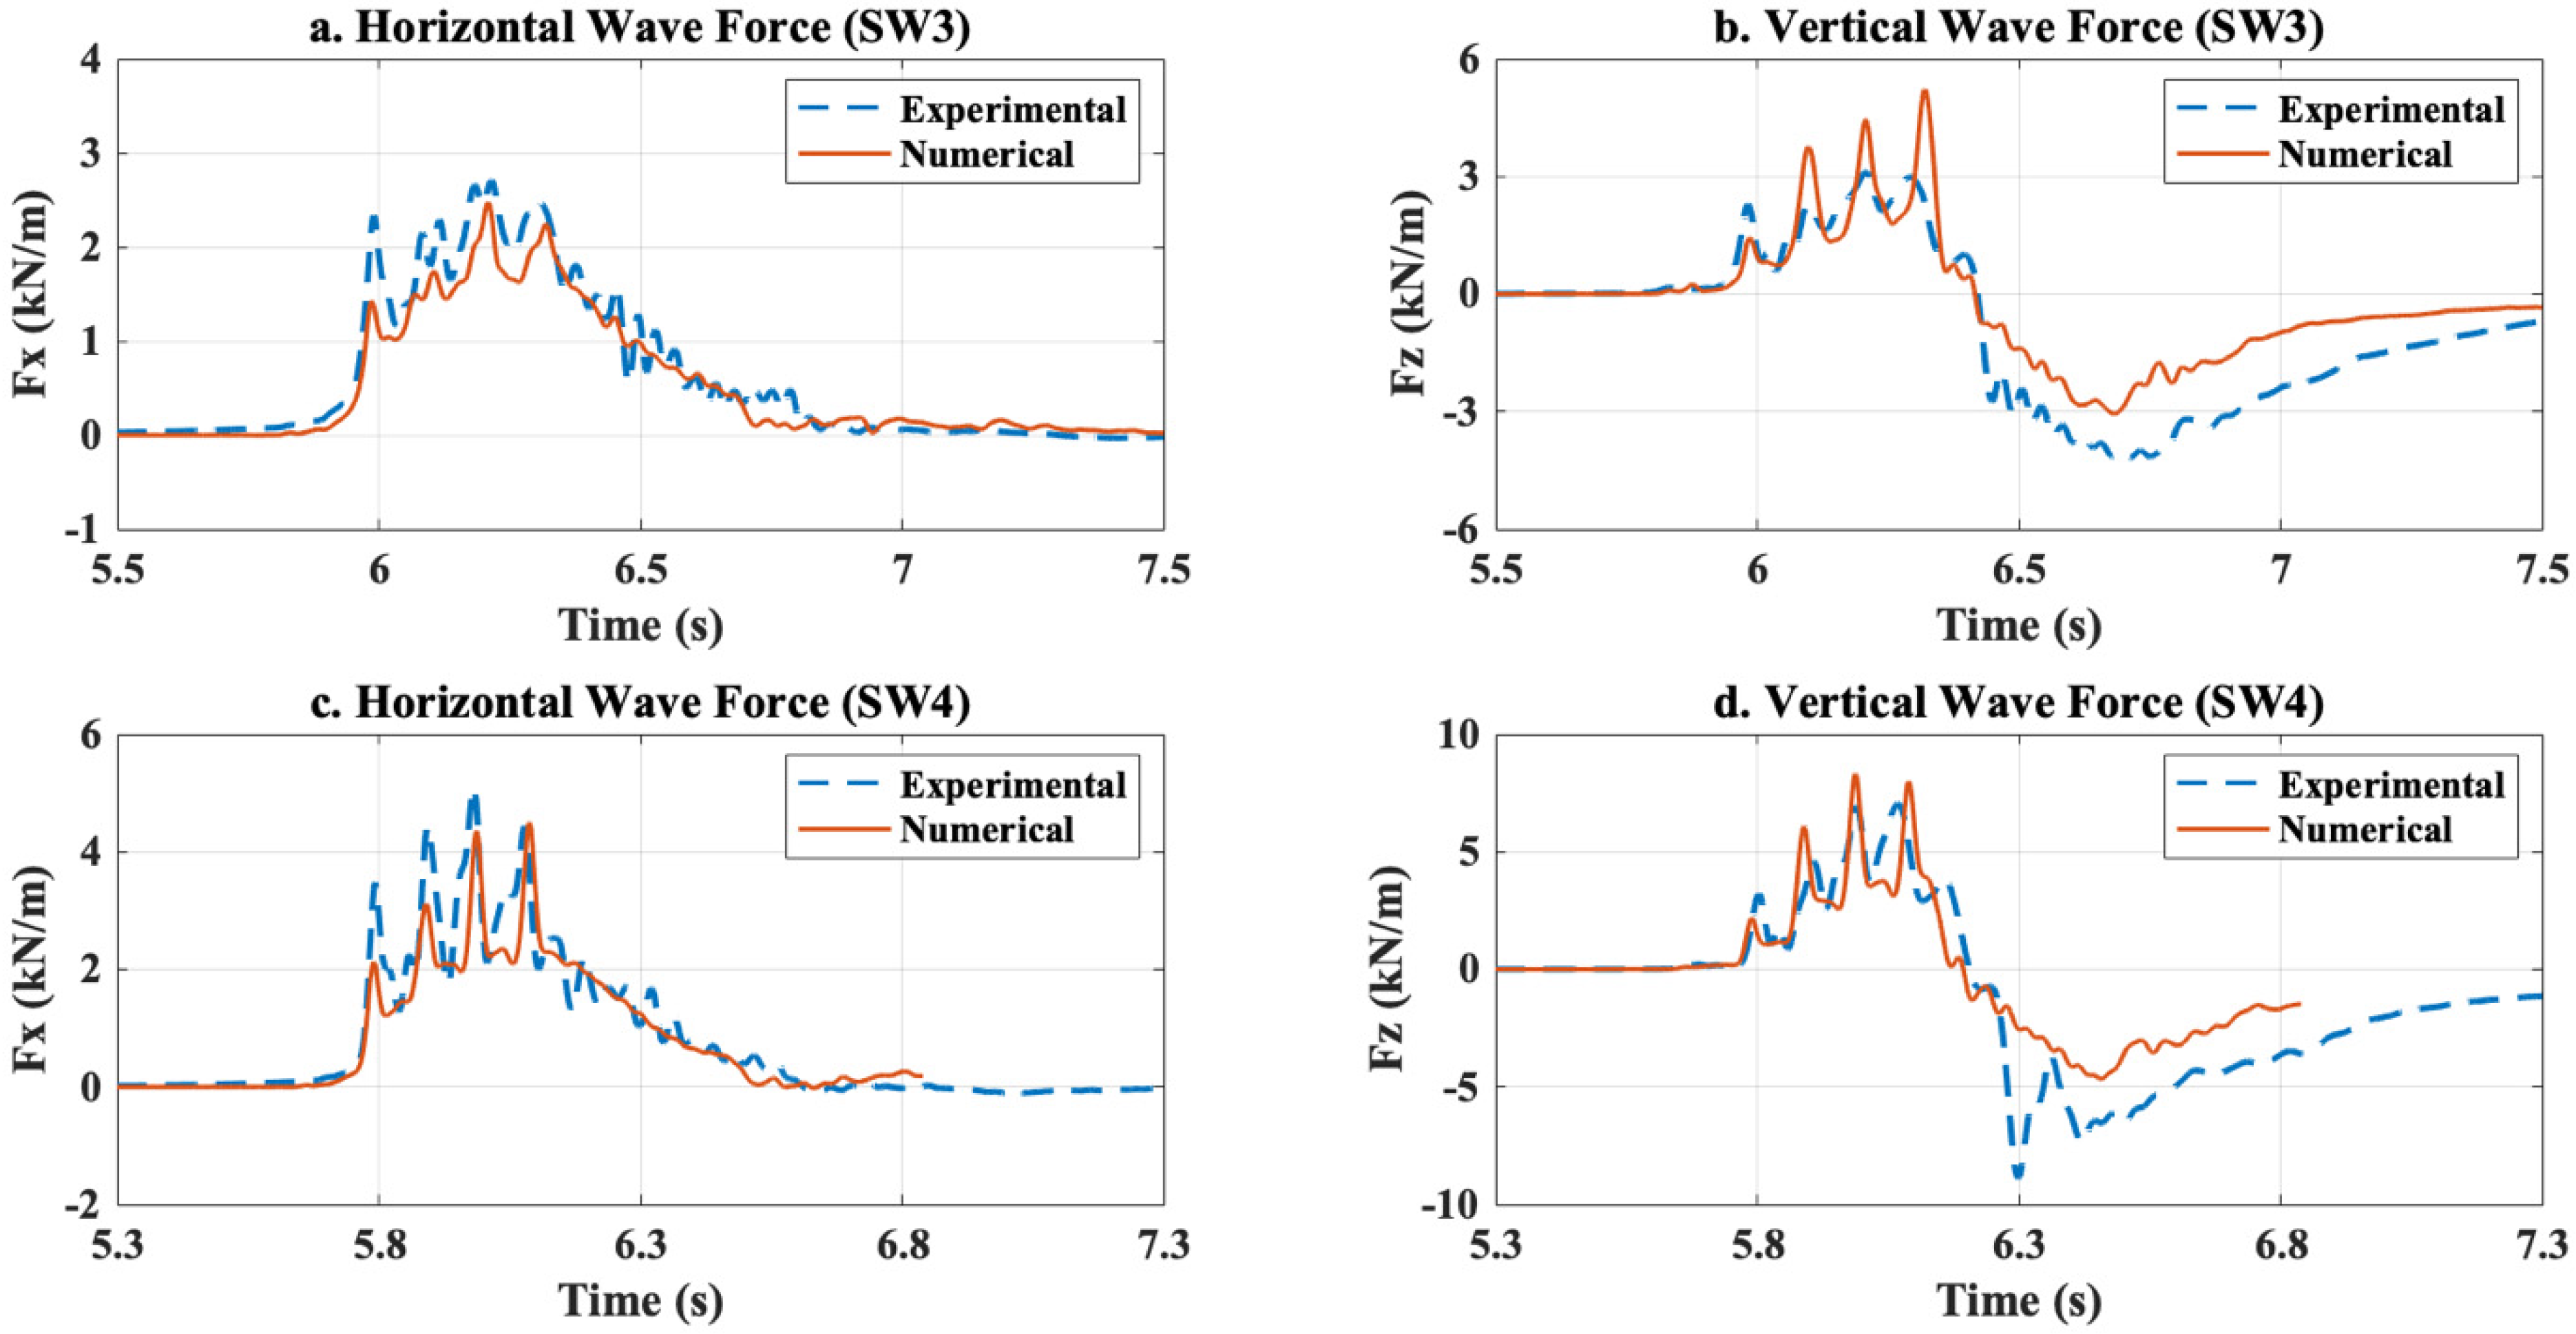
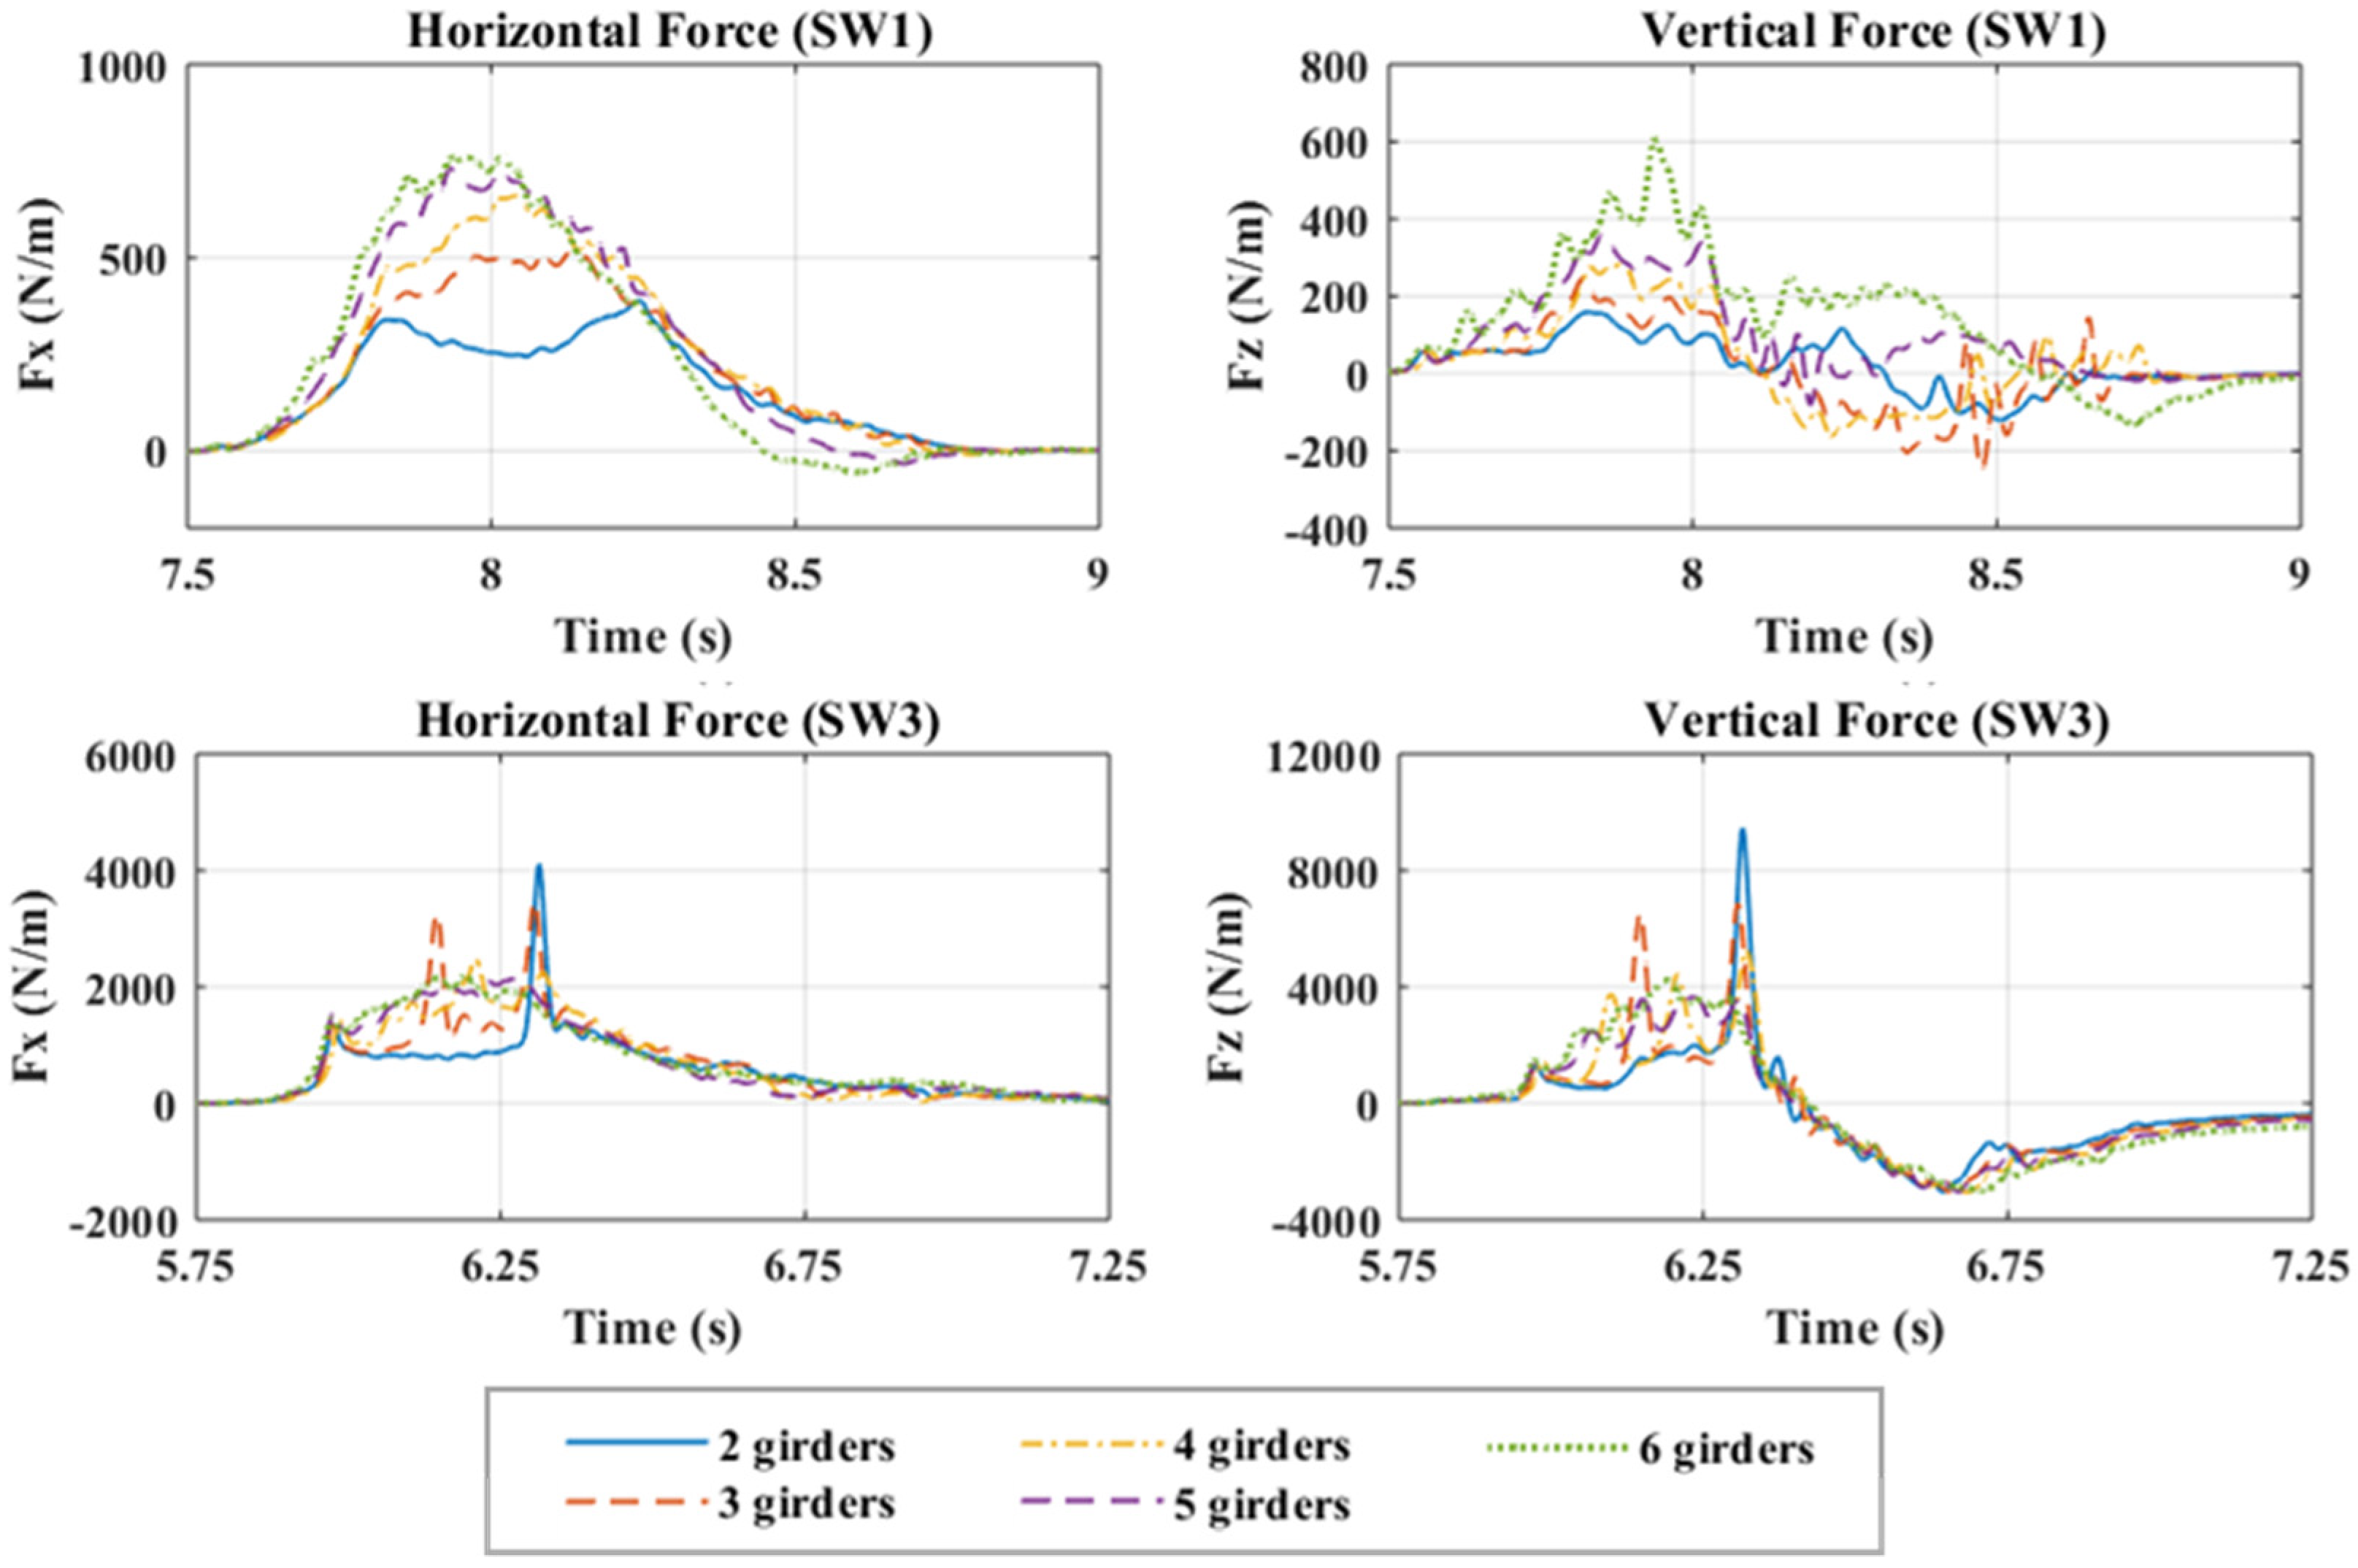
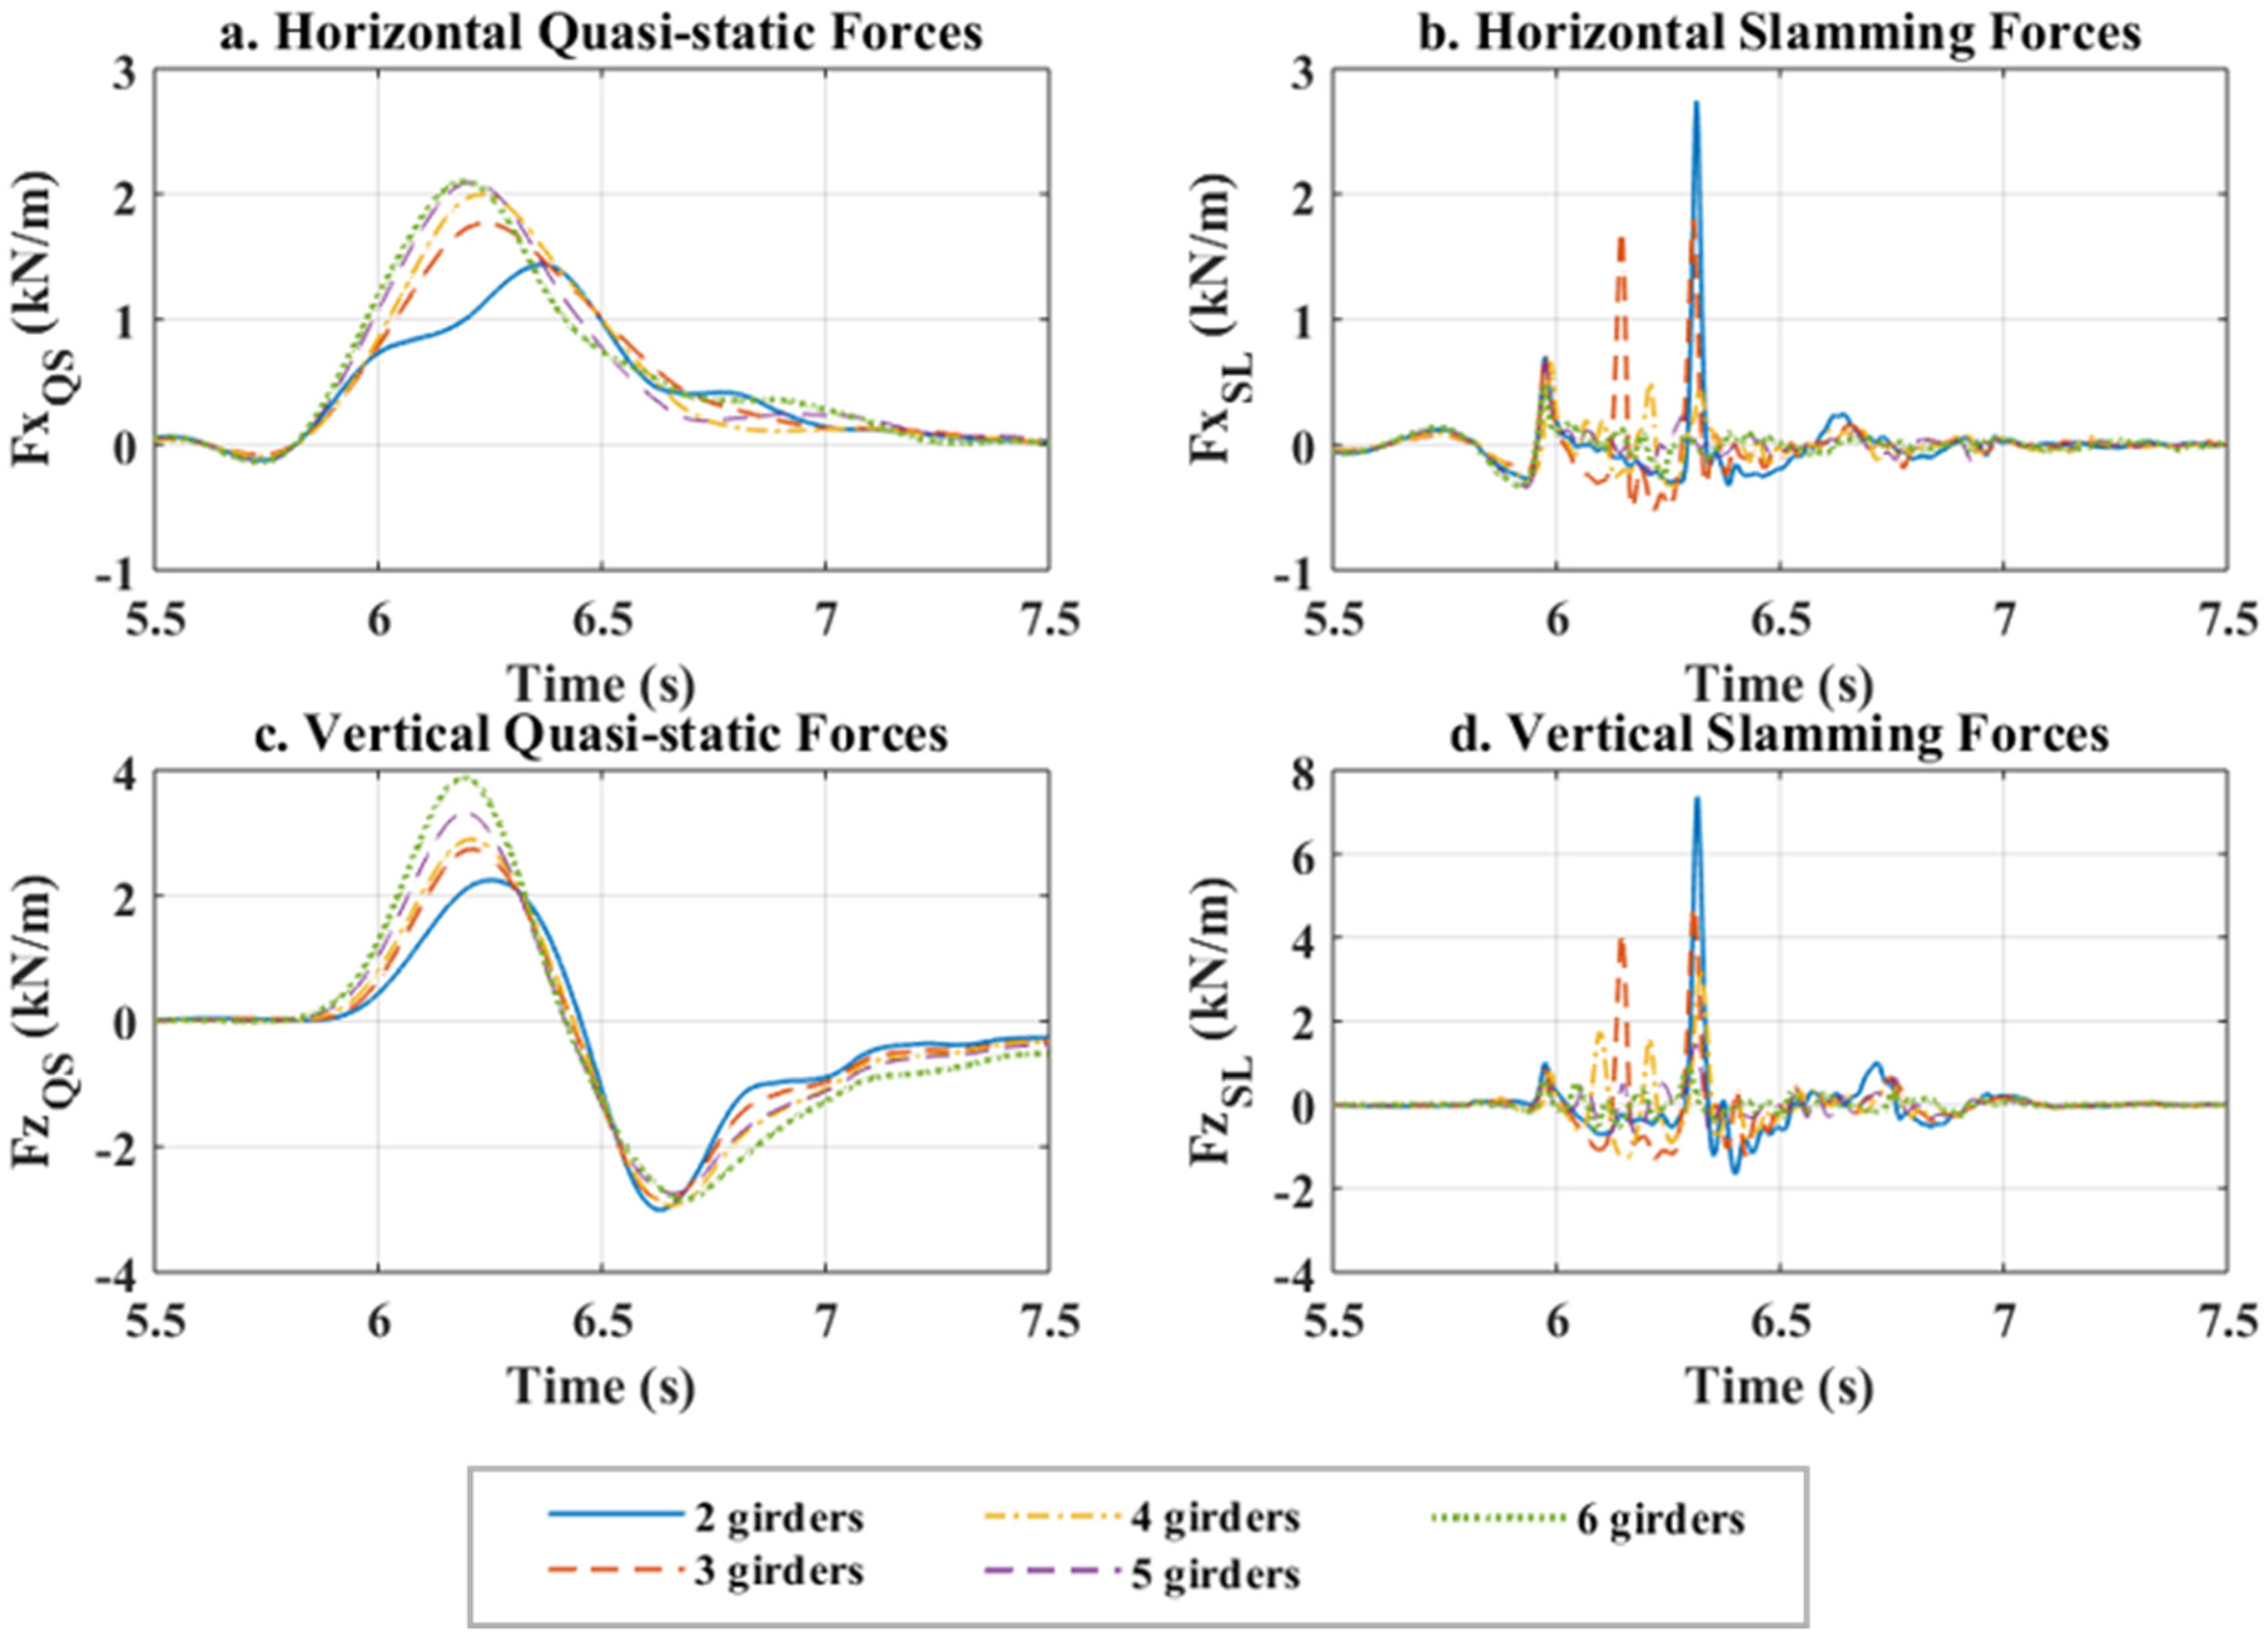
3.1. Horizontal and Vertical Forces
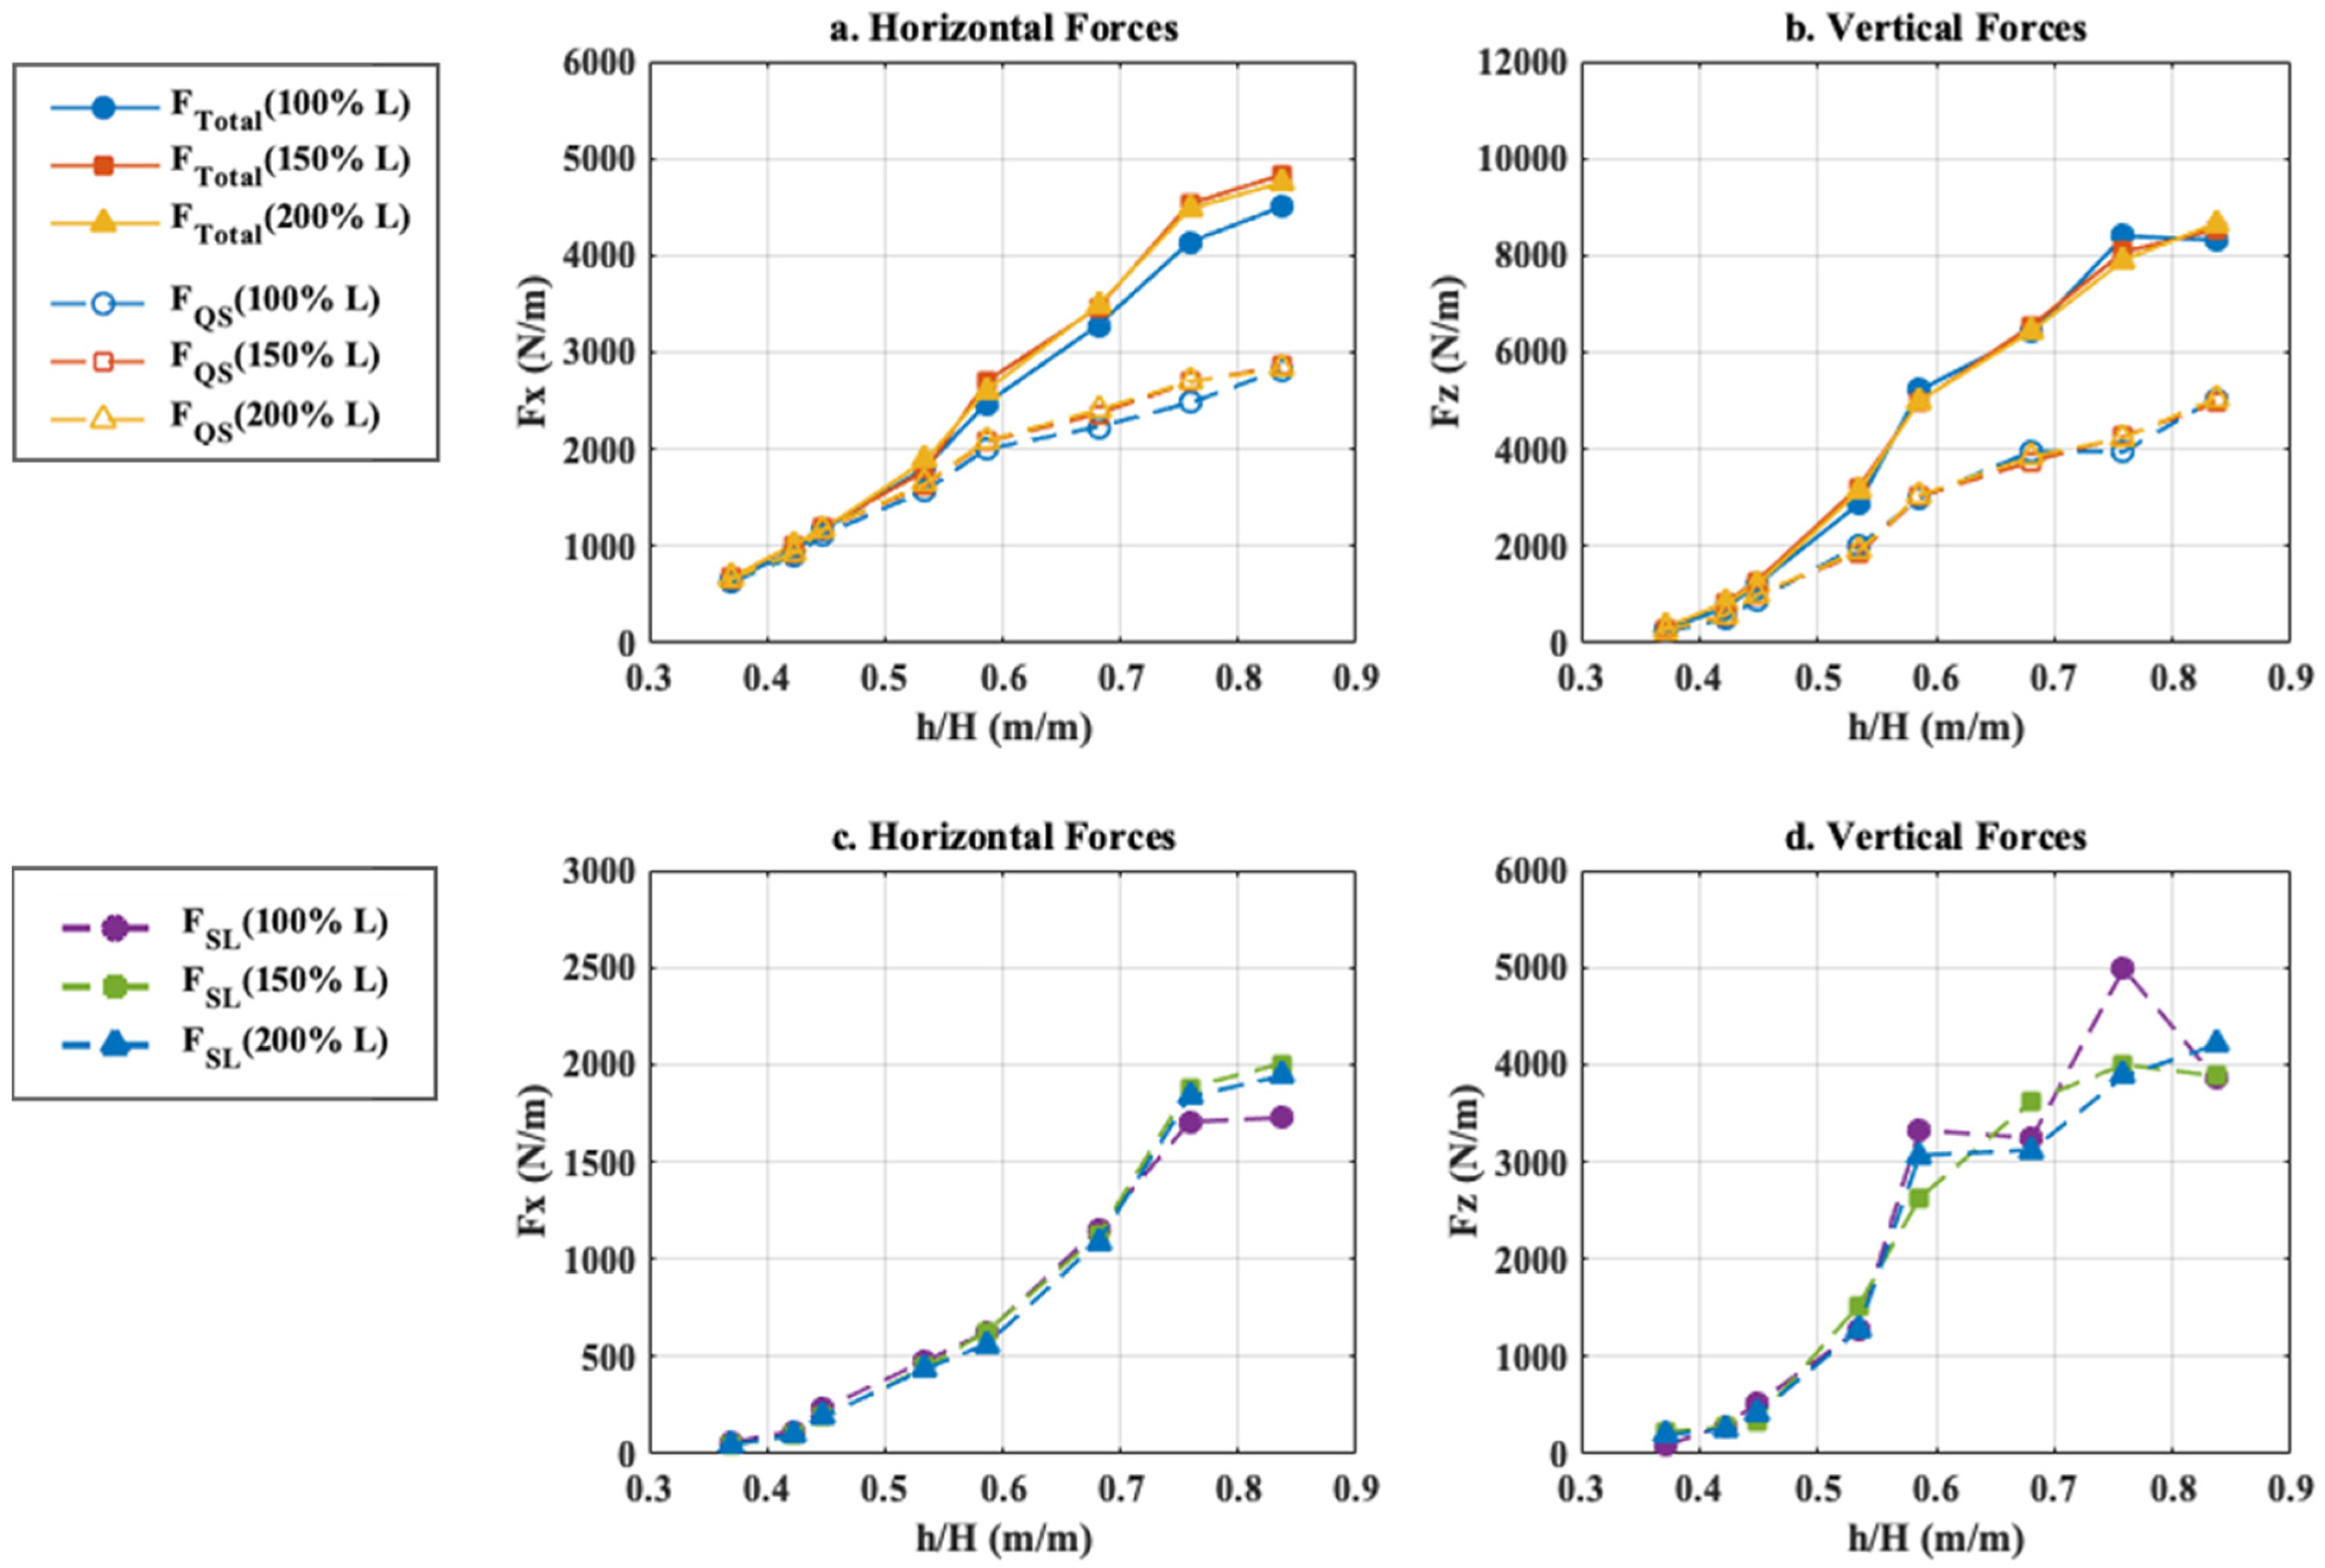
- For large wave heights the magnitudes of the slamming components are twice as large as the quasi-static components for the two-girder case, meaning that they will have a governing effect on the total forces. However, for the decks with the largest Ng (e.g., 5, 6) the quasi-static components are larger than the slamming ones (due to the simultaneous reduction of and the increase of , as Ng increases)
- For small wave heights the quasi-static component has a governing role over the total forces, irrespective of the number of girders.
5. New Predictive Equations for Wave Loads
5.1. Motivation
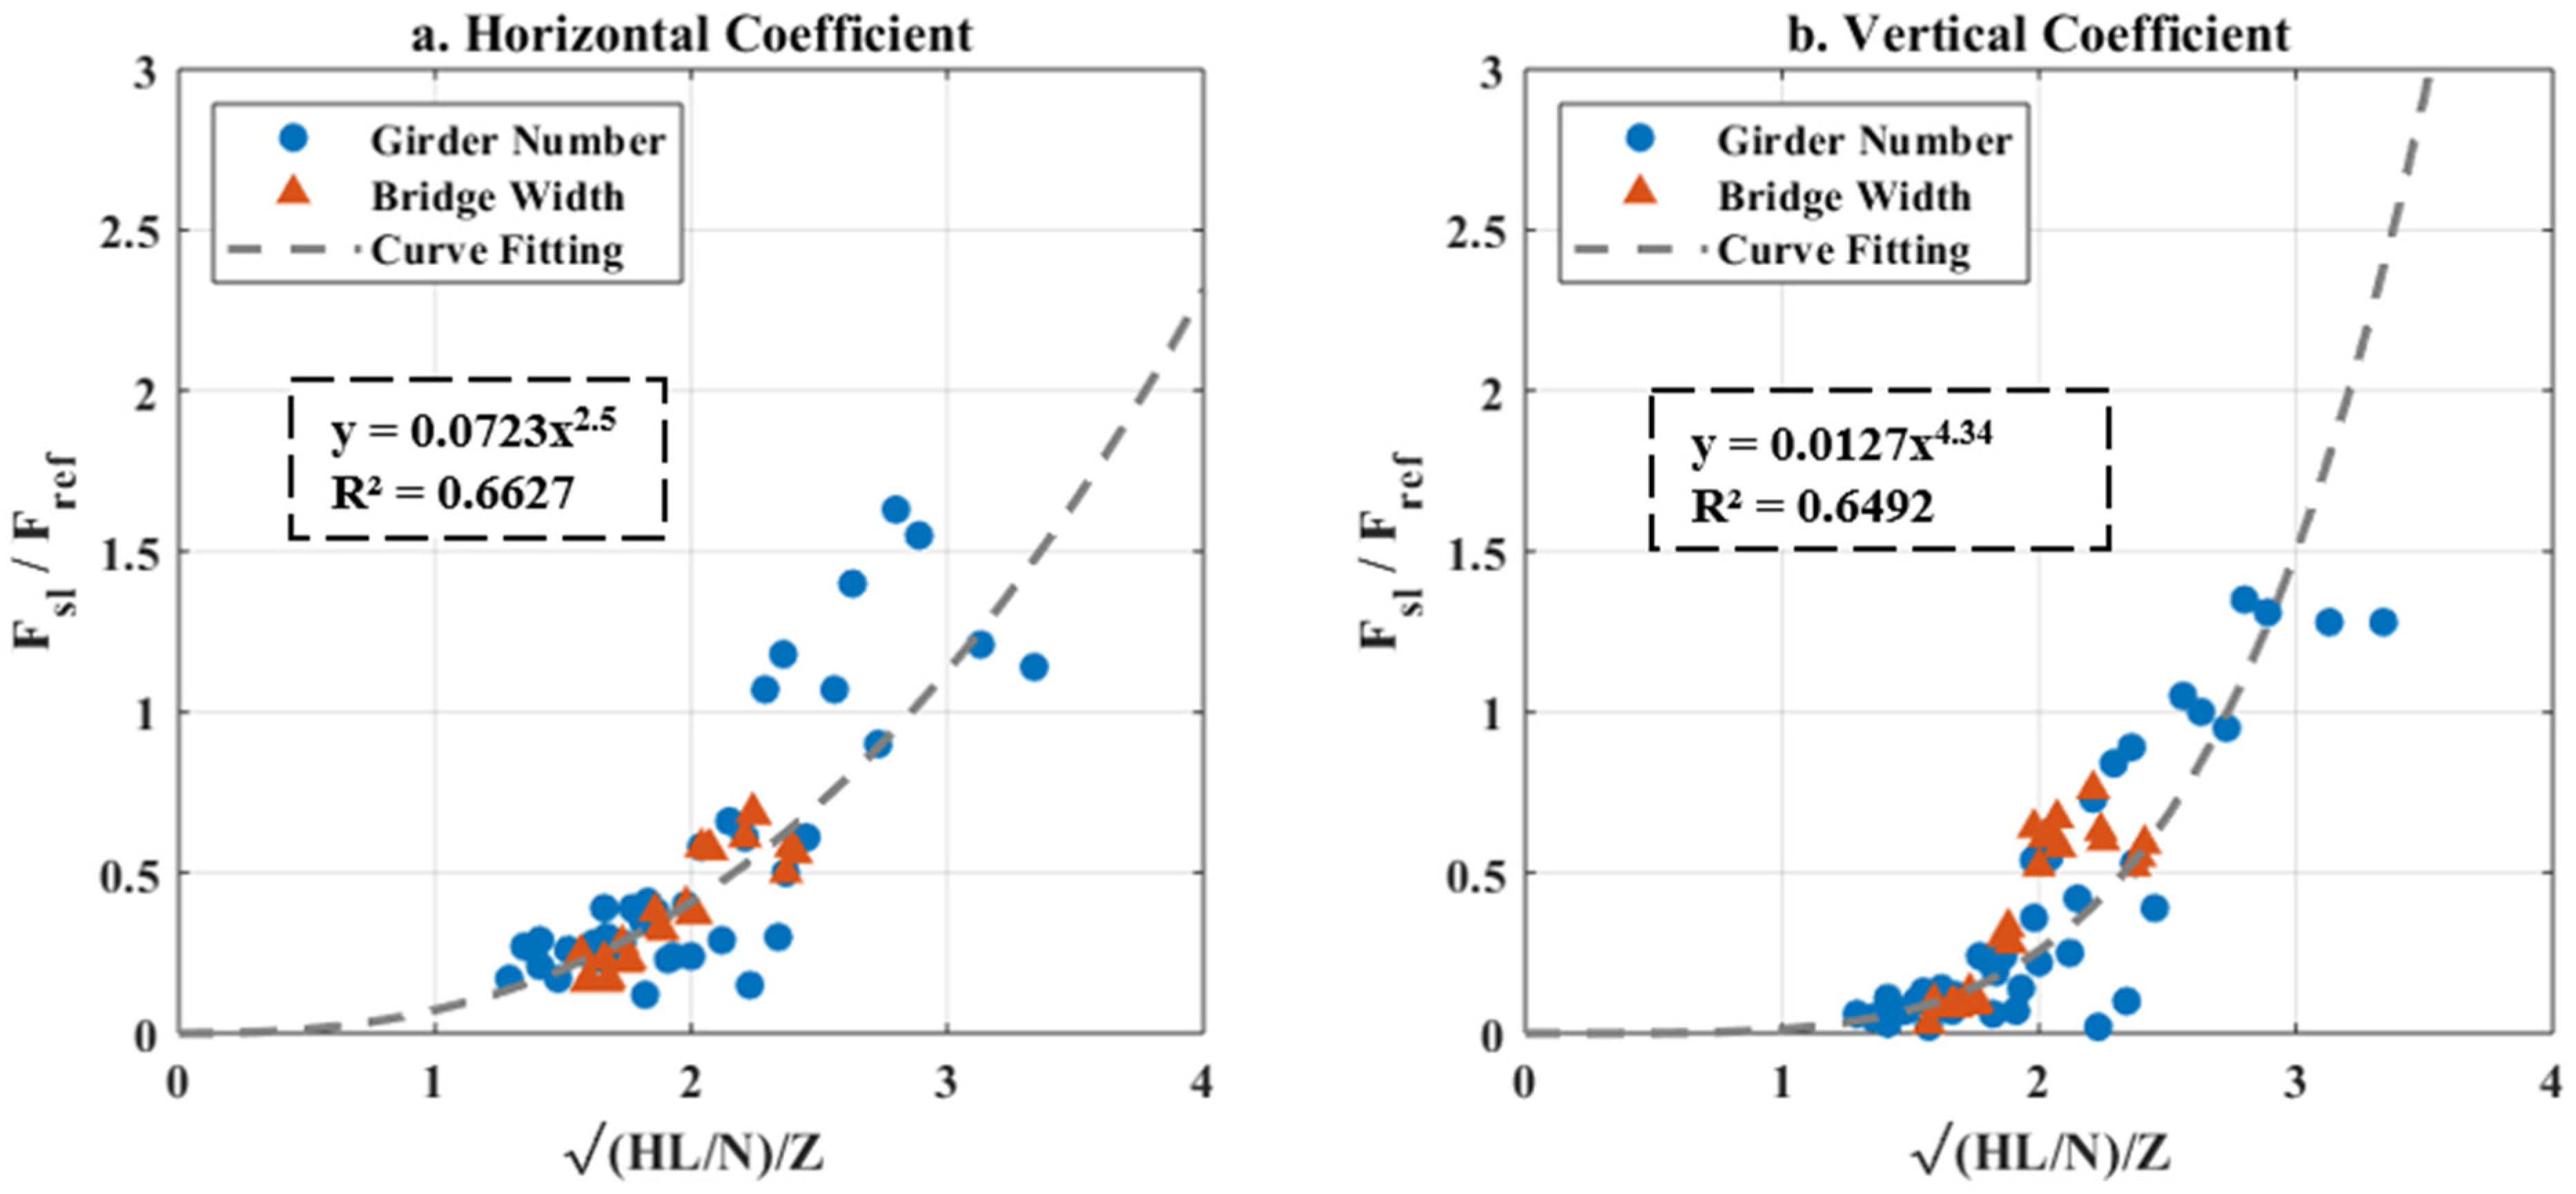
5.2. Formulation
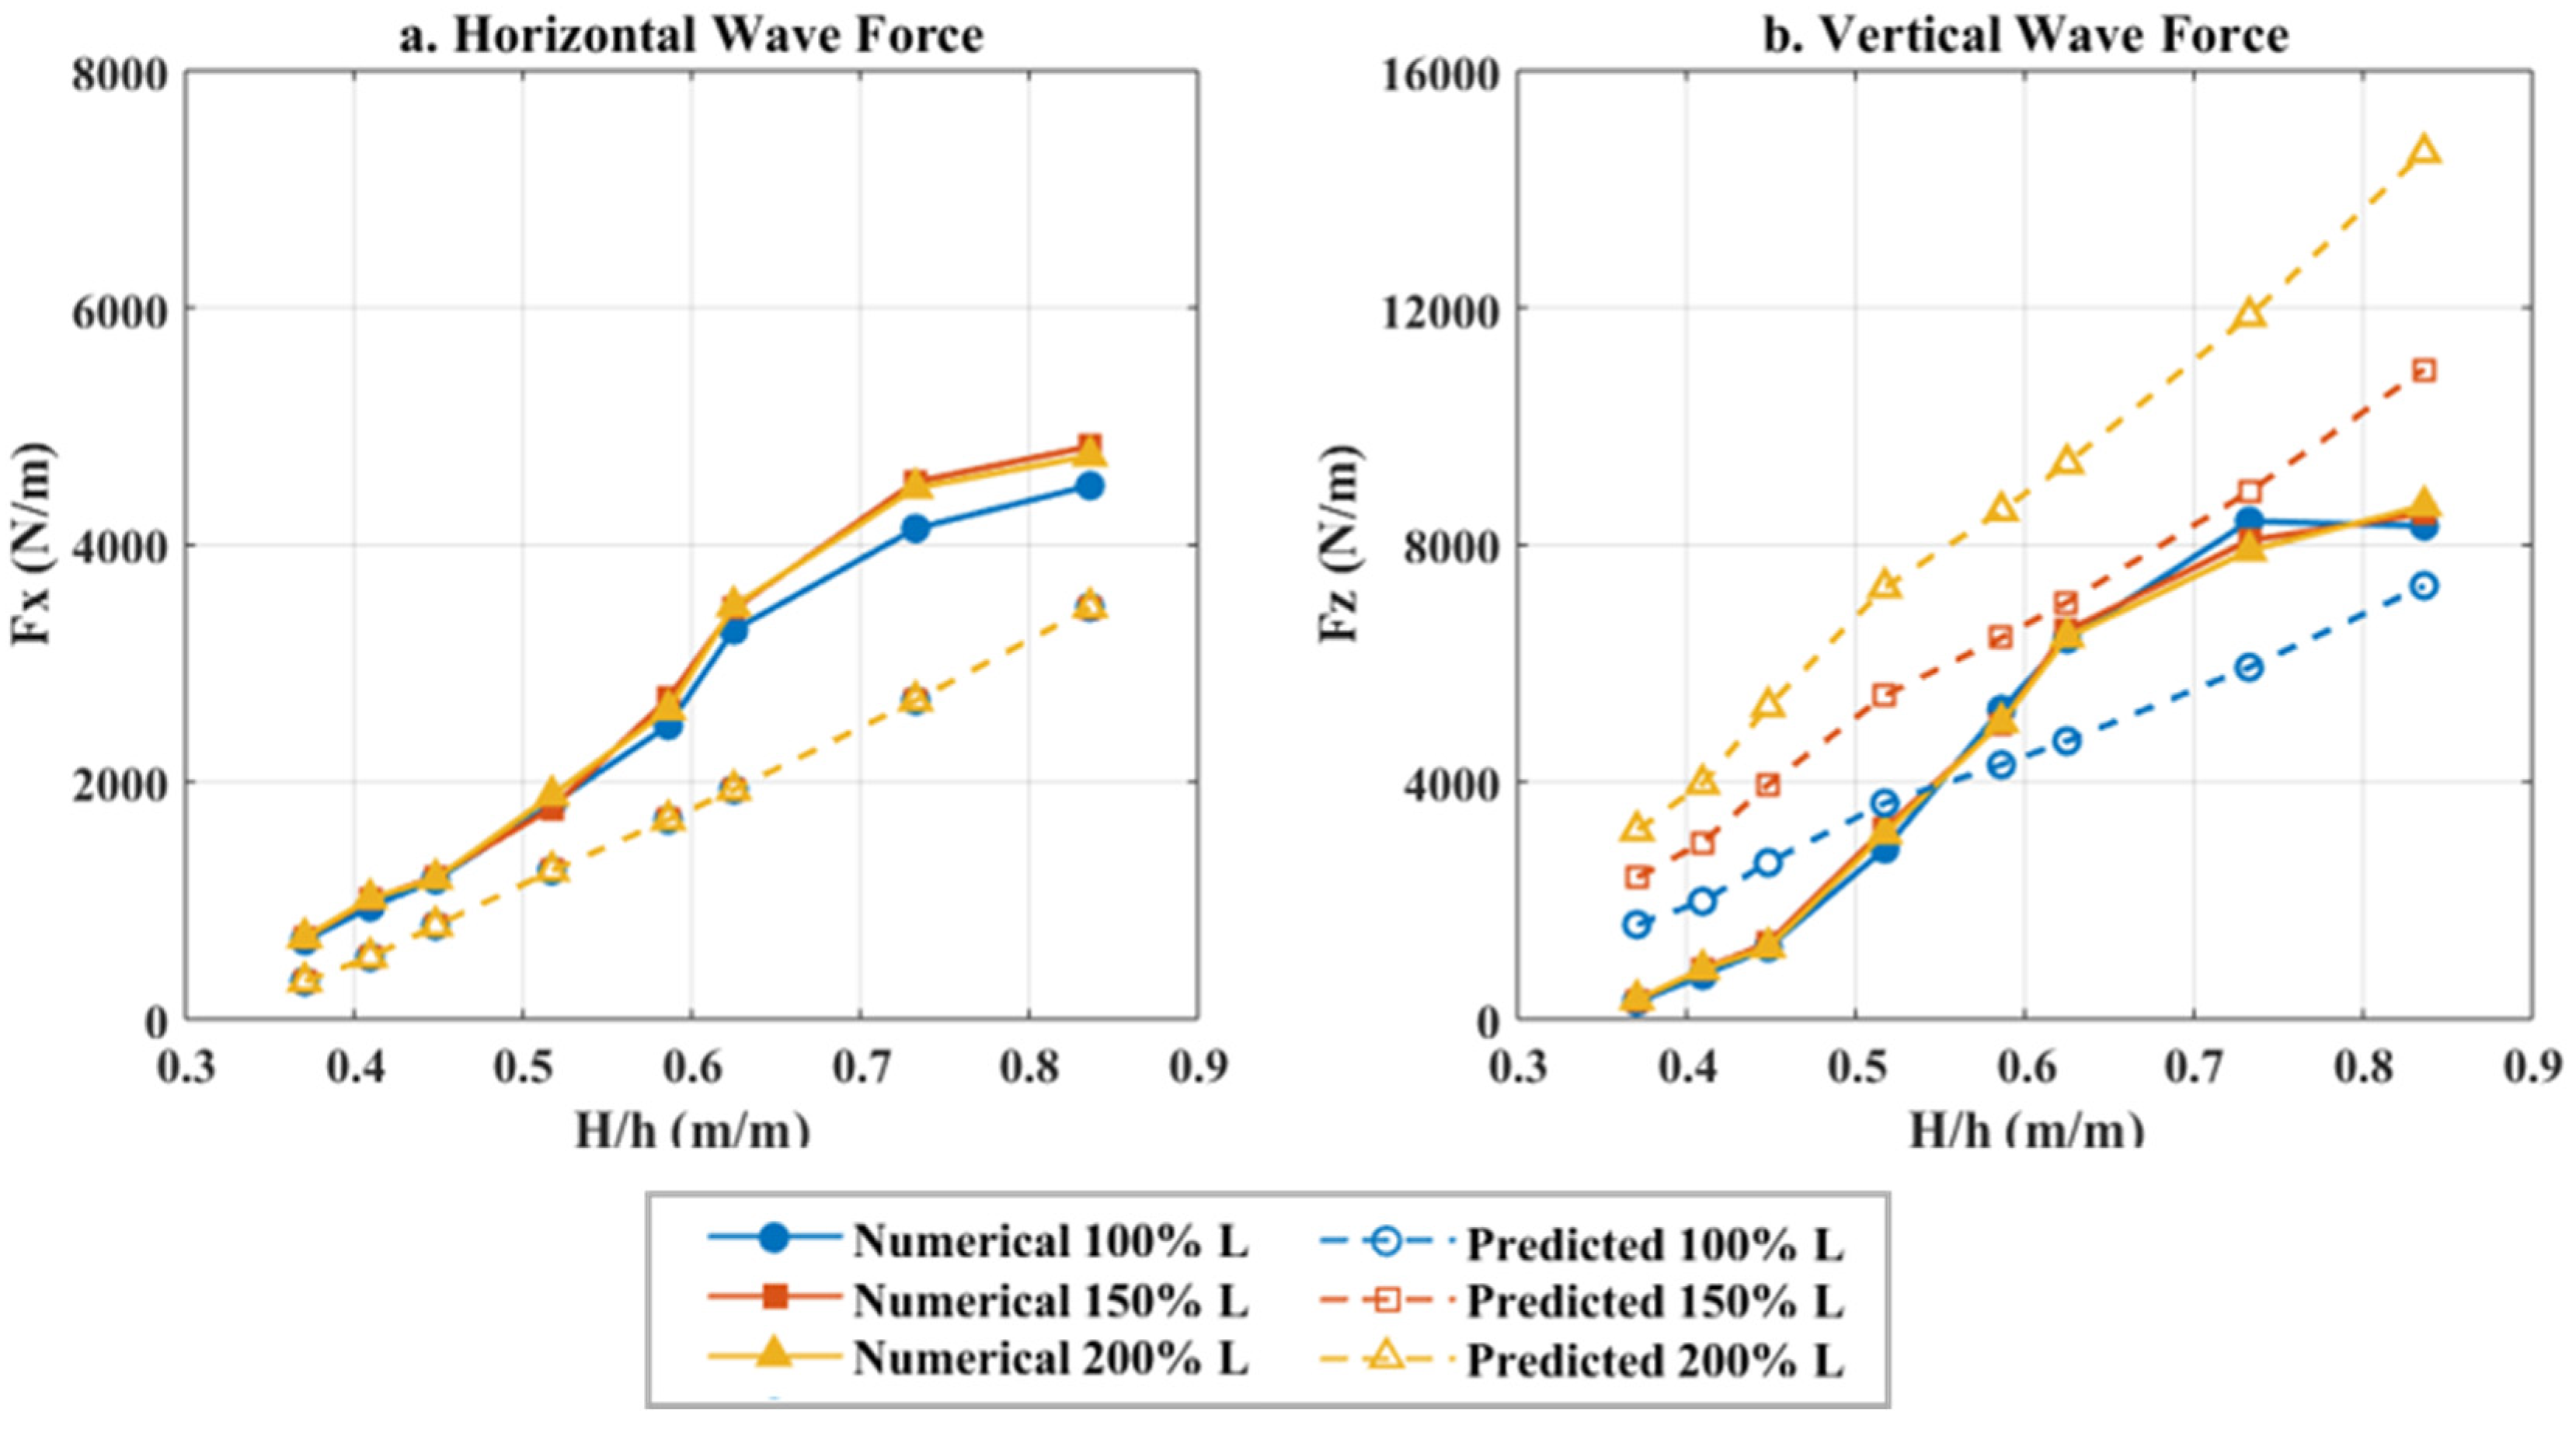
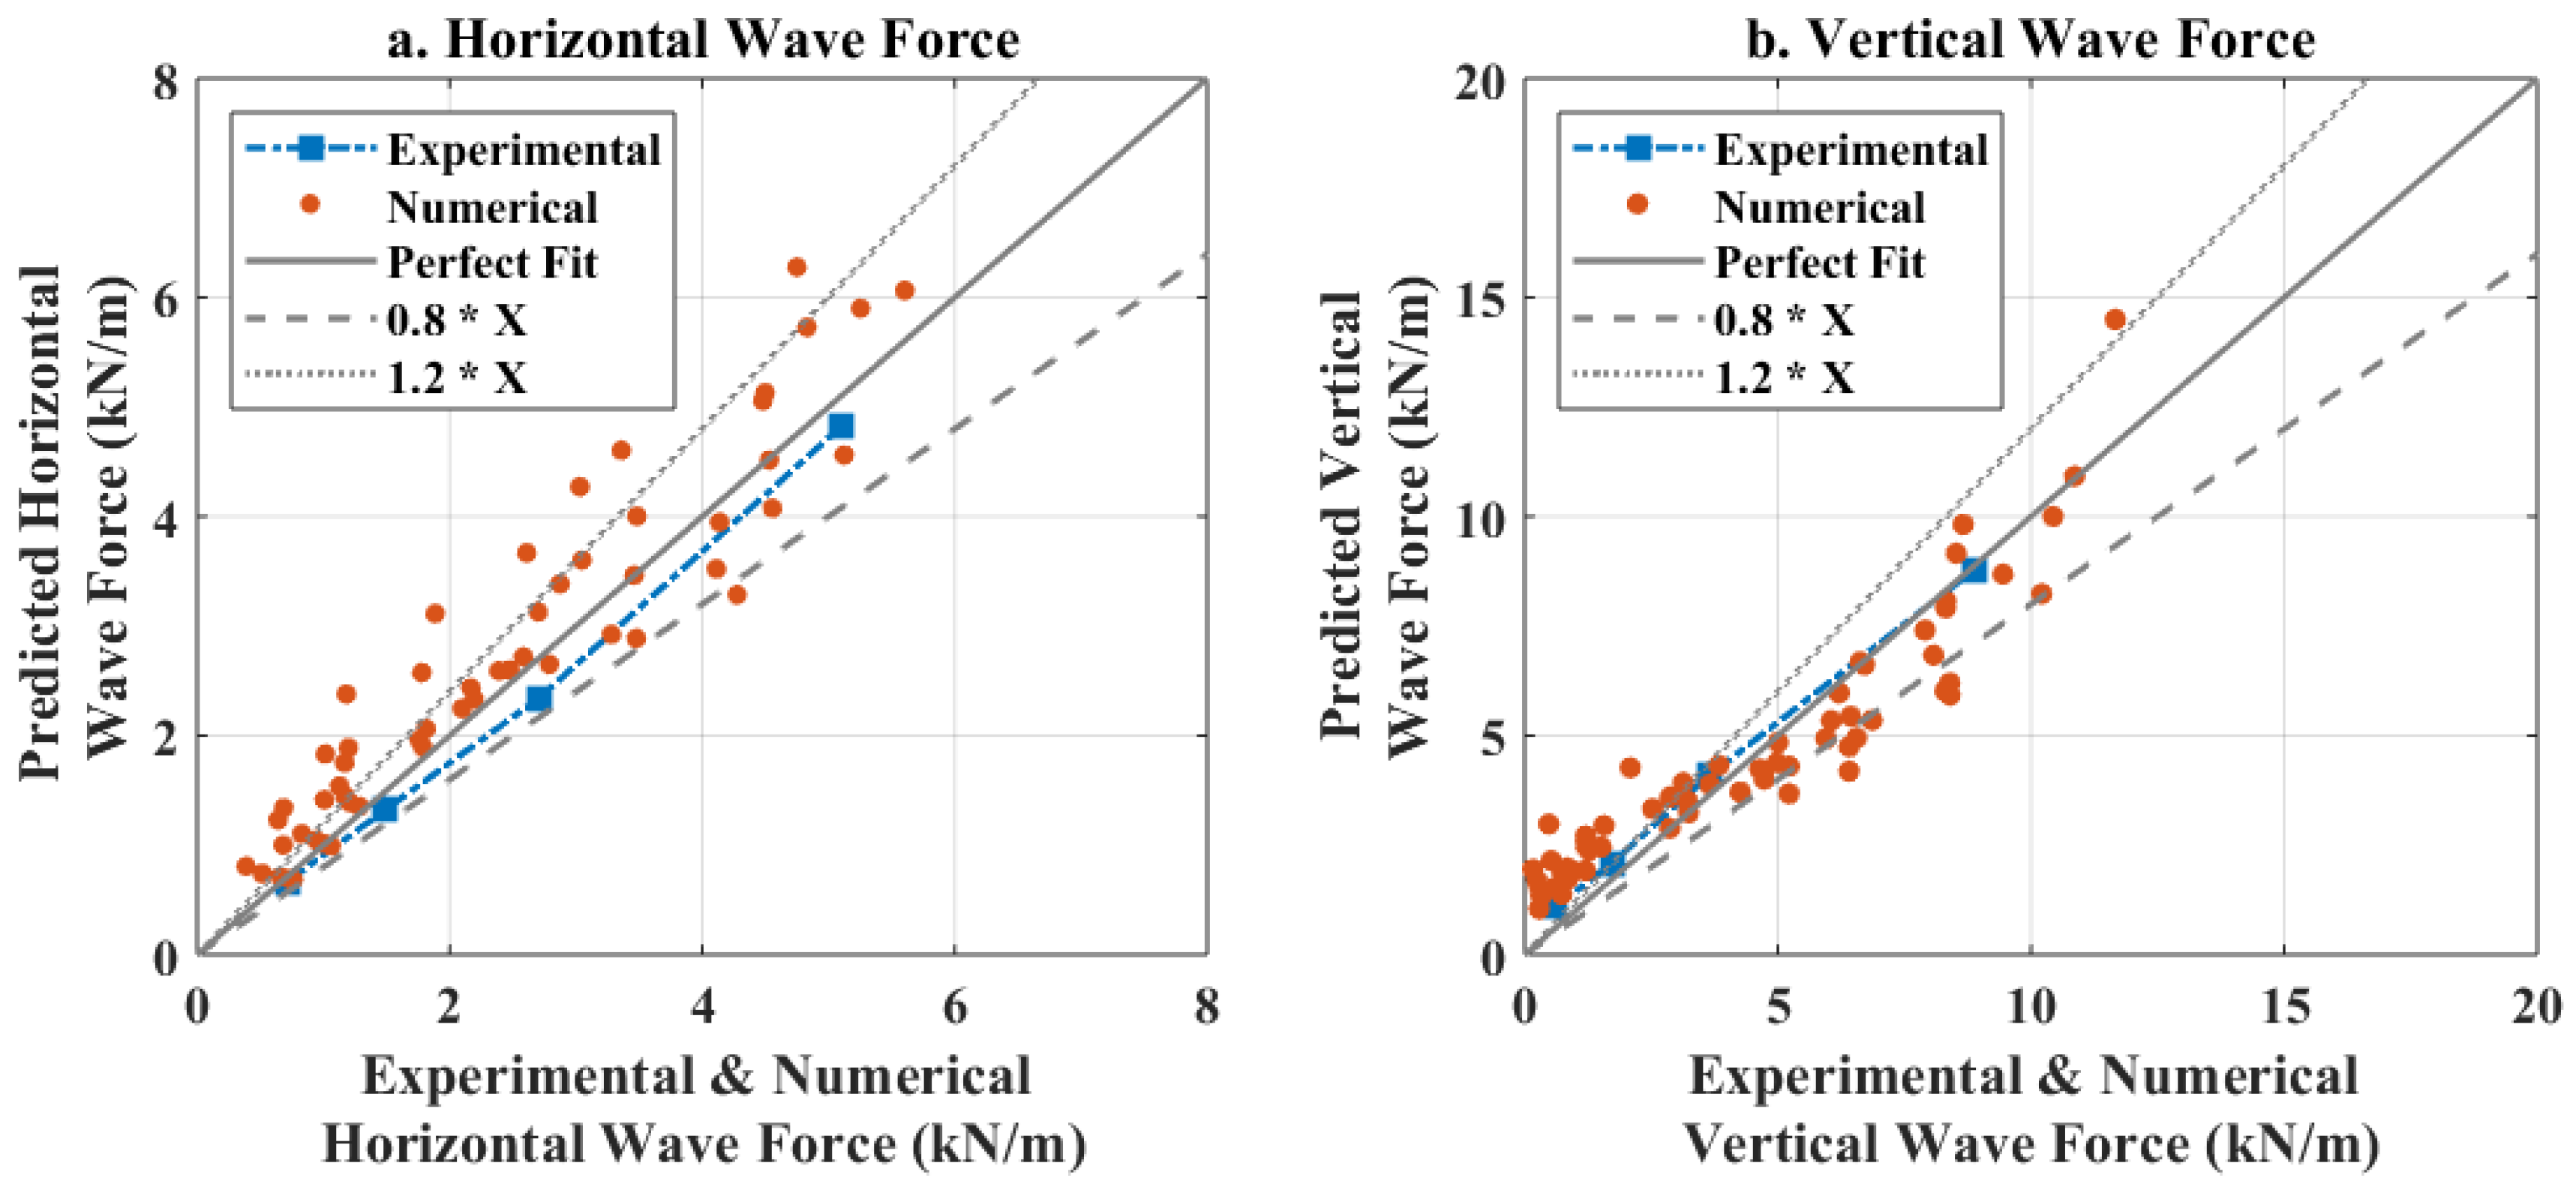
5.3. Accuracy of New Method and Comparison with Existing Equations
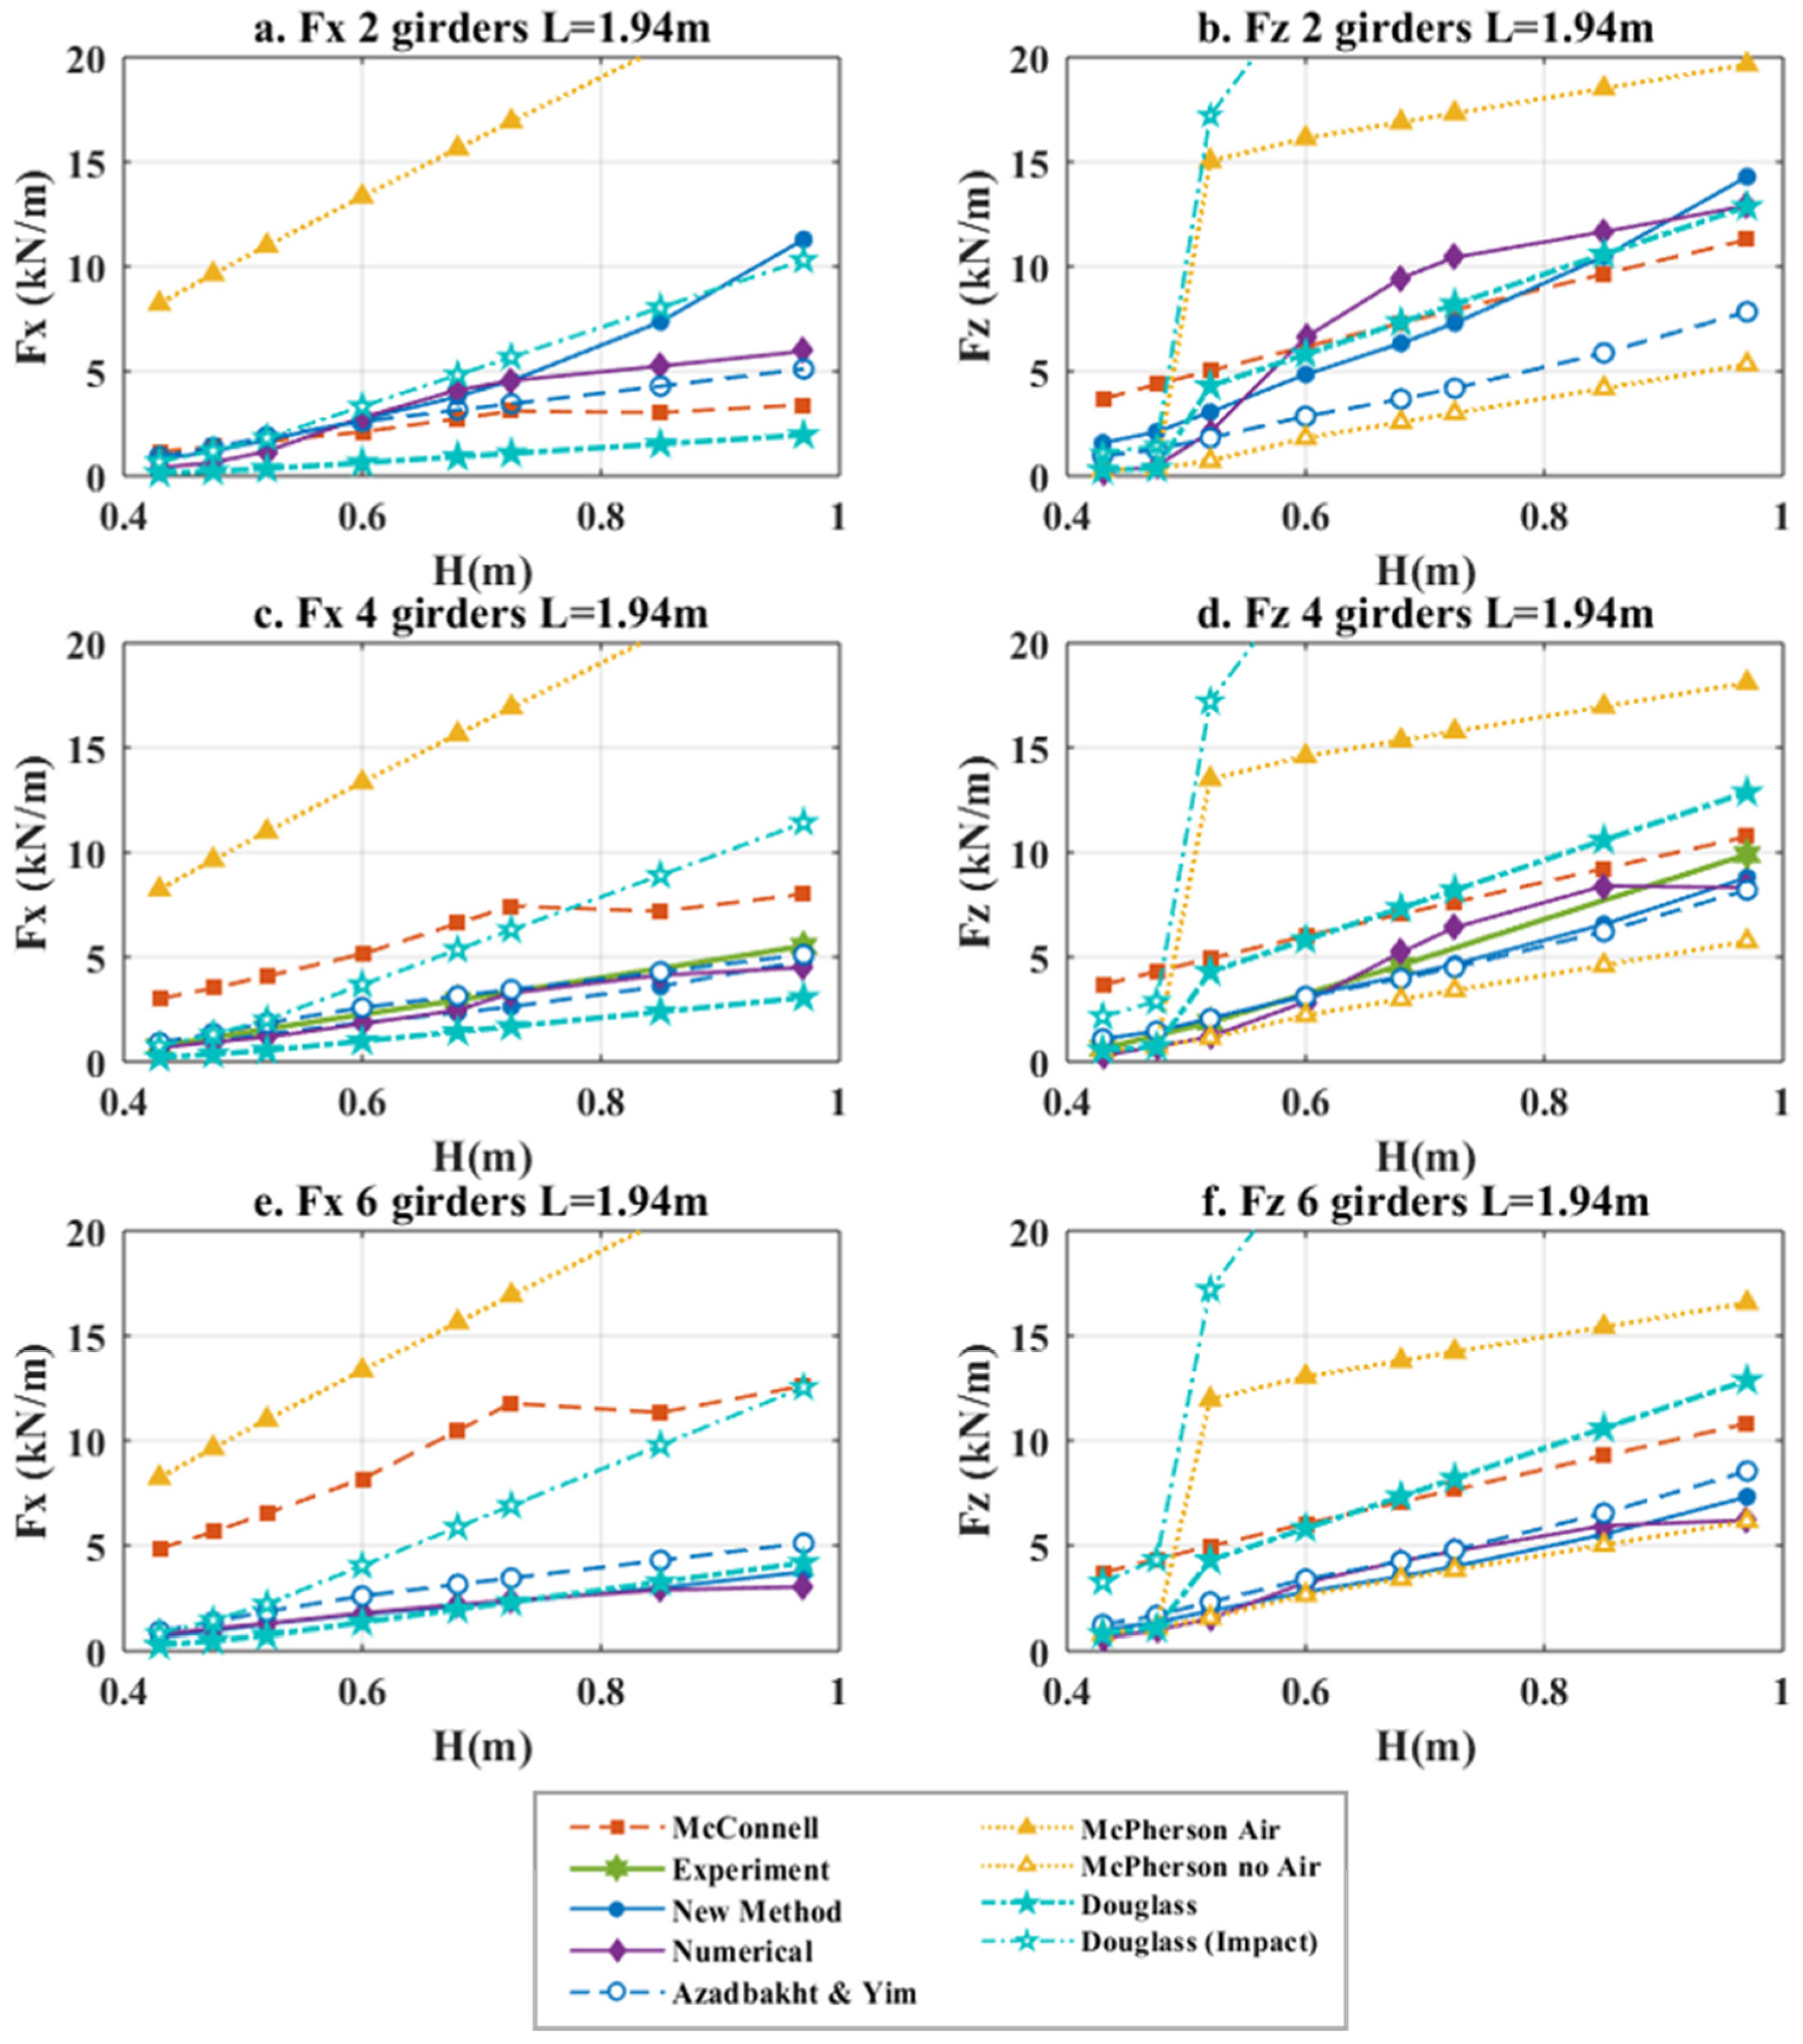
- The predictive equations of McConnell et al. [6], i.e., Equations (A1) and (A2), divided the wave forces into several components, including the ones applied on the internal and the seaward (upstream) structural elements, and considering both the slab and the girders (beams) of jetties. The force on each component is a function of a reference hydrostatic force, without the explicit consideration of the impulsive component. The total wave forces are the summation of the wave forces on each structural element, which means that this set of equations considers the geometry of the deck.
- Douglass et al. [7] proposed predictive equations for the total applied wave forces on a coastal deck (see Equations (A3)–(A6)). These forces are calculated based on (i) a reference hydrostatic force and (ii) different coefficients that can be used to estimate either the “slowly-varying” forces or the total ones that include the impact component as well. Interestingly, the impact coefficient of the uplift forces was suggested to be three times larger than “slowly-varying” coefficient, revealing the high magnitude of the impact forces. Moreover, the equation for the uplift force is a function of the bridge width, while the horizontal force is a function of the number of girders Ng. In the horizontal force equation the internal girders are contributing to the total force with a reduced coefficient of 0.4 relative to the offshore external girder (coefficient = 1).
- McPherson [8] developed a different set of equations for the total wave loads applied on coastal bridge decks. In contrast to the equation of [7], the horizontal force was not a function of the internal girders, but just the external offshore and onshore girders, meaning the Ng did not influence the predicted force. On the other hand, the uplift wave force was distributed into the hydrostatic force (), buoyancy force (), the weight of overtop** water () and the air-entrapment force (). In this method all the internal chambers were assumed to be filled with air up to 50% of their individual volume, which means that the total uplift was dependent on the volume of the chamber and consequently on the number of girders Ng.
6. Summary and Conclusions
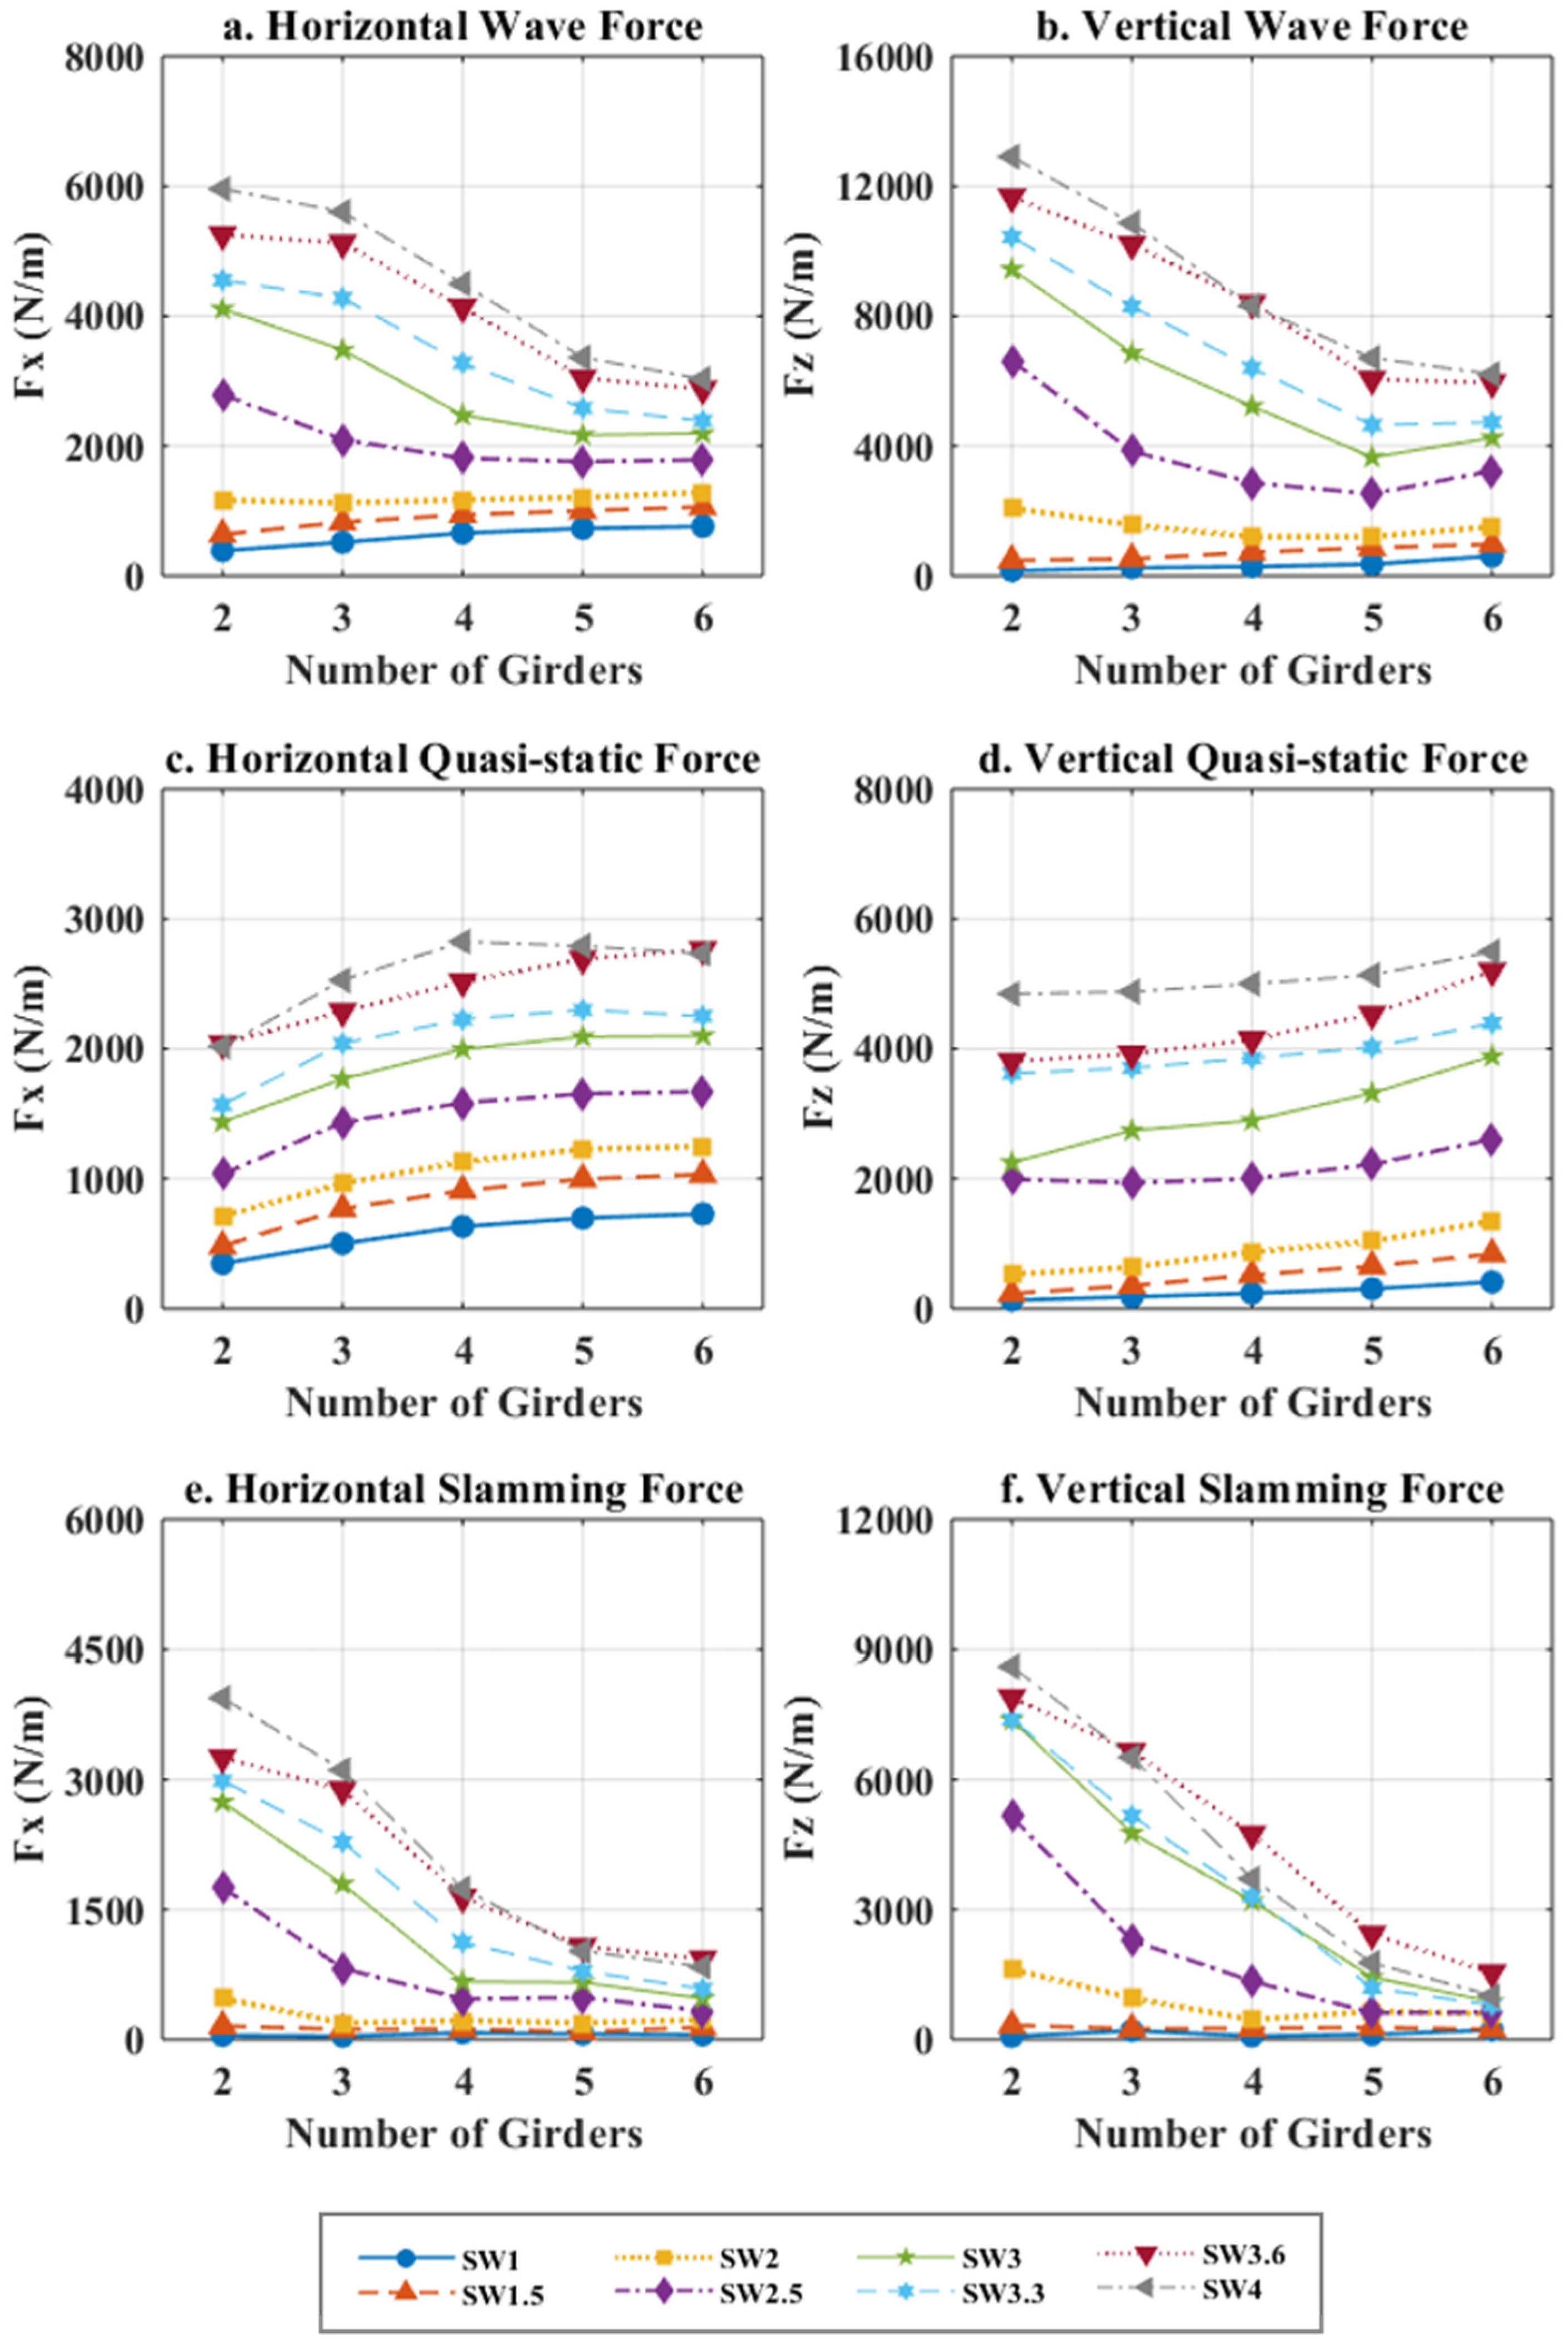
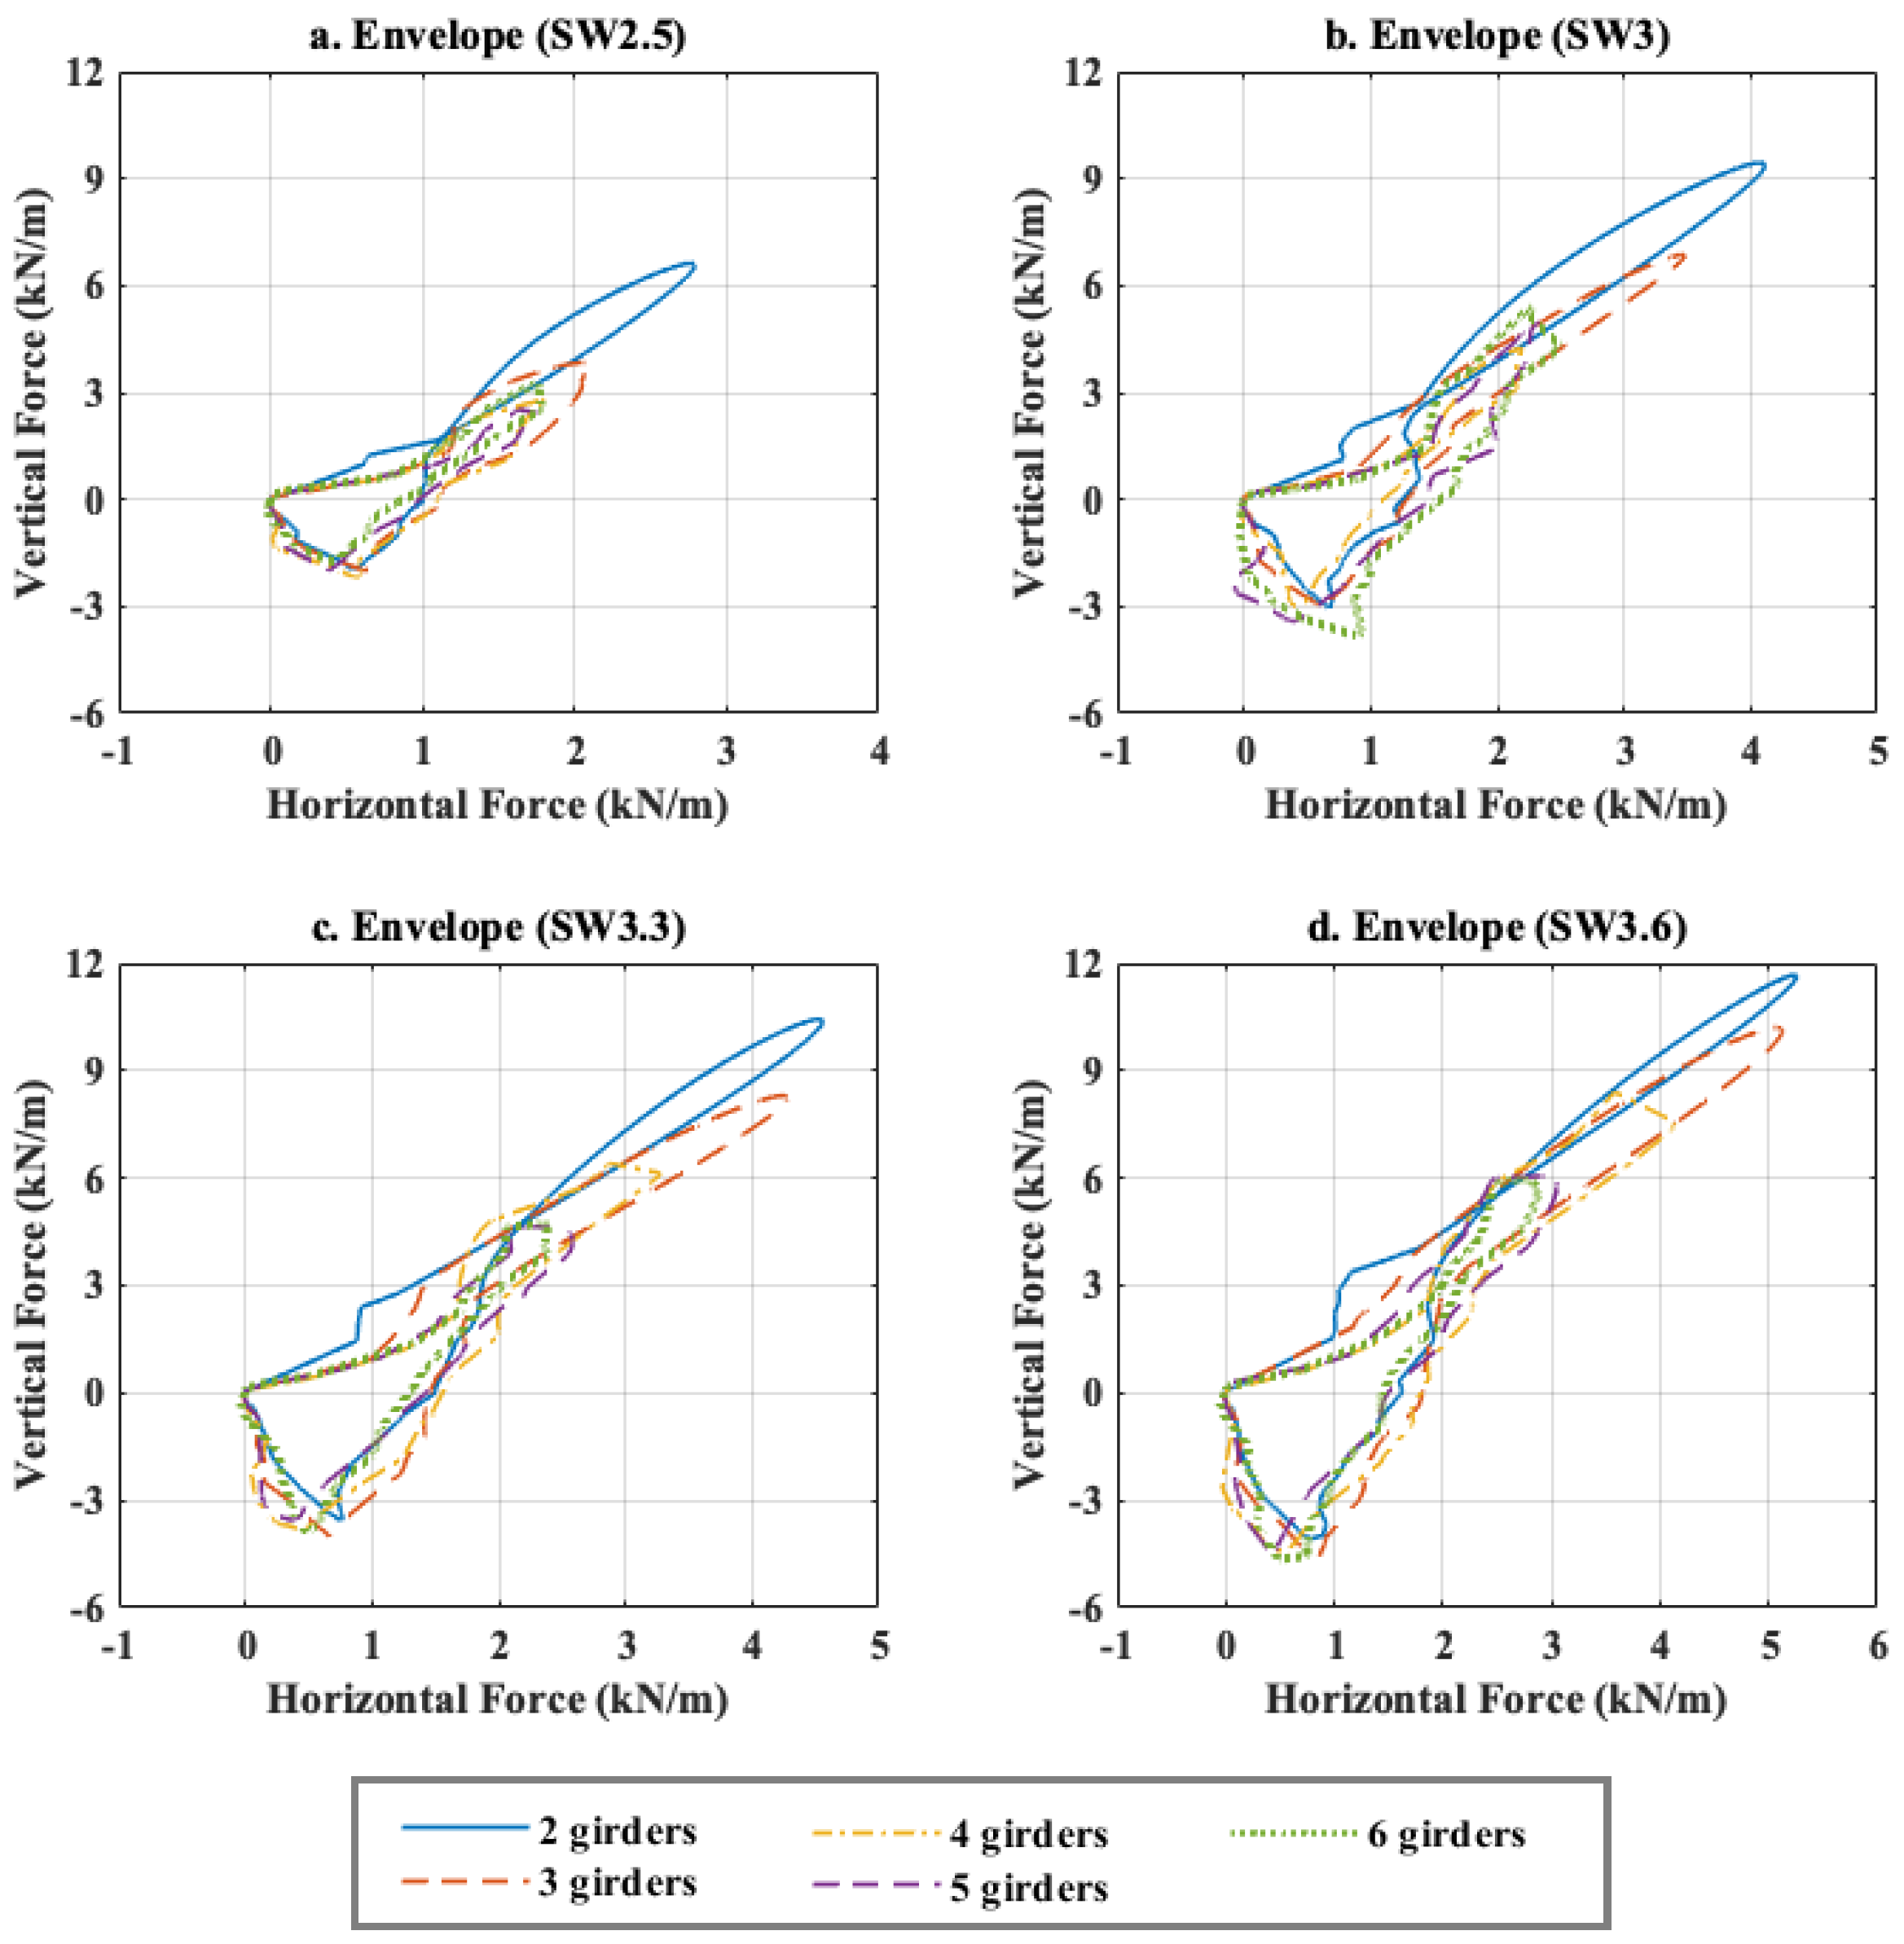
- The effect of Ng on the total forces is dependent on the wave height H. For small H, the maximum horizontal and vertical forces increase with Ng at a relatively small rate, while for medium-to-large H the increase of the Ng causes major reductions of the forces at a much larger rate. In fact, the five-girder deck has to withstand about 50% and 33% of the horizontal and uplift forces applied on the two-girder deck.
- For both the horizontal and uplift direction the Ng has an opposite effect on the quasi-static and slamming forces, which could potentially explain the complex role of Ng observed in previous studies [40,50,51]. In fact, as Ng increases, the maximum values of the quasi-static forces increase nonlinearly with a slow rate, while the slamming forces decrease dramatically. Depending on the deck geometry, the latter forces can be twice as large as the former ones for the big waves and negligible for the small ones, which means that the effect of Ng on the total forces is governed by its effect on (i) the slamming forces when the wave height is large and Ng is small, (ii) the quasi-static ones when the wave is small, and (iii) both components for all other cases.
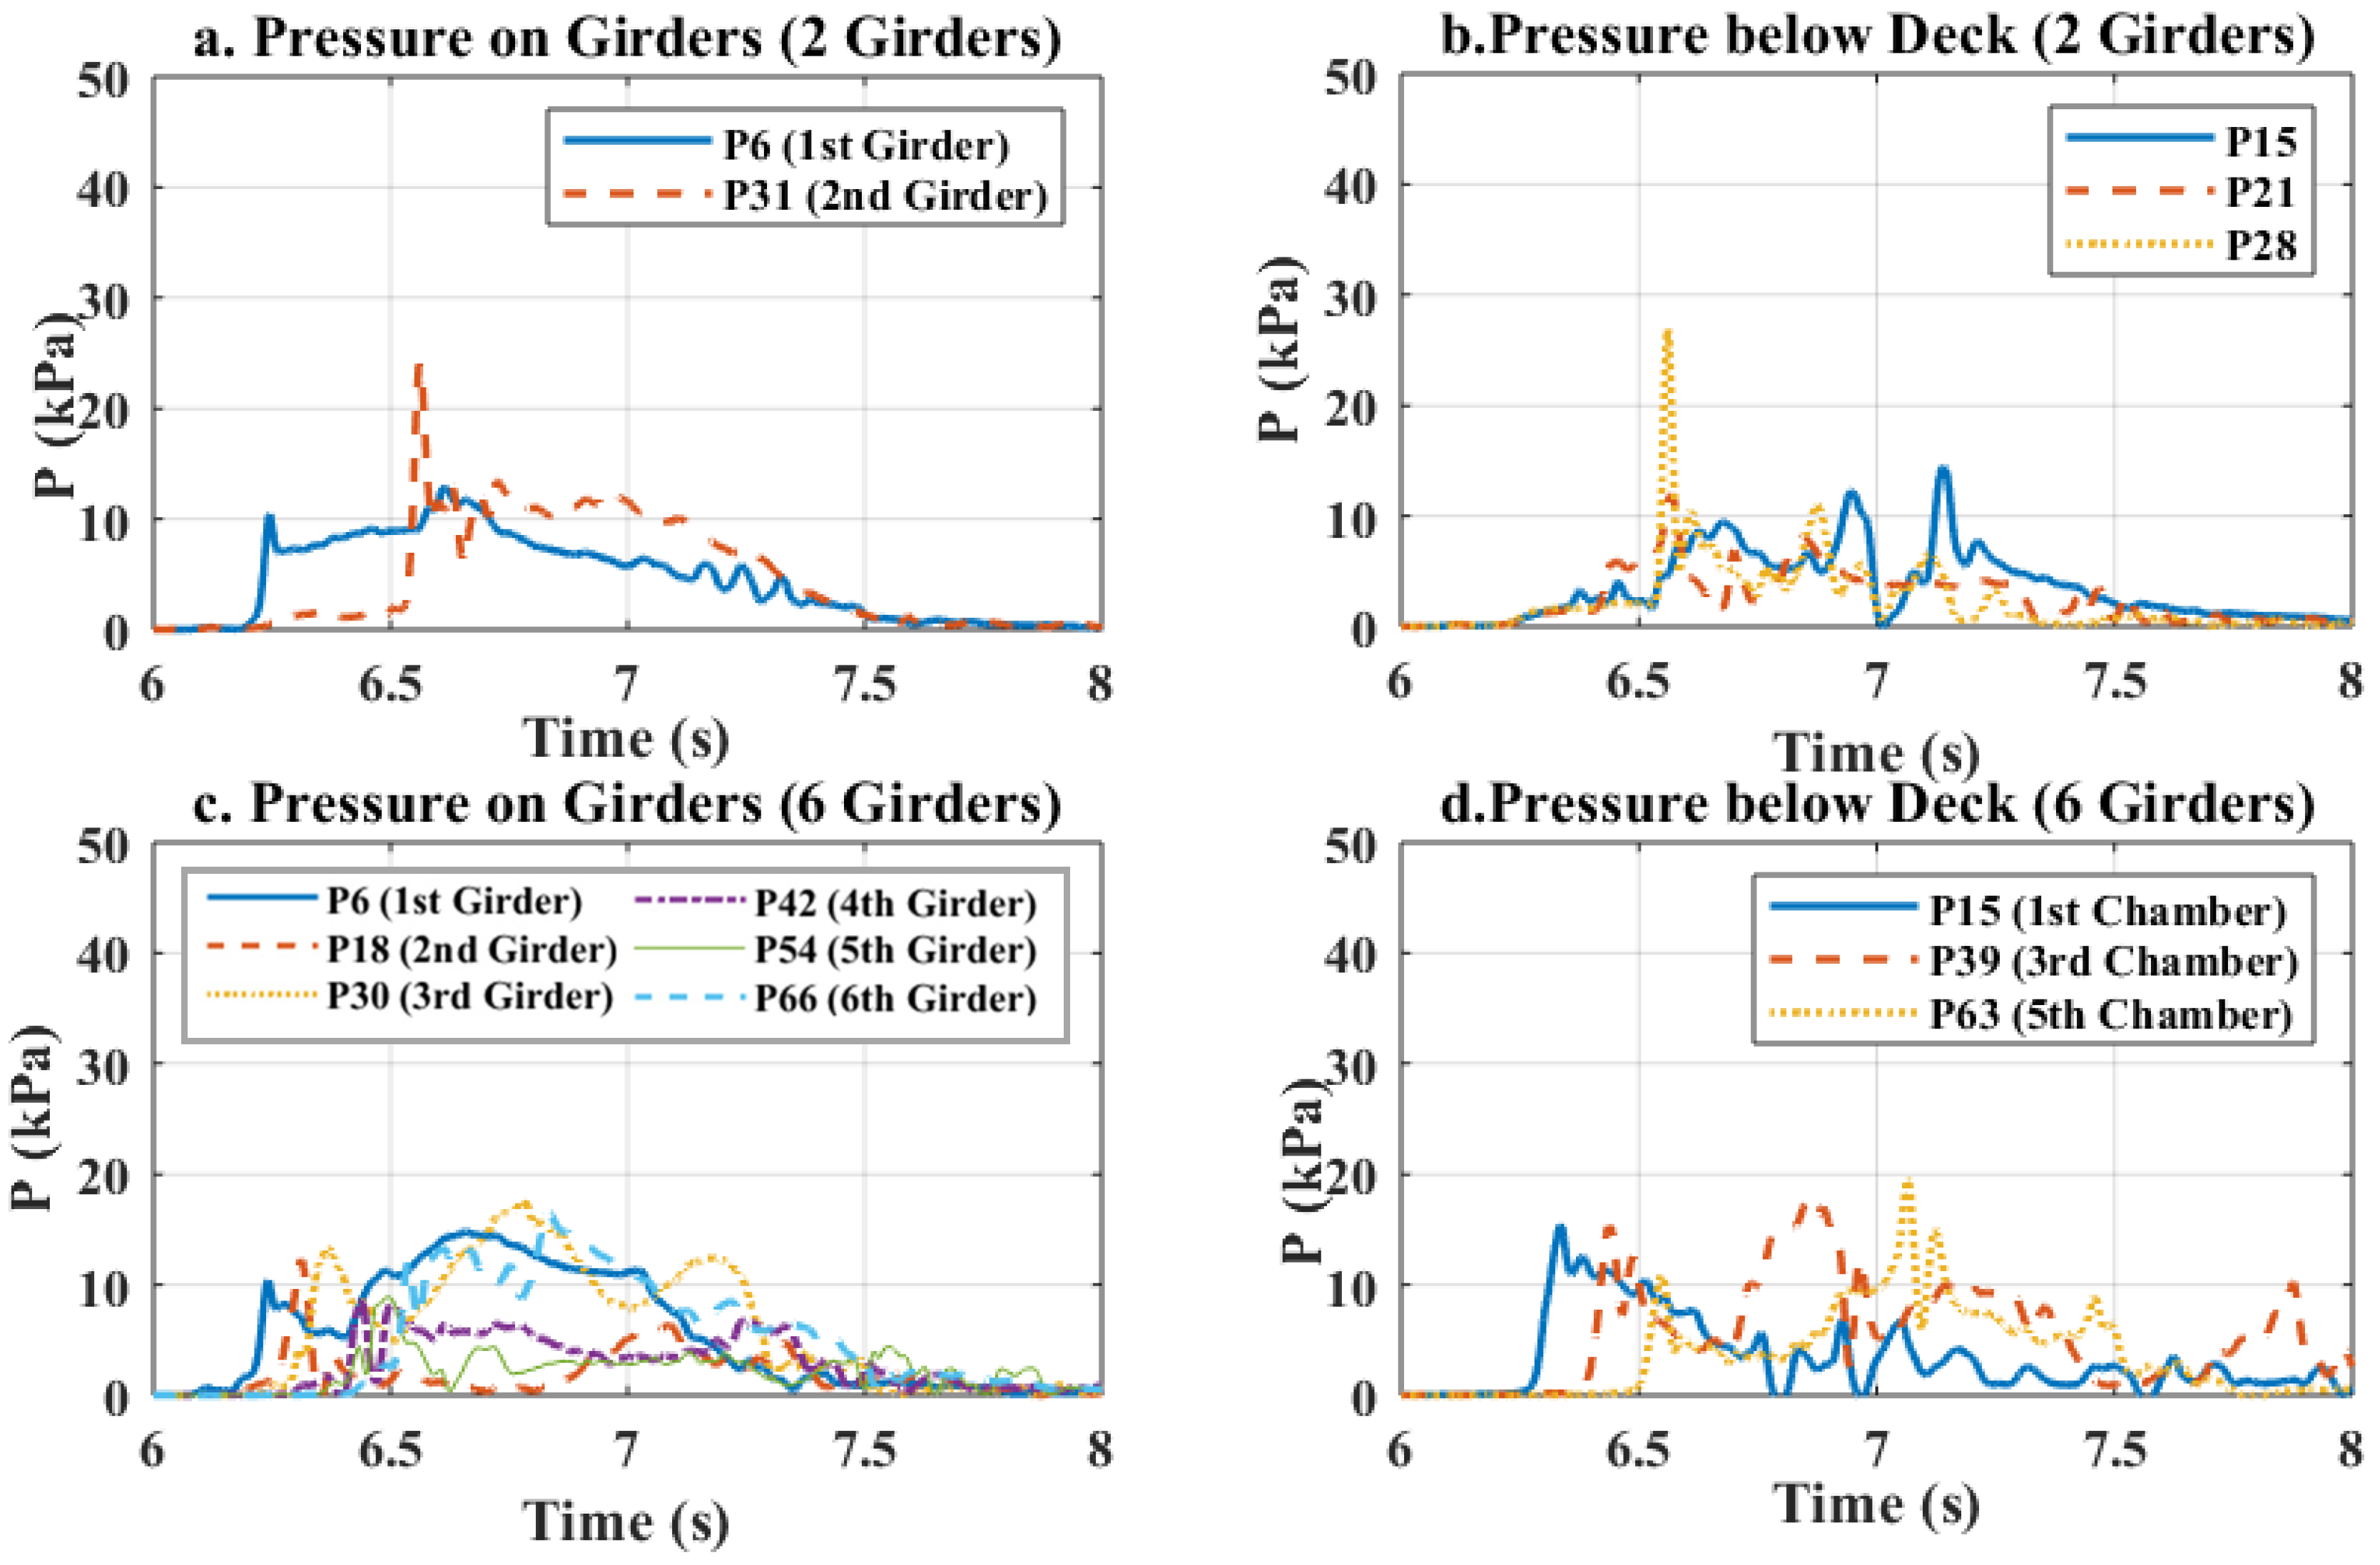
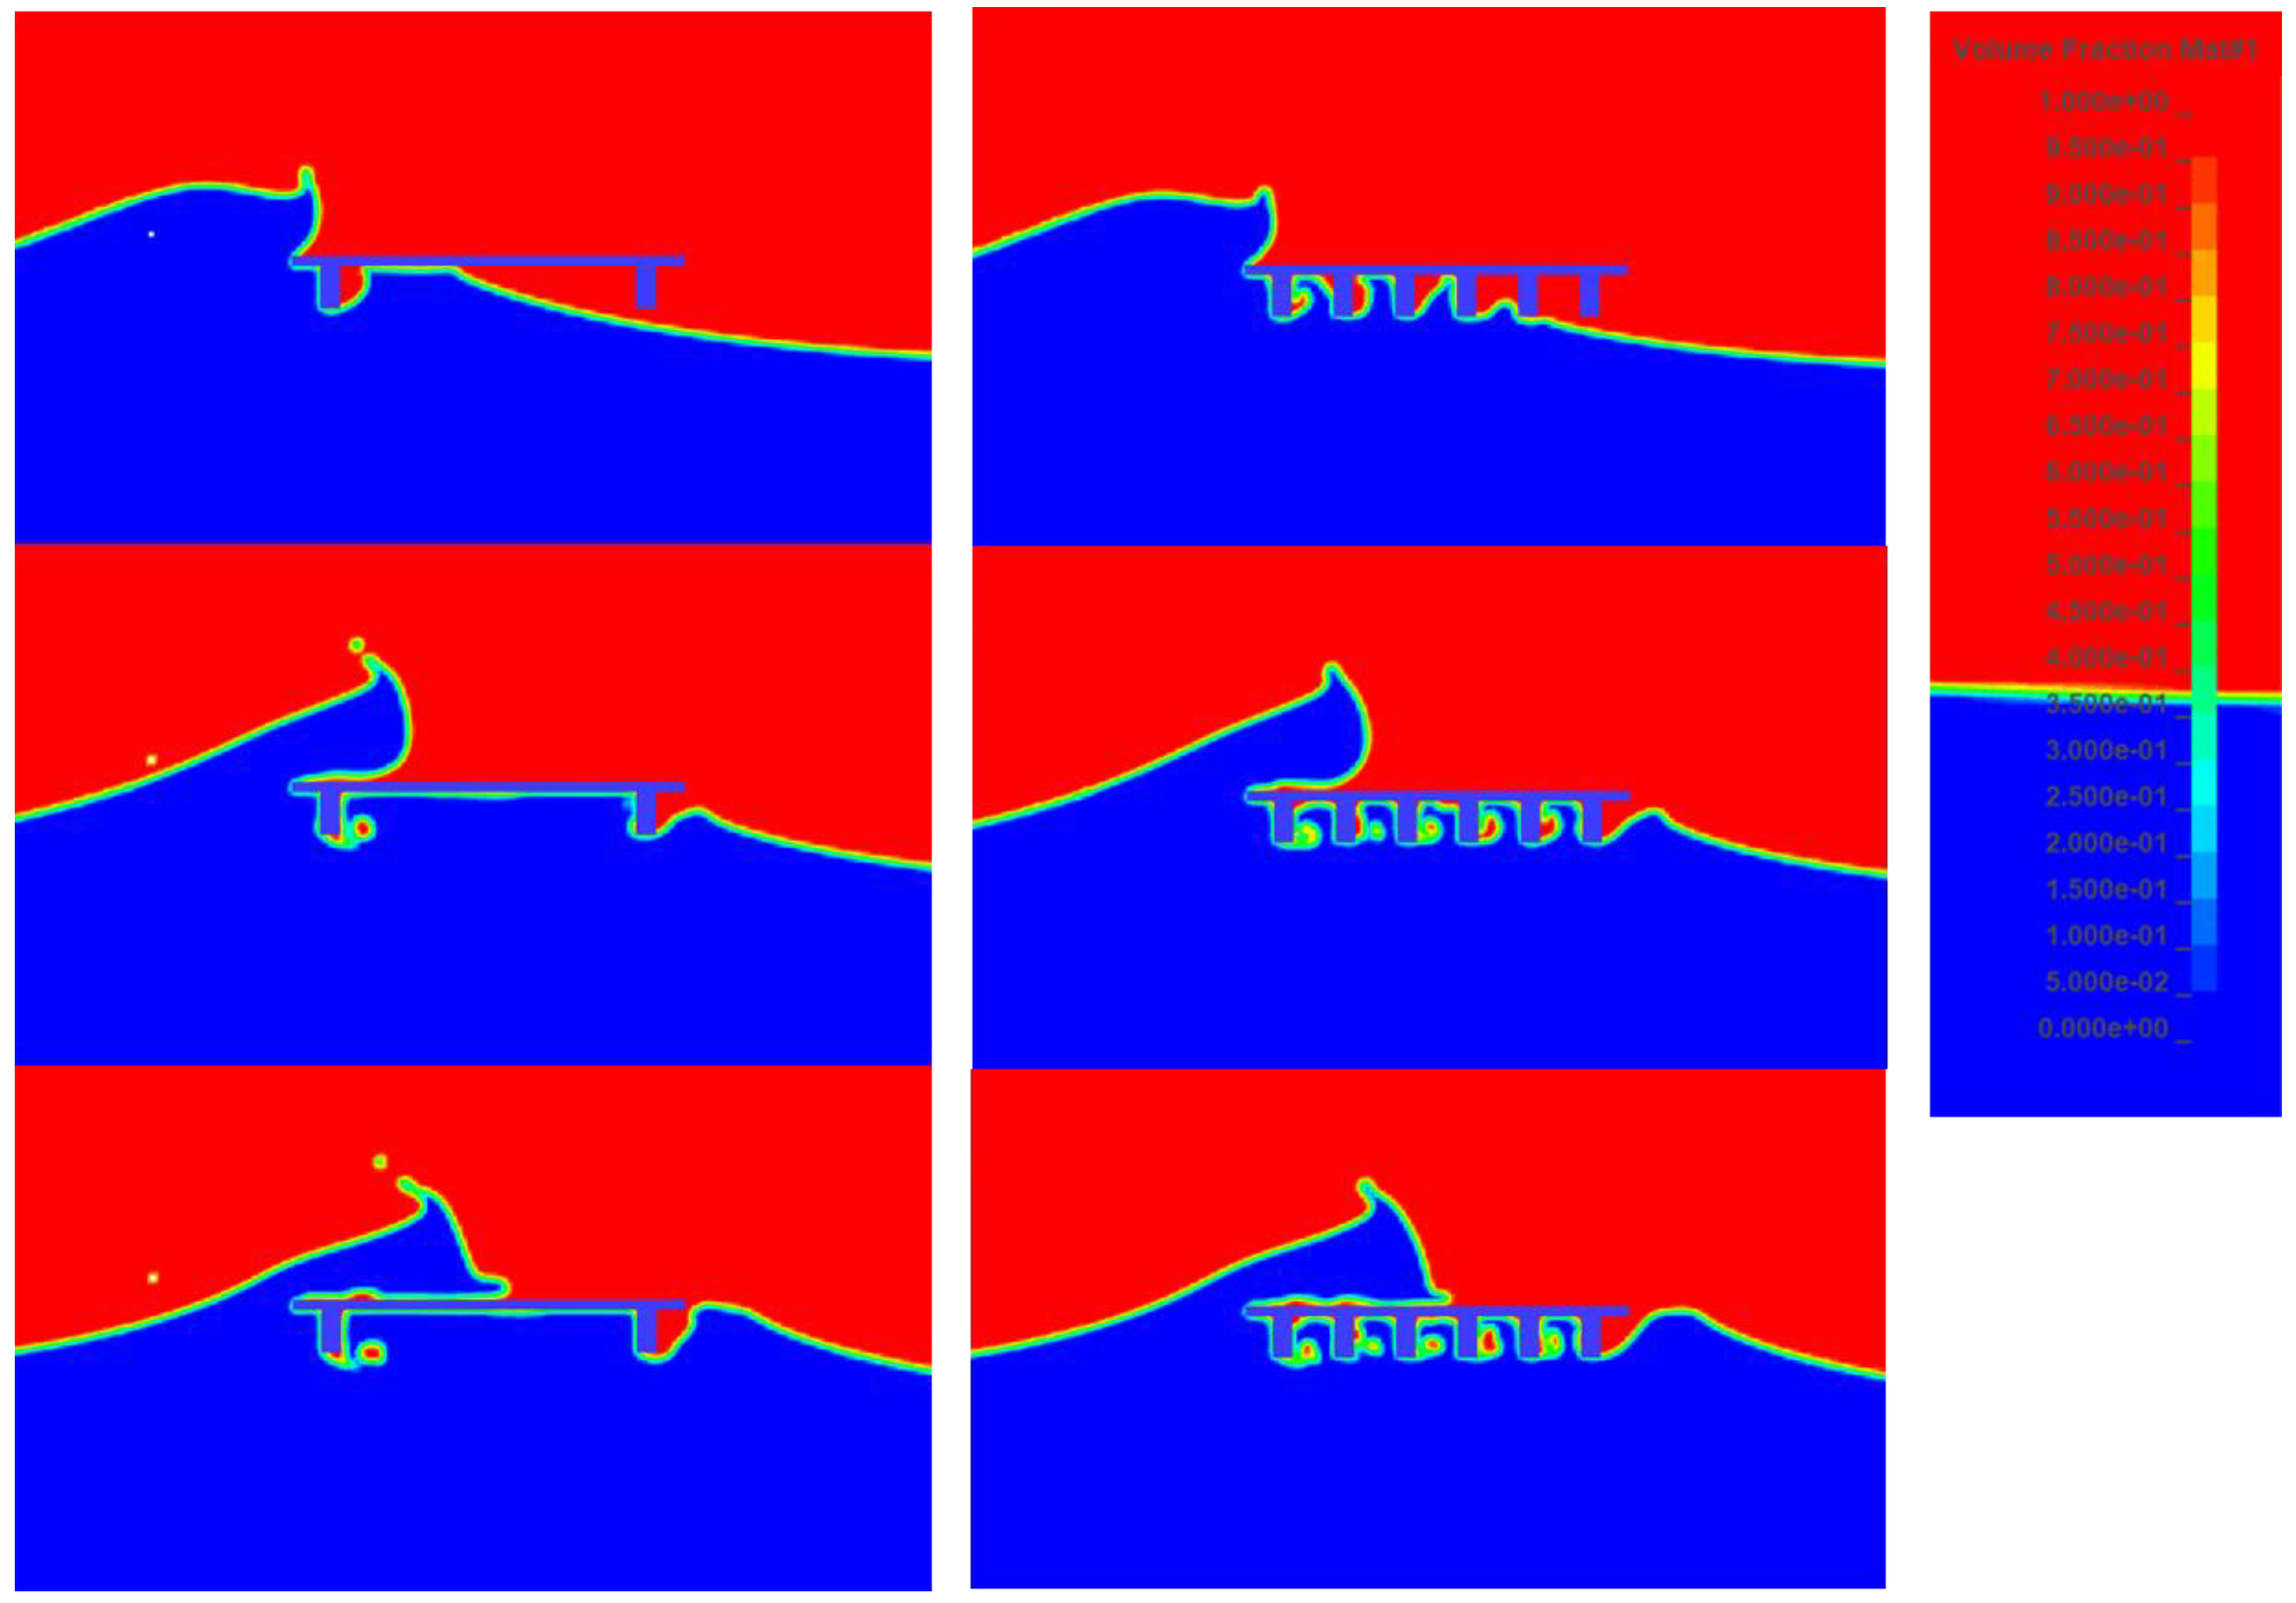
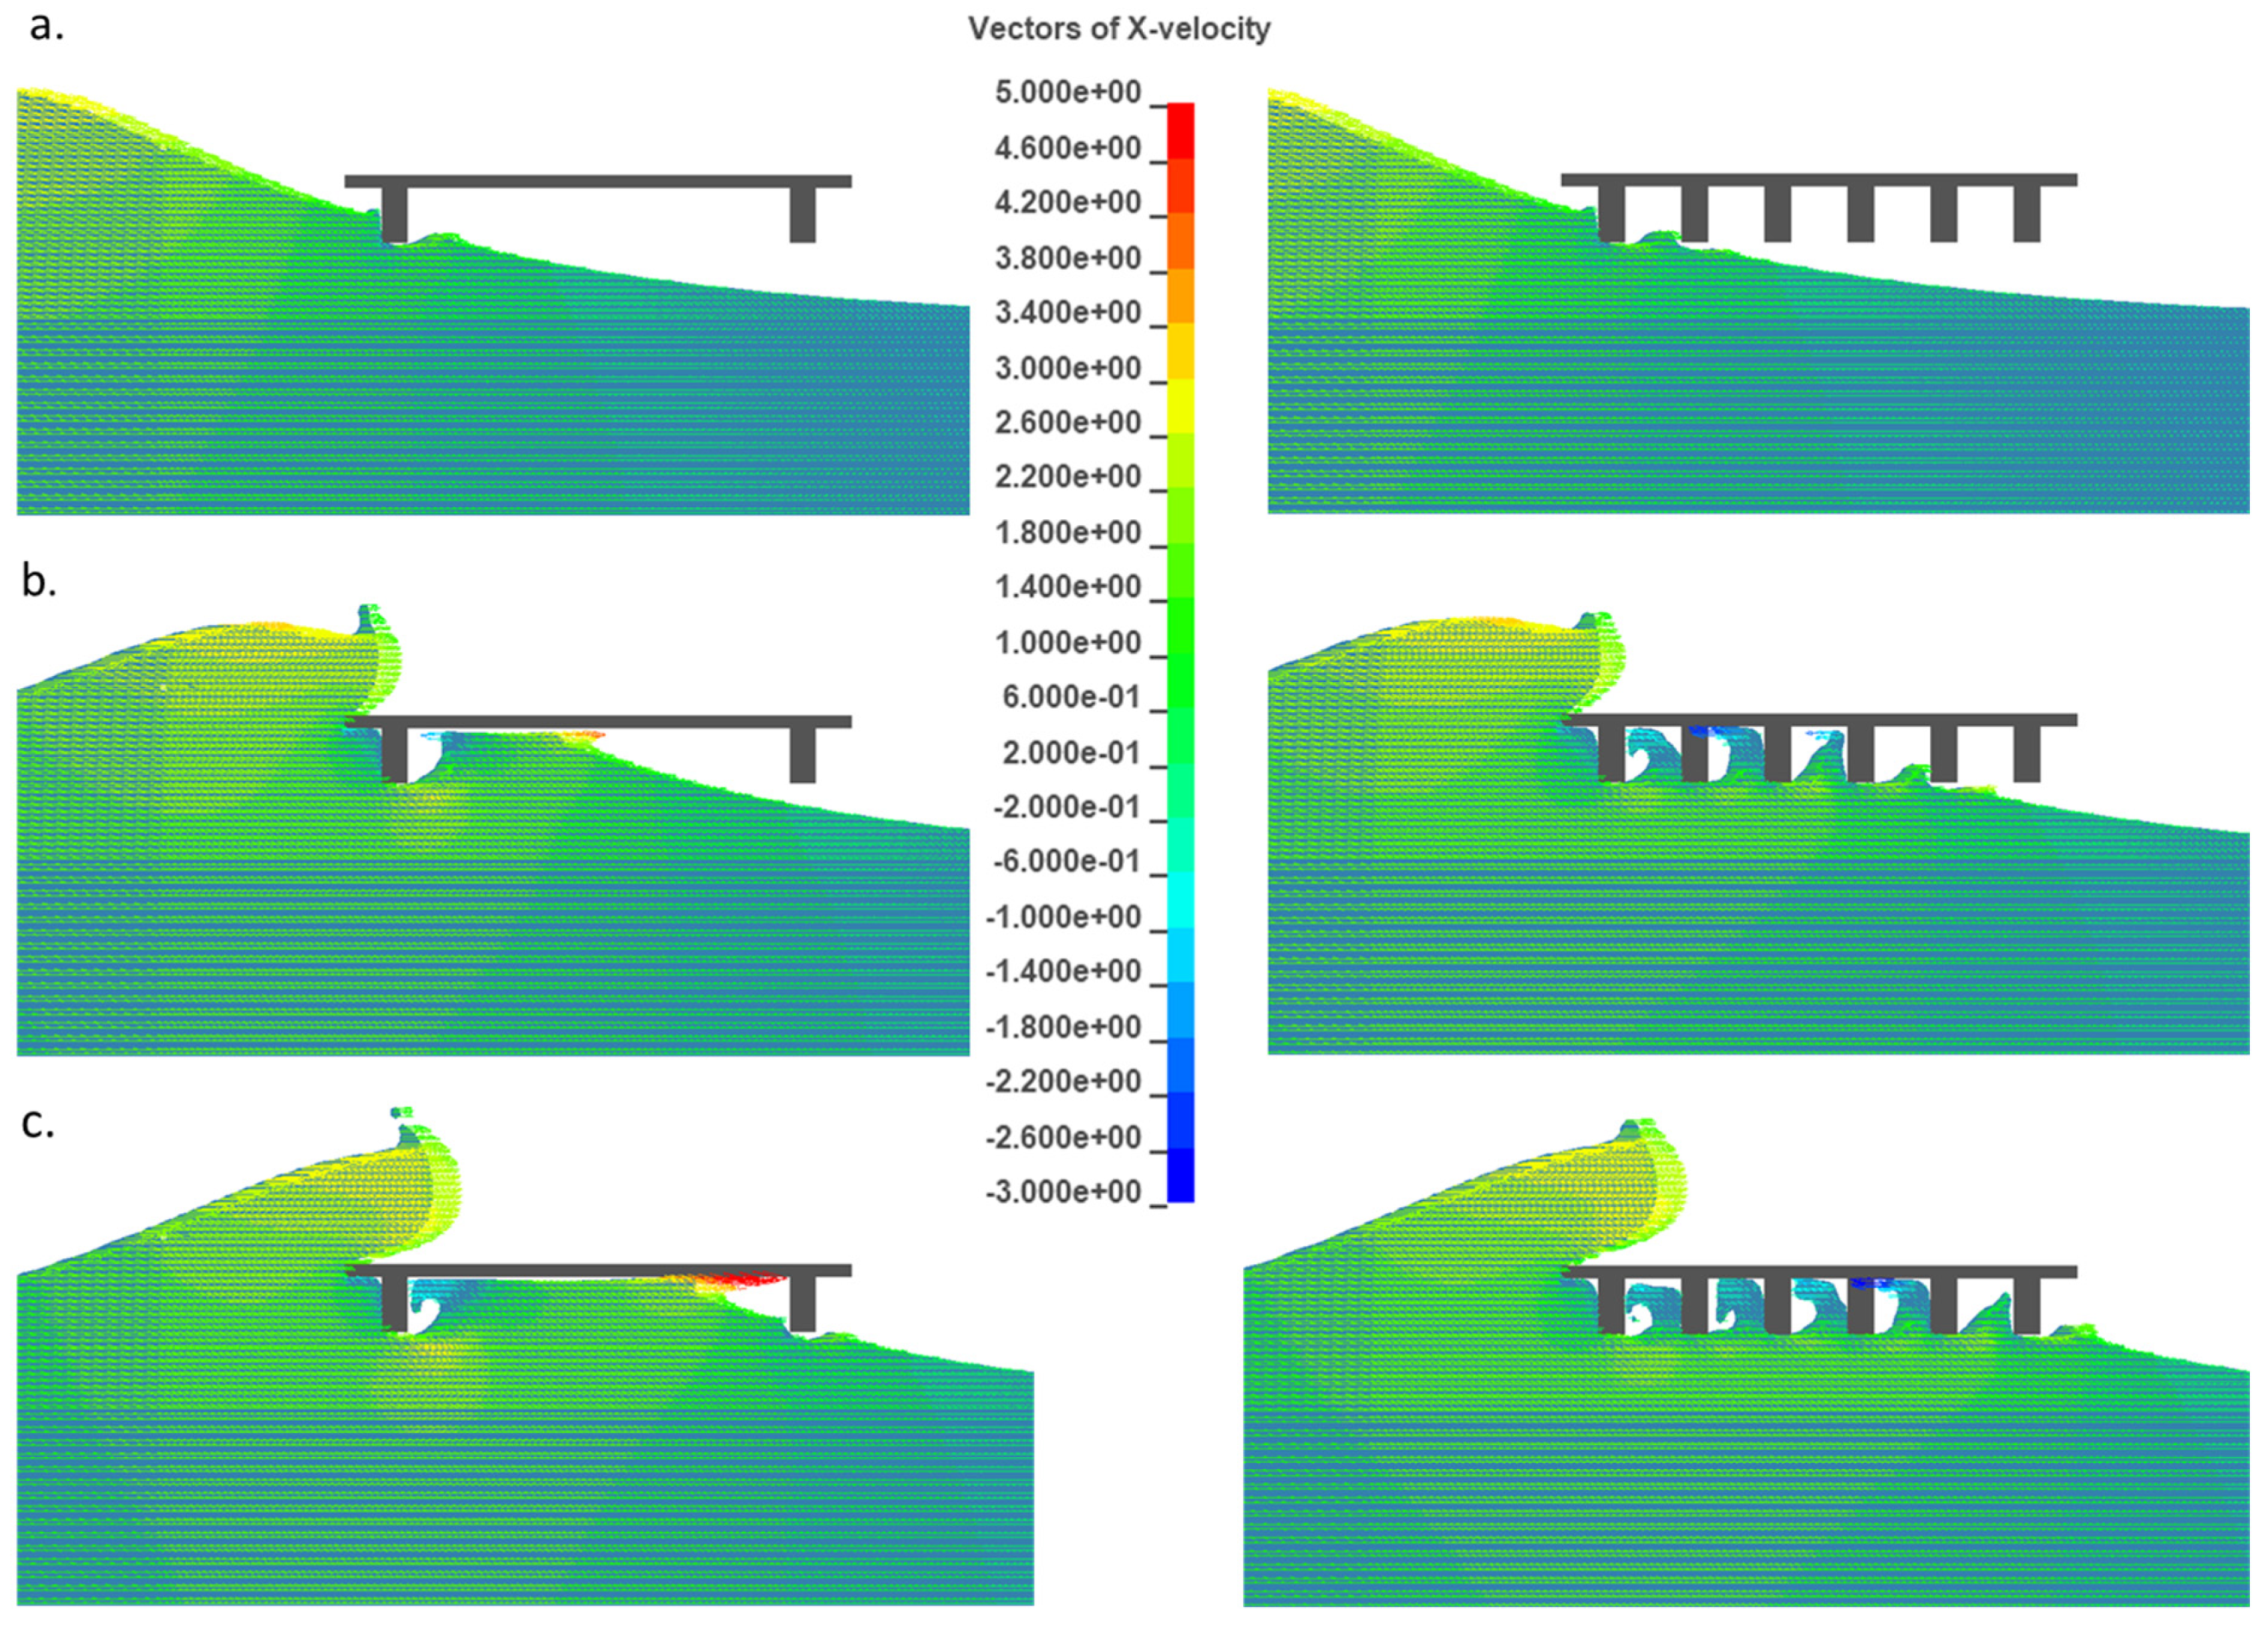
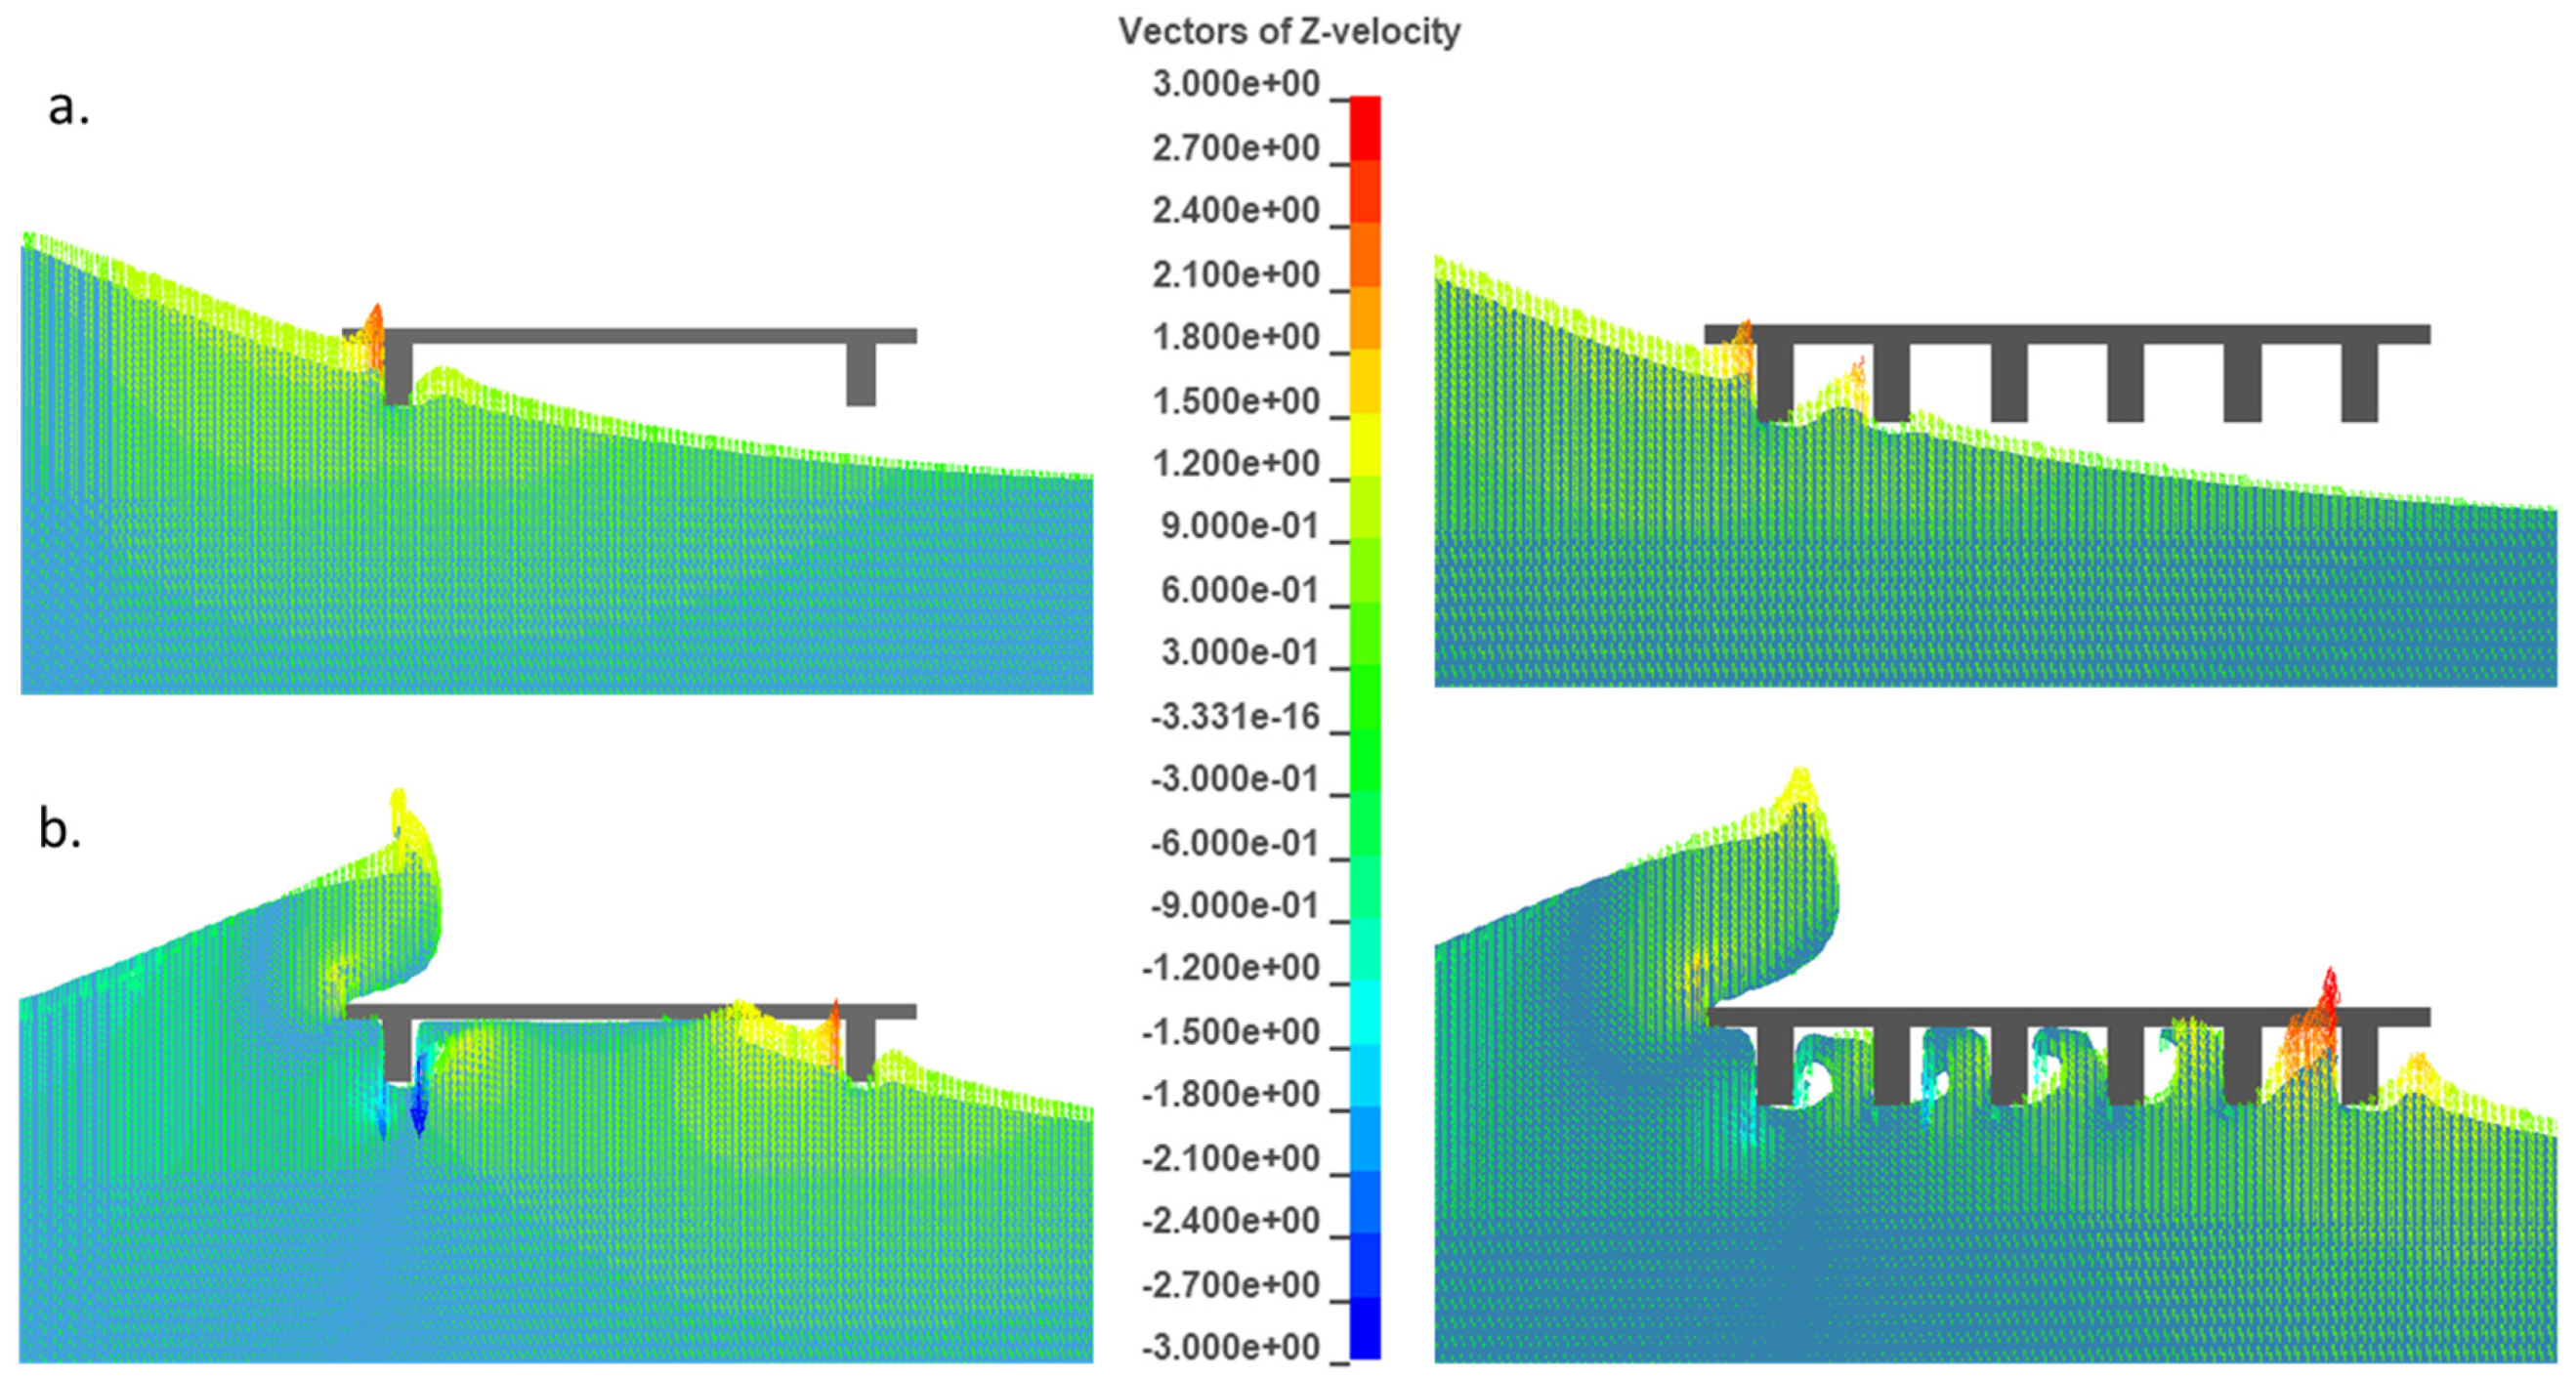
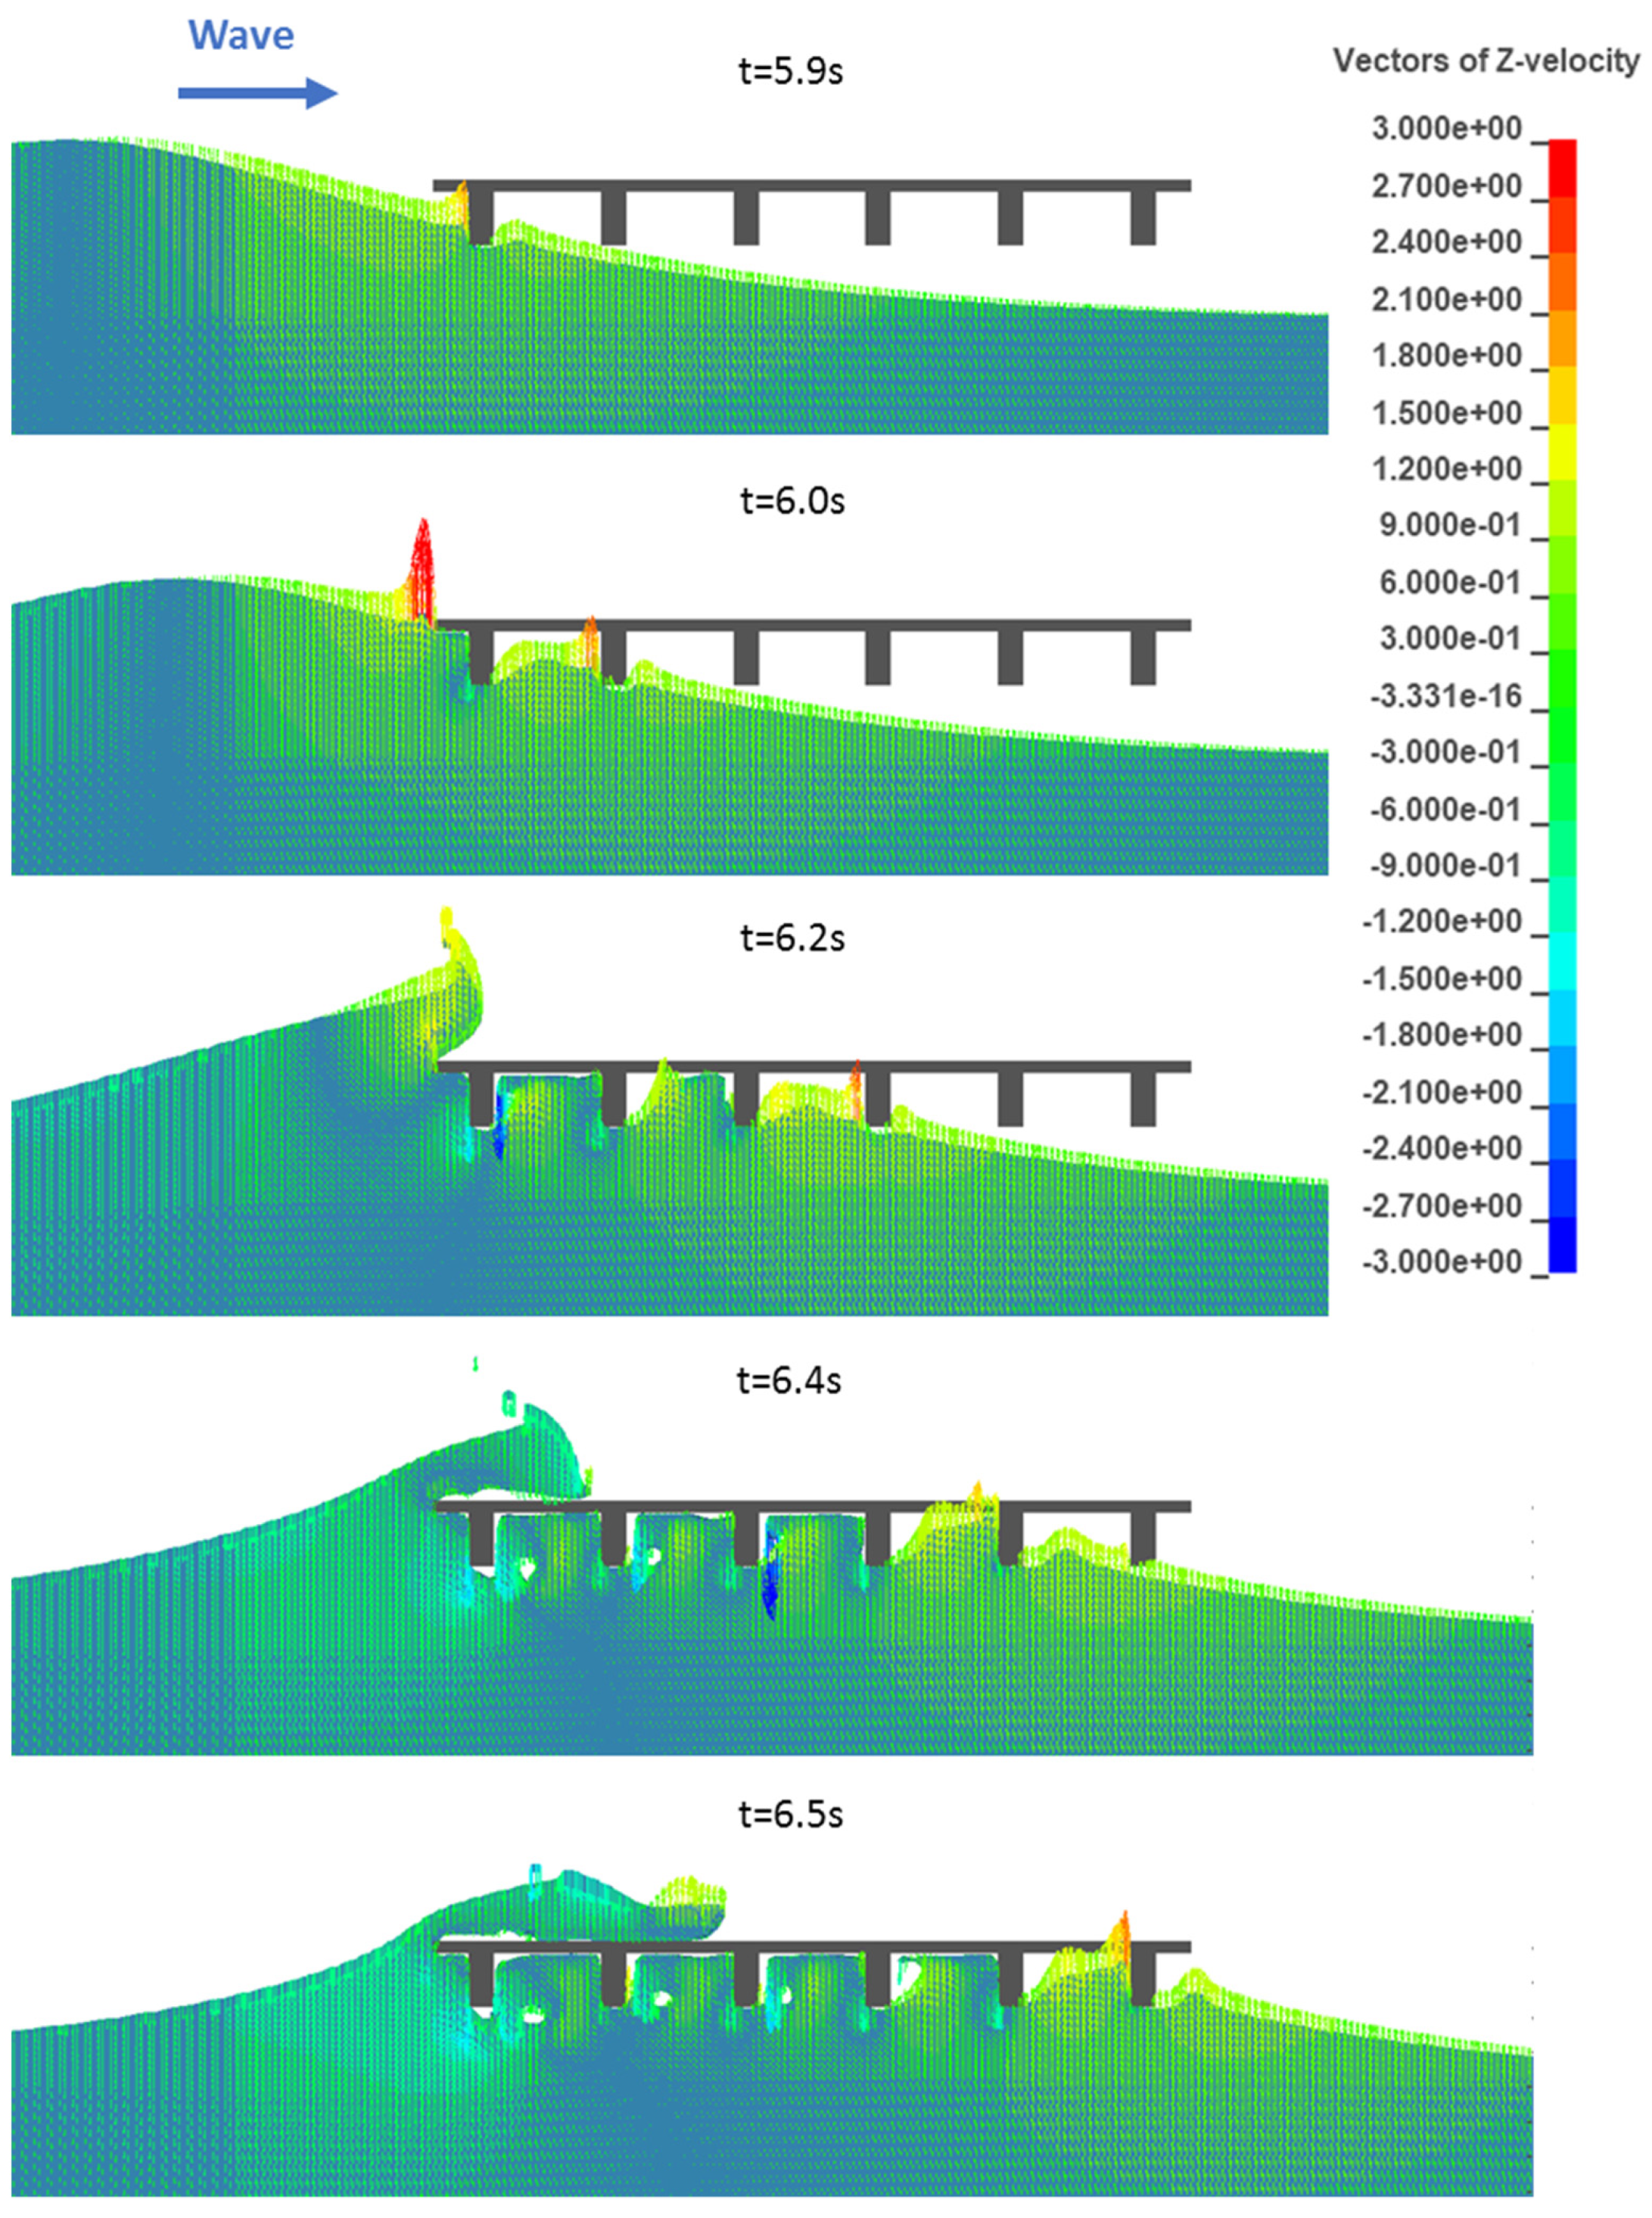
- The main reason for the generation of larger horizontal and uplift forces on the decks with a small Ng (i.e., 2, 3) is the fact that the fluid particles accelerate after the initial impact on the offshore girder and propagate inside a long chamber that allows the fluid to increase its velocity further. This results in a more violent slamming on the onshore girder and deck slab that generates large impulsive pressures and forces. For a large Ng (e.g., 5, 6), the multiple girders and chambers (i) prevent the fluid from accelerating, (ii) cause the formation of unsynchronized eddies in each chamber that dissipate energy, and (iii) result in multiple but smaller loads on the deck due to the out-of-phase application of pressures on the consecutive structural elements.
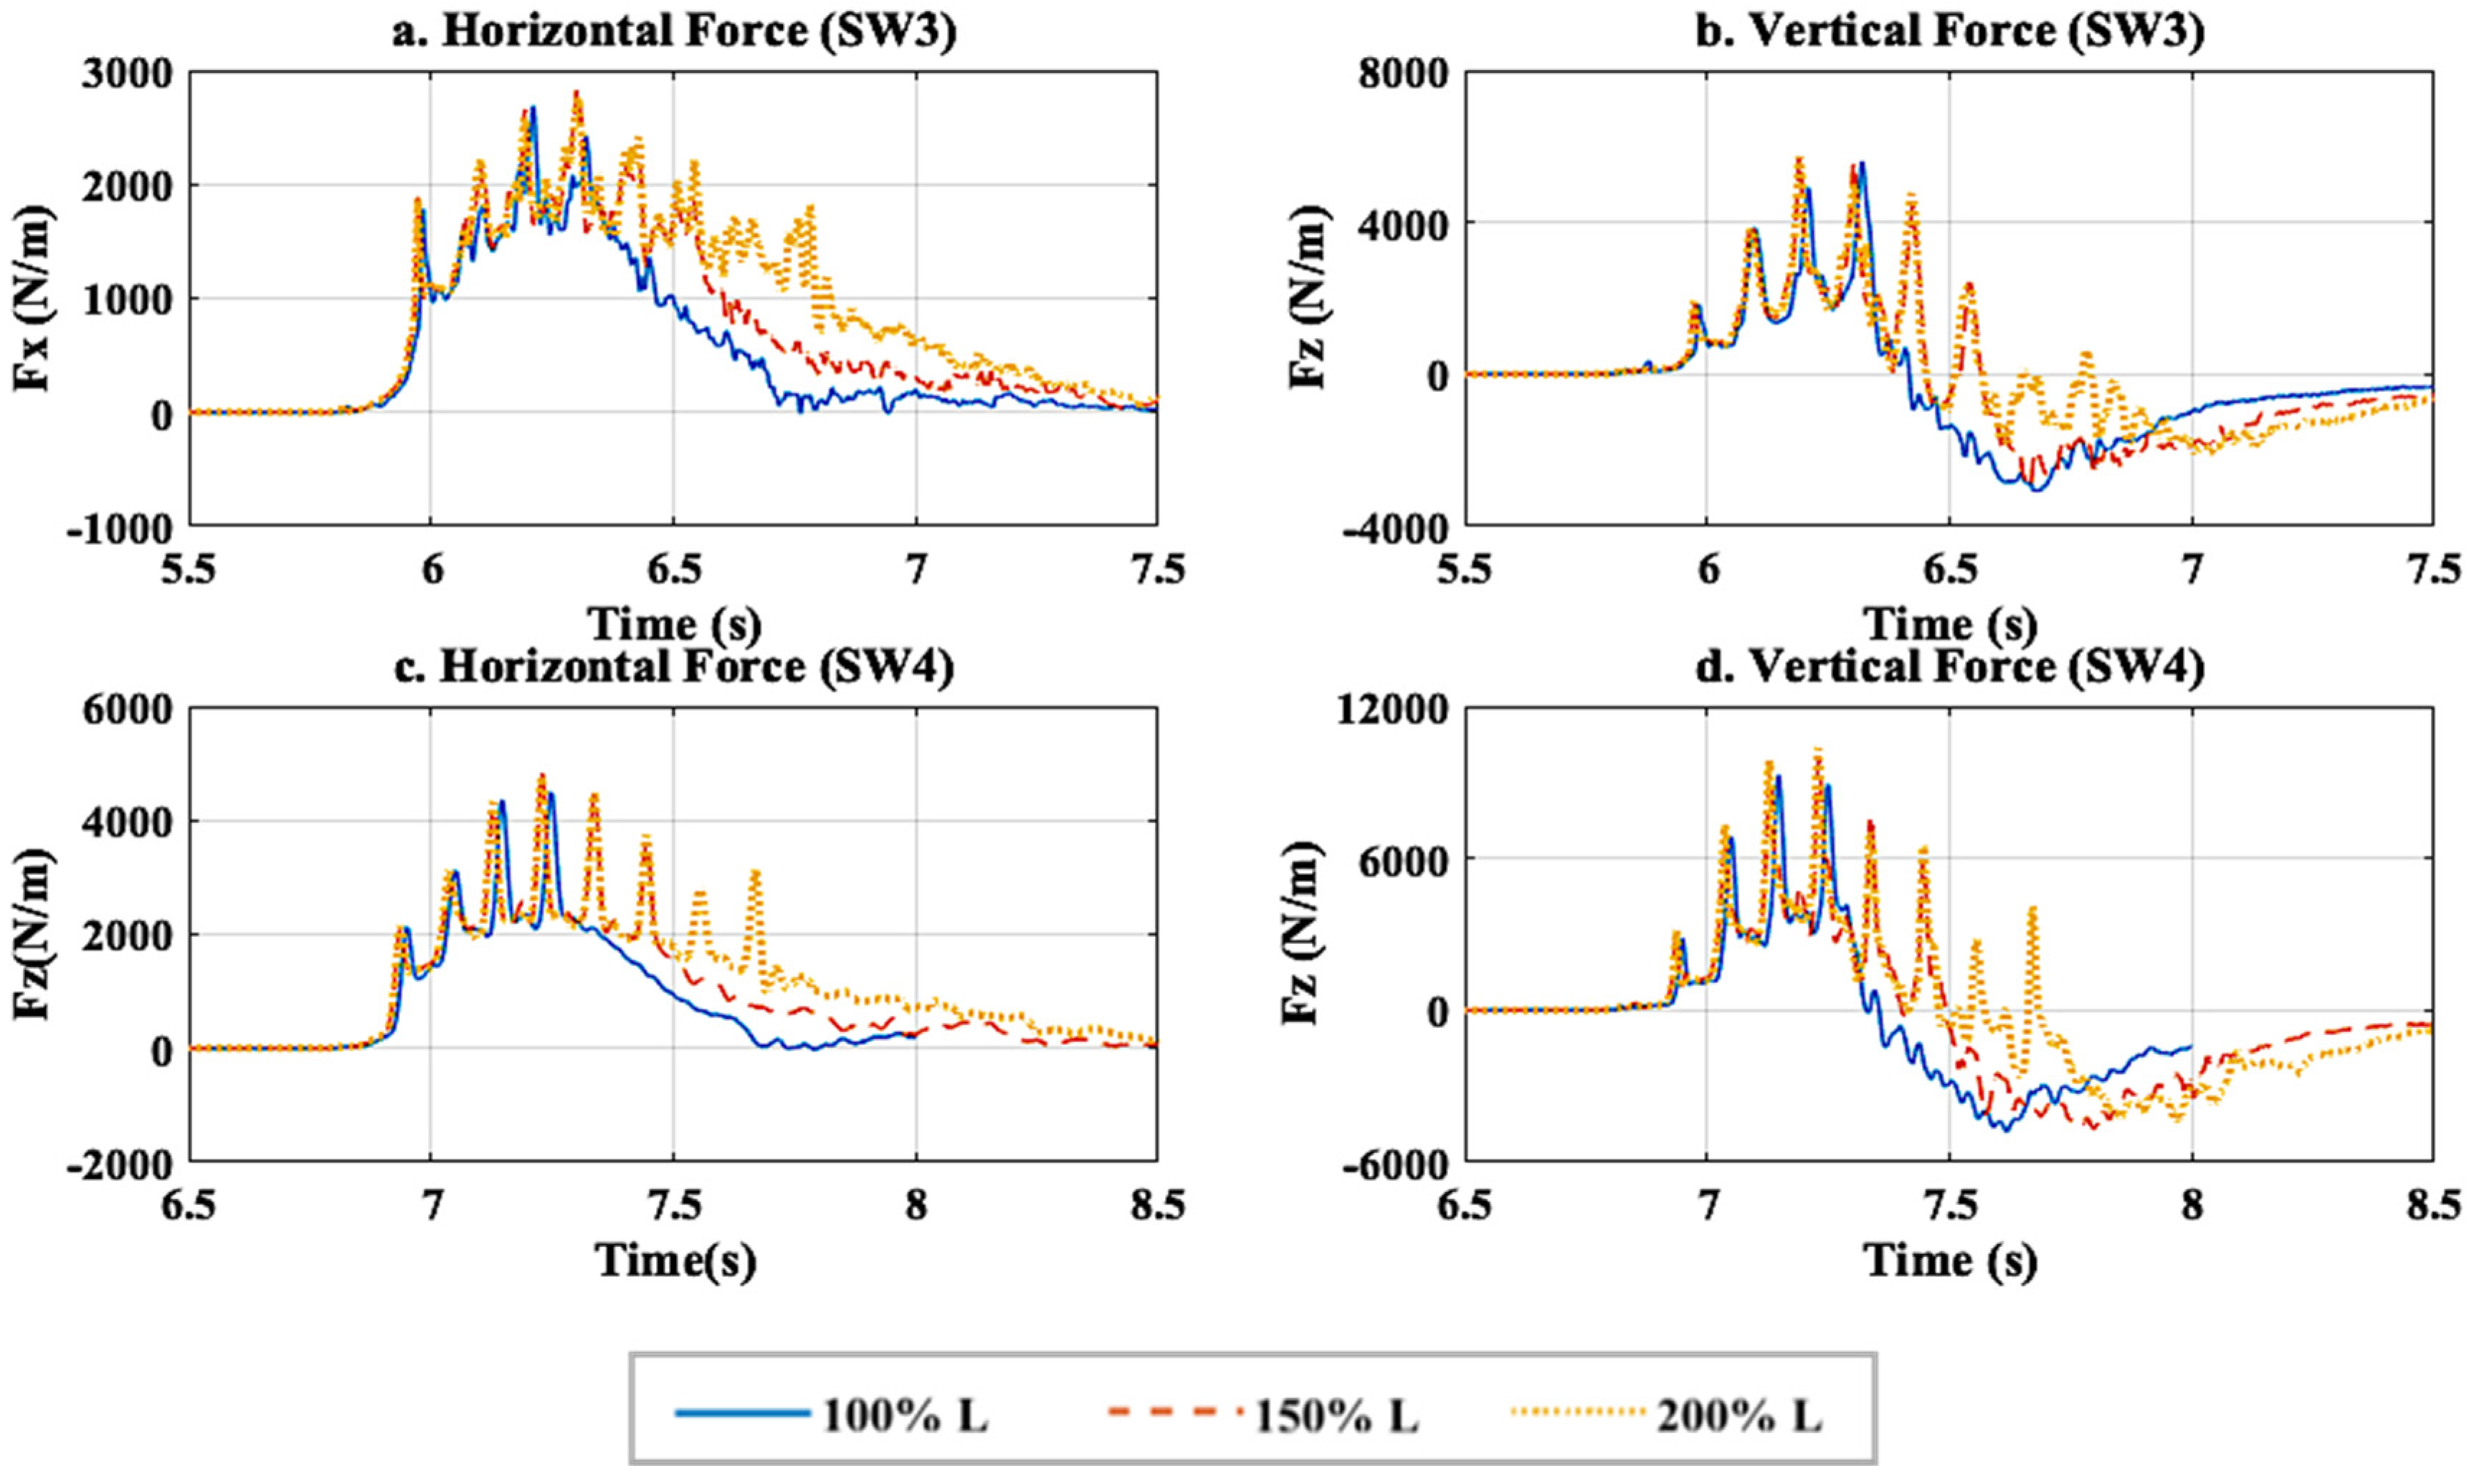
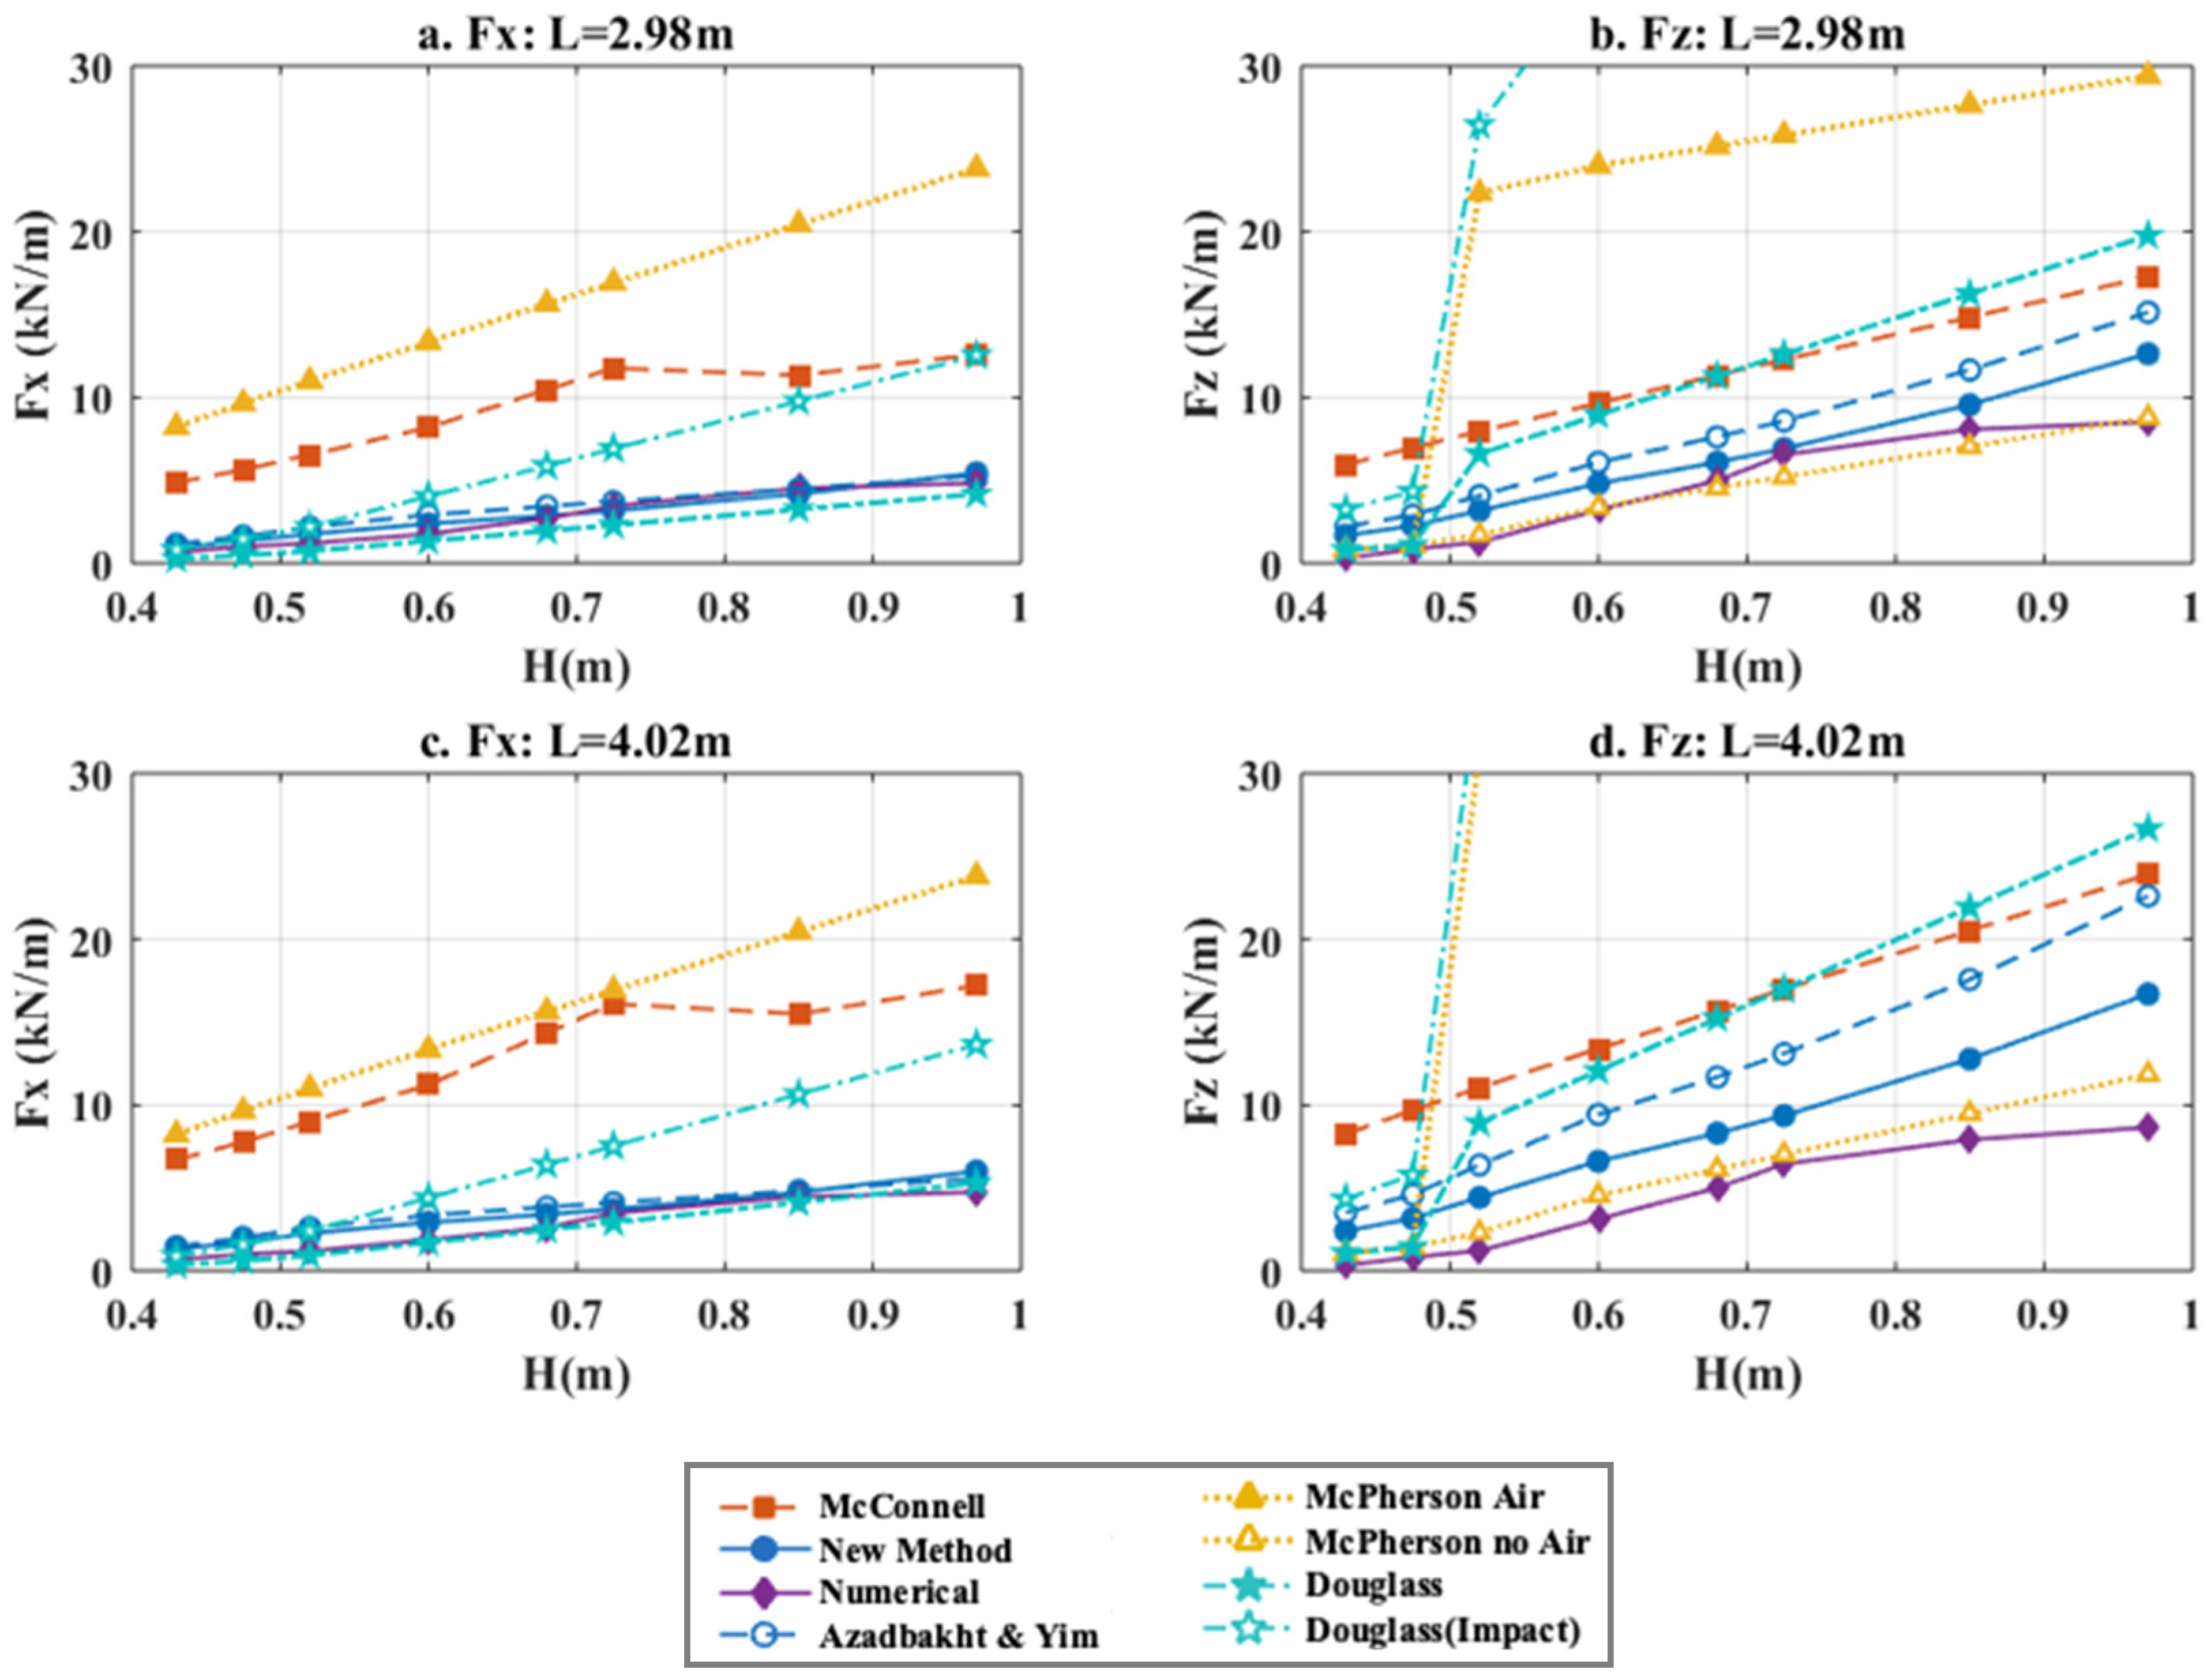
- The increase of the bridge width (from L to 1.5 L and 2 L) increases the number of peaks in the force histories due to the additional girders and chambers, and tends to elongate the inundation process and duration of the applied forces. However, it has a minor-to-negligible effect on the maximum horizontal and uplift force. In the vertical direction, this can be attributed to the fact the maximum uplift tends to occur when the wave has inundated the three chambers (less than 100% L), and after that the wave overtops the deck counter-acting any uplift pressures that might be generated in the additional chambers of the wider decks. Moreover, for very wide decks the wave cannot inundate the whole deck width, meaning that the maximum inundation and respective forces are limited by the wavelength.
Author Contributions
Funding
Institutional Review Board Statement
Informed Consent Statement
Data Availability Statement
Acknowledgments
Conflicts of Interest
Appendix A
References
- Mondal, G.; Rai, D.C. Performance of Harbour Structures in Andaman Islands during 2004 Sumatra earthquake. Eng. Struct. 2008, 30, 174–182. [Google Scholar] [CrossRef]
- Padgett, J.; DesRoches, R.; Nielson, B.; Yashinsky, M.; Kwon, O.S.; Burdette, N.; Tavera, E. Bridge Damage and Repair Costs from Hurricane Katrina. J. Bridge Eng. 2008, 13, 6–14. [Google Scholar] [CrossRef] [Green Version]
- Maruyama, Y.; Kitamura, K.; Yamazaki, F. Estimation of Tsunami-Inundated Areas in Asahi City, Chiba Prefecture, after the 2011 Tohoku-Oki Earthquake. Earthq. Spectra. 2013, 29, S201–S217. [Google Scholar] [CrossRef] [Green Version]
- Maruyama, K.; Tanaka, Y.; Kosa, K.; Hosoda, A.; Arikawa, T. Evaluation of Tsunami Force Acting on Bridge Girders. In Proceedings of the 13th East Asia-Pacific Conference on Structural Engineering and Construction, Sapporo, Japan, 11–13 September 2013. [Google Scholar]
- Williams, J.H.; Wilson, T.M.; Horspool, N.; Paulik, R.; Wotherspoon, L.; Lane, E.M.; Hughes, M.W. Assessing Transportation Vulnerability to Tsunamis: Utilising Post-Event Field Data from the 2011 Tōhoku Tsunami, Japan, and the 2015 Illapel Tsunami, Chile. Nat. Hazards Earth Syst. Sci. 2020, 20, 451–470. [Google Scholar] [CrossRef] [Green Version]
- McConnell, K.; Allsop, W.; Cruickshank, I. Piers, Jetties, and Related Structures Exposed to Waves: Guidelines for Hydraulic Loadings; Thomas Telford Ltd.: London, UK, 2004. [Google Scholar]
- Douglass, S.L.; Chen, Q.; Olsen, J.M.; Edge, B.L.; Brown, D. Wave Forces on Bridge Decks; Department of Transportation, Federal Highway Administration, Office of Bridge Technology: Washington, DC, USA, 2006.
- McPherson, R.L. Hurricane-Induced Wave and Surge Forces on Bridge Decks. Master’s Thesis, Texas A.&M. University, College Station, TX, USA, 2008. [Google Scholar]
- Azadbakht, M.; Yim, S.C. Simulation and Estimation of Tsunami Loads on Bridge Superstructures. J. Waterw. Port Coast. Ocean Eng. 2015, 141, 04014031. [Google Scholar] [CrossRef]
- **ed on Bridge Superstructures. Coast Eng. 2017, 121, 145–157. [Google Scholar] [CrossRef]
- Zhu, M.J.; Elkhetali, I.; Scott, M.H. Validation of OpenSees for Tsunami Loading on Bridge Superstructures. J. Bridge Eng. 2018, 23, 04018015. [Google Scholar] [CrossRef]
- Hasanpour, A.; Istrati, D.; Buckle, I. Coupled SPH–FEM Modeling of Tsunami-Borne Large Debris Flow and Impact on Coastal Structures. J. Mar. Sci. Eng. 2021, 9, 1068. [Google Scholar] [CrossRef]
- Bozorgnia, M.; Lee, J.J. Computational Fluid Dynamic Analysis of Highway Bridges Exposed to Hurricane Waves. In Proceedings of the 33rd Conference on Coastal Engineering, Santander, Spain, 1–6 July 2012; Coastal Engineering Research Council, ASCE: Reston, VA, USA, 2012. [Google Scholar] [CrossRef] [Green Version]
- Crowley, R.; Robeck, C.; Dompe, P. A Three-Dimensional Computational Analysis of Bridges Subjected to Monochromatic Wave Attack. J. Fluids Struct. 2018, 79, 76–93. [Google Scholar] [CrossRef]
- Istrati, D.; Buckle, I.; Lomonaco, P.; Yim, S.; Itani, A. Tsunami Induced Forces in Bridges: Large-Scale Experiments and the Role of Air-Entrapment. Coast. Eng. Proc. 2017, 35, 30. [Google Scholar] [CrossRef] [Green Version]
- Motley, M.R.; Wong, H.K.; Qin, X.; Winter, A.O.; Eberhard, M.O. Tsunami-Induced Forces on Skewed Bridges. J. Waterw. Port Coast. Ocean. Eng. 2016, 142, 04015025. [Google Scholar] [CrossRef]
- Istrati, D.; Buckle, I. Tsunami Loads on Straight and Skewed Bridges—Part 1: Experimental Investigation and Design Recommendations, No. FHWA-OR-RD-21-12; Oregon Department of Transportation. Research Section: Salem, OR, USA, 2021. Available online: https://rosap.ntl.bts.gov/view/dot/55988 (accessed on 1 June 2021).
- Istrati, D.; Buckle, I. Tsunami Loads on Straight and Skewed Bridges—Part 2: Numerical Investigation and Design Recommendations, No. FHWA-OR-RD-21-13; Oregon Department of Transportation. Research Section: Salem, OR, USA, 2021. Available online: https://rosap.ntl.bts.gov/view/dot/55947 (accessed on 1 June 2021).
- Istrati, D.; Hasanpour, A.; Buckle, I. Numerical Investigation of Tsunami-Borne Debris Damming Loads on a Coastal Bridge. In Proceedings of the 17th World Conference of Earthquake Engineering, Sendai, Japan, 27 September–2 October 2021. [Google Scholar]
- Hayatdavoodi, M.; Seiffert, B.; Ertekin, R.C. Experiments and Computations of Solitary-Wave Forces on a Coastal-Bridge Deck. Part II: Deck with Girders. Coast. Eng. 2014, 88, 210–228. [Google Scholar] [CrossRef]
- Moideen, R.; Behera, M.R.; Kamath, A.; Bihs, H. Effect of Girder Spacing and Depth on the Solitary Wave Impact on Coastal Bridge Deck for Different Airgaps. J. Mar. Sci. Eng. 2019, 7, 140. [Google Scholar] [CrossRef] [Green Version]
- Hallquist, J.O. LS-DYNA Theory Manual. Liverm. Softw. Technol. Corp. 2006, 3, 25–31. [Google Scholar]
- Souli, M.; Benson, D.J. Arbitrary Lagrangian Eulerian and Fluid-Structure Interaction: Numerical Simulation; John Wiley & Sons: Hoboken, NJ, USA, 2013. [Google Scholar]
- Takahashi, S.; Tanimoto, K.; Miyanaga, S. Uplift Wave Forces due to Compression of Enclosed Air Layer and Their Similitude Low. Coast. Eng. Jpn. 1985, 28, 191–206. [Google Scholar] [CrossRef]
- Cuomo, G.; Shimosako, K.I.; Takahashi, S. Wave-in-Deck Loads on Coastal Bridges and the Role of Air. Coast. Eng. 2009, 56, 793–809. [Google Scholar] [CrossRef]
- Hayatdavoodi, M.; Treichel, K.; Ertekin, R.C. Parametric study of Nonlinear Wave Loads on Submerged Decks in Shallow Water. J. Fluids Struct. 2019, 86, 266–289. [Google Scholar] [CrossRef]
- Goring, D.G. Tsunamis-The Propagation of Long Waves on to a Shelf. Ph.D. Thesis, California Institute of Technology, Pasadena, CA, USA, 1979. [Google Scholar]
- AASHTO. LRFD Bridge Design Specifications, 8th ed.; American Association of State Highway and Transportation Officials (AASHTO): Washington, DC, USA, 2007. [Google Scholar]
- Istrati, D.; Buckle, I.; Lomonaco, P.; Yim, S.; Itani, A. Large-Scale Experiments of Tsunami Impact Forces on Bridges: The Role of Fluid-Structure Interaction and Air-Venting. In Proceedings of the 26th International Ocean and Polar Engineering Conference, Rhodes, Greece, 26 June–1 July 2016. [Google Scholar]


| Comparison A (L = 1.94 m) | Comparison B | |
|---|---|---|
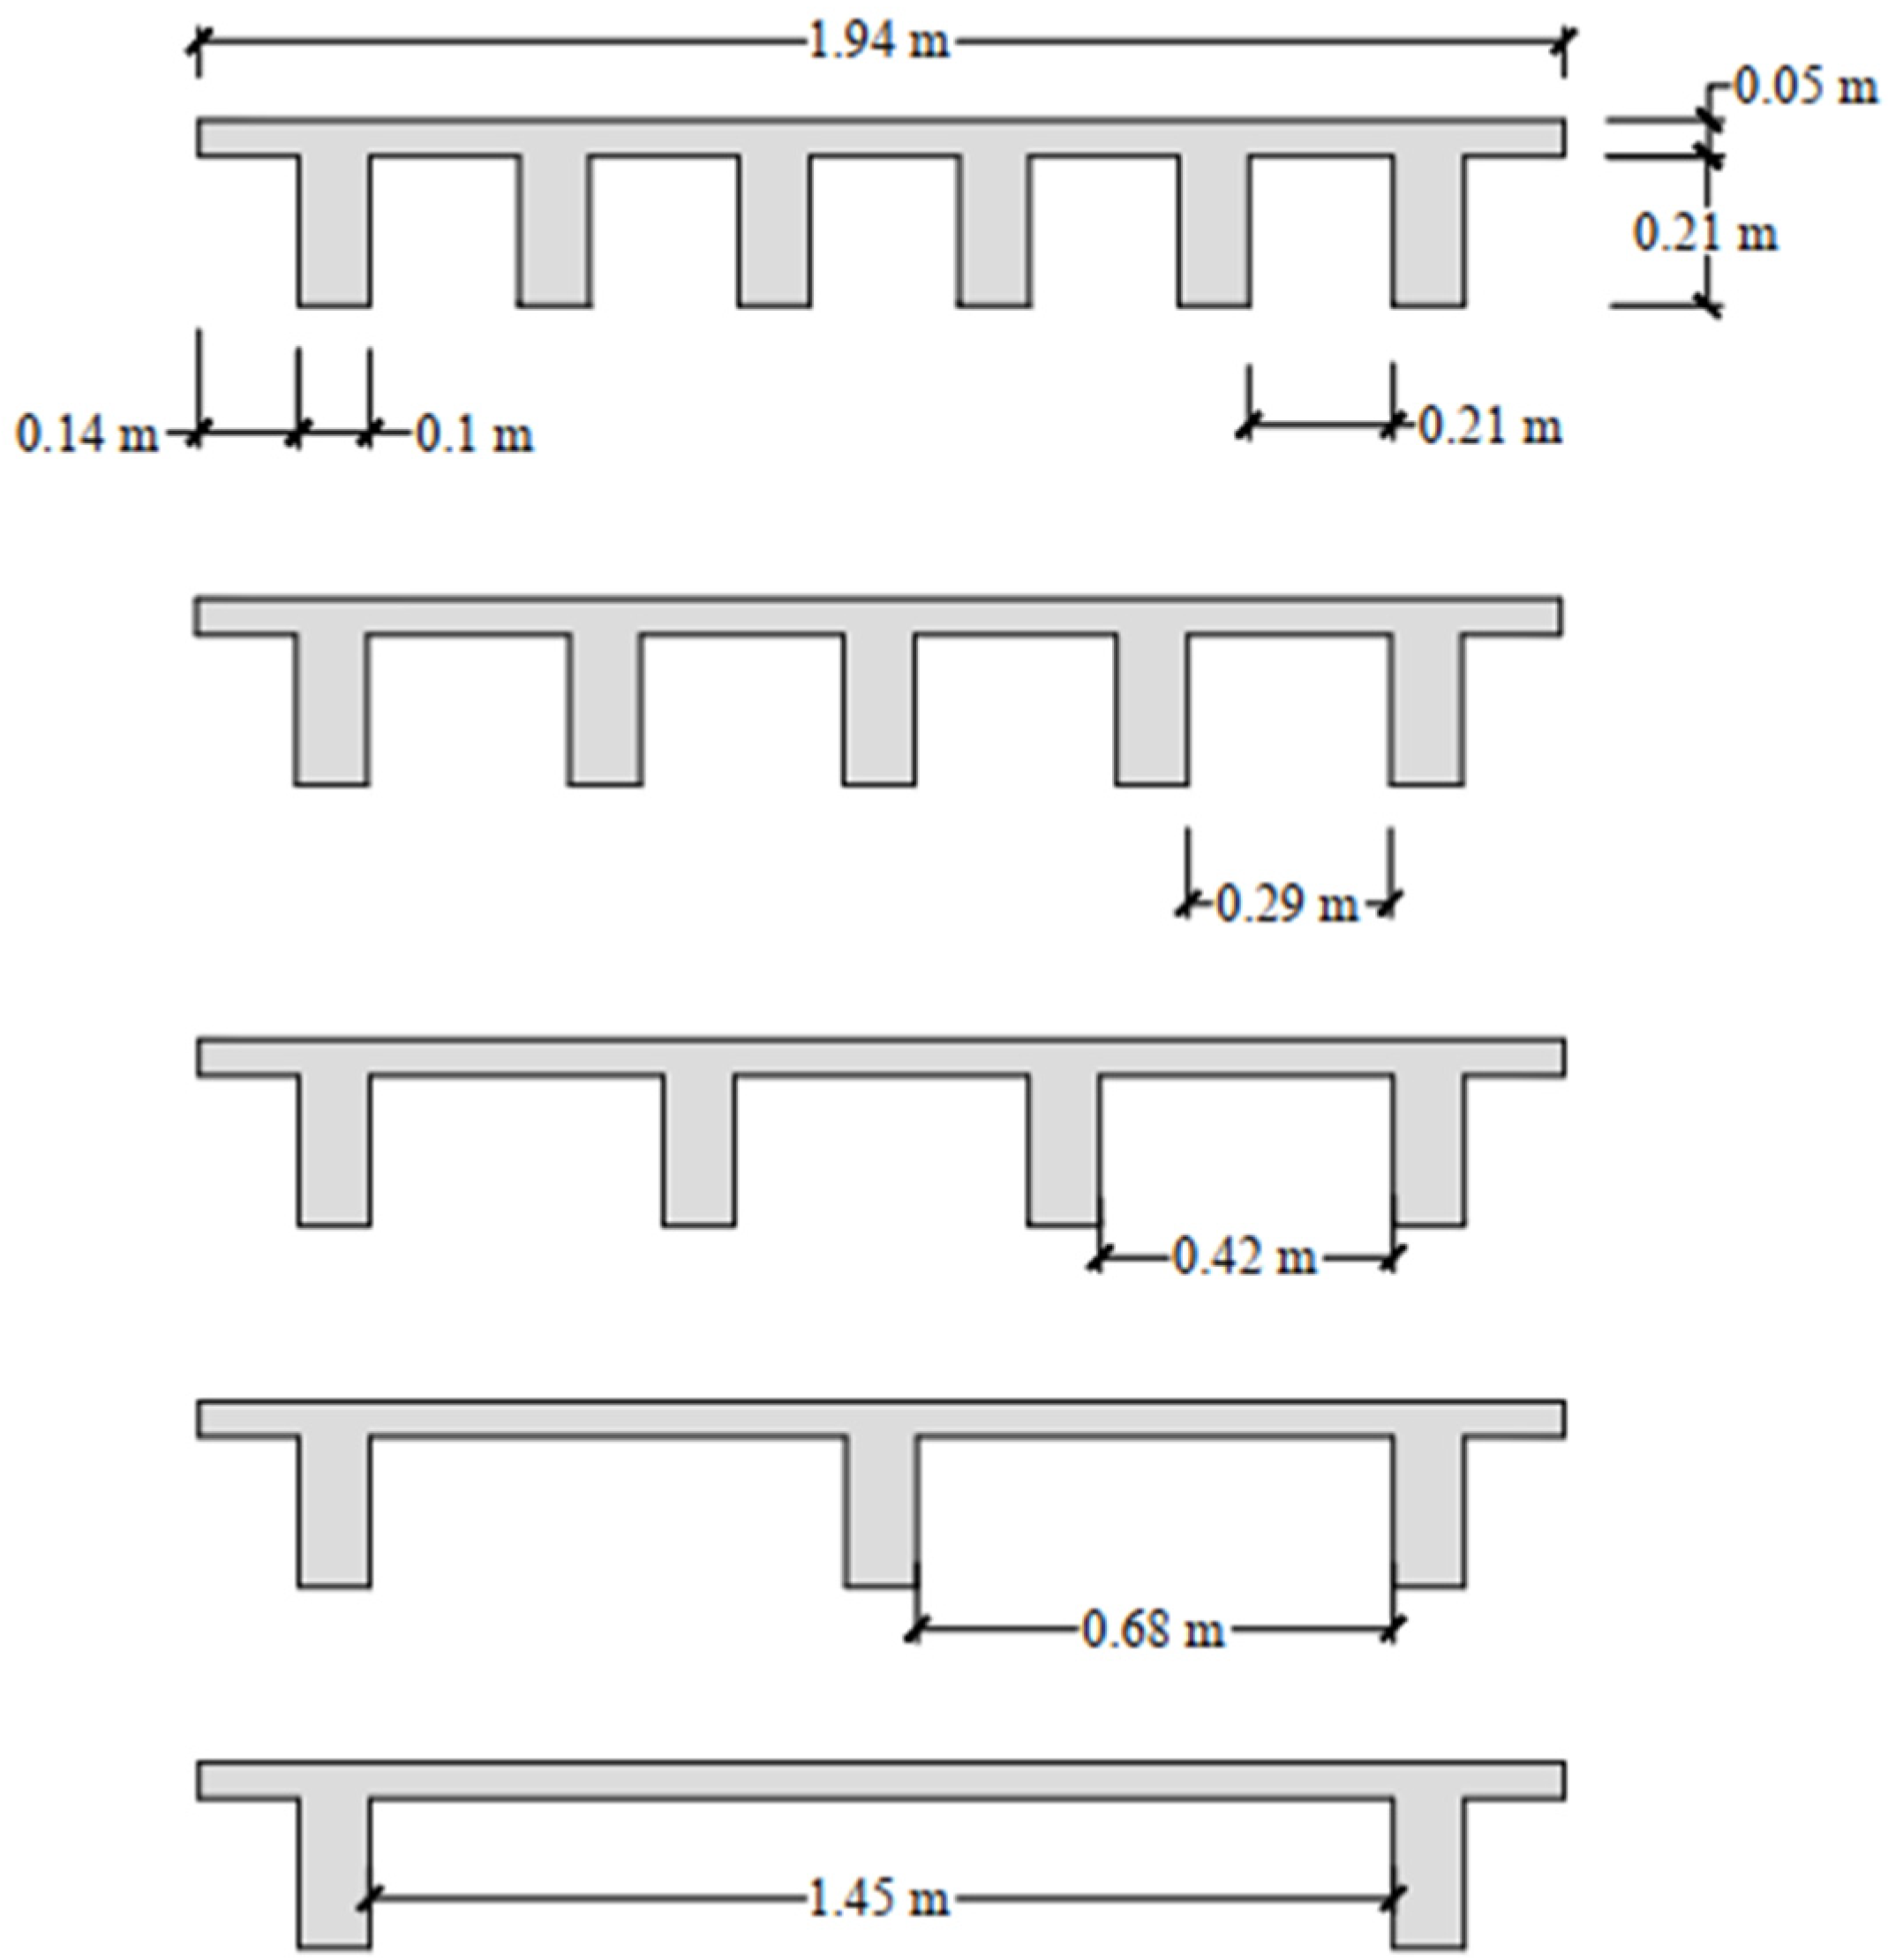
| Number of Girders (Ng) | Girder Spacing S (m) | Bridge Width L |
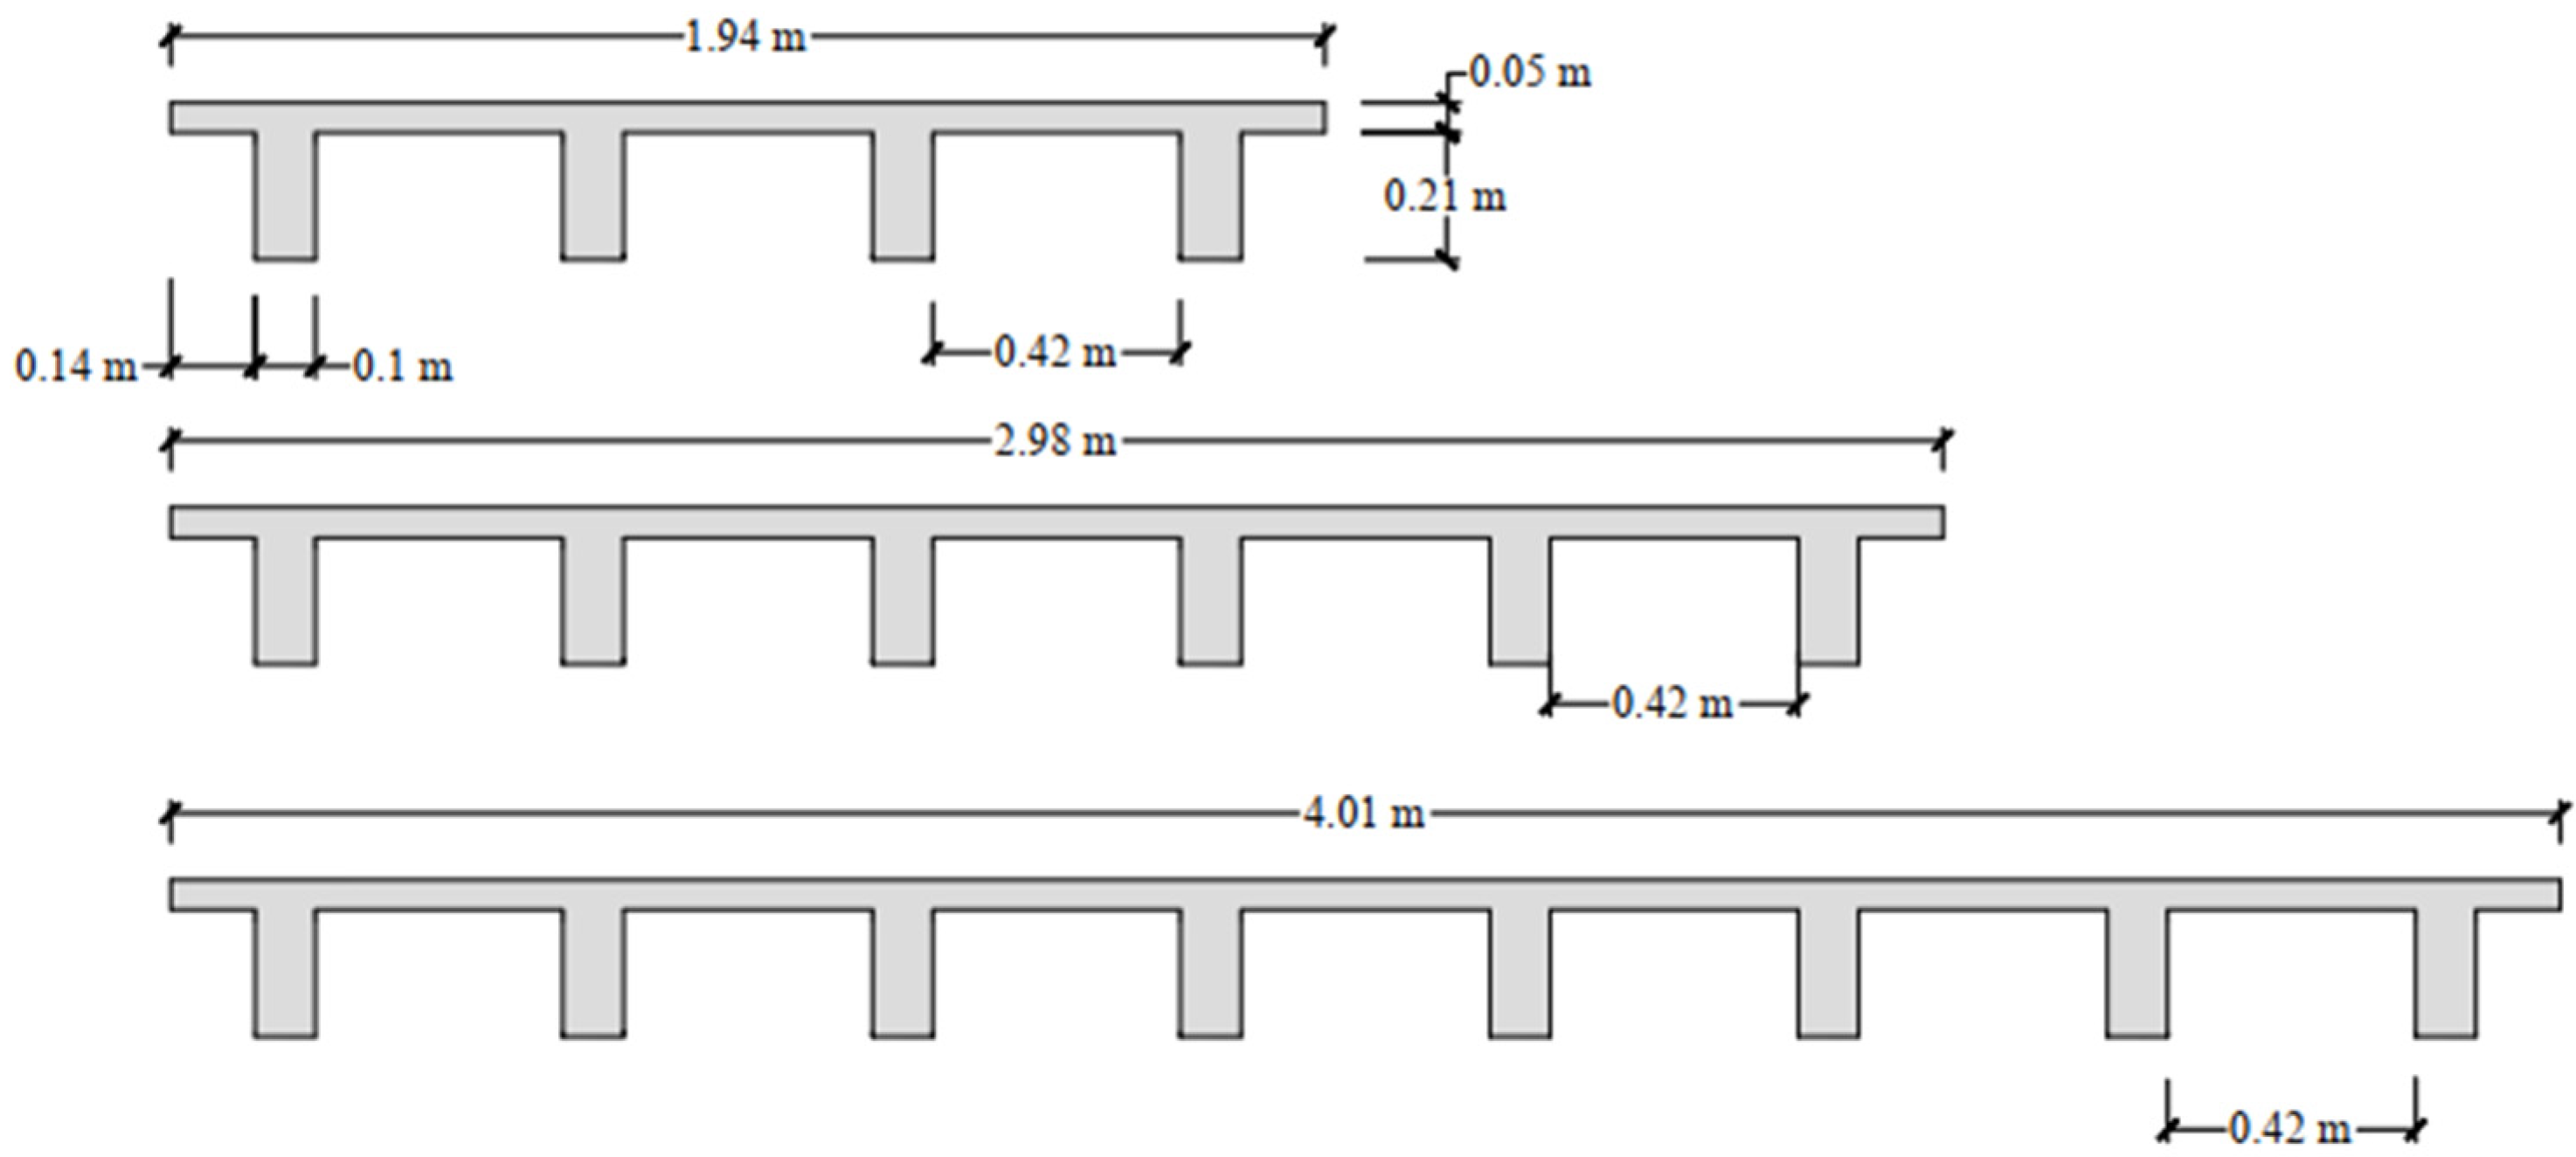
| 2 | 1.46 | = 1.94 m) |
| 3 | 0.68 | = 2.97 m) |
| 4 | 0.42 | = 4.01 m) |
| 5 | 0.29 | |
| 6 | 0.21 | |
| Case # | Impact Wave Height H (m) | Normalized Wave Height (H/h) |
|---|---|---|
| SW1 | 0.430 | 0.37 |
| SW1.5 | 0.475 | 0.41 |
| SW2 | 0.520 | 0.45 |
| SW2.5 | 0.600 | 0.52 |
| SW3 | 0.680 | 0.59 |
| SW3.3 | 0.725 | 0.63 |
| SW3.6 | 0.850 | 0.73 |
| SW4 | 0.970 | 0.84 |
Publisher’s Note: MDPI stays neutral with regard to jurisdictional claims in published maps and institutional affiliations. |
© 2021 by the authors. Licensee MDPI, Basel, Switzerland. This article is an open access article distributed under the terms and conditions of the Creative Commons Attribution (CC BY) license (https://creativecommons.org/licenses/by/4.0/).
Share and Cite
**ang, T.; Istrati, D. Assessment of Extreme Wave Impact on Coastal Decks with Different Geometries via the Arbitrary Lagrangian-Eulerian Method. J. Mar. Sci. Eng. 2021, 9, 1342. https://doi.org/10.3390/jmse9121342
**ang T, Istrati D. Assessment of Extreme Wave Impact on Coastal Decks with Different Geometries via the Arbitrary Lagrangian-Eulerian Method. Journal of Marine Science and Engineering. 2021; 9(12):1342. https://doi.org/10.3390/jmse9121342
Chicago/Turabian Style**ang, Tao, and Denis Istrati. 2021. "Assessment of Extreme Wave Impact on Coastal Decks with Different Geometries via the Arbitrary Lagrangian-Eulerian Method" Journal of Marine Science and Engineering 9, no. 12: 1342. https://doi.org/10.3390/jmse9121342