3.1. Structural and Morphological Characterization of the Nd3+-Activated LaPO4 Nanocrystals
Both LaPO
4 and NdPO
4 crystallize in a monazite structure type with monoclinic crystal system and space group
P2
1/
n (no. 14) [
60,
61]. Only one crystallographically independent La
3+ or Nd
3+ site on the Wyckoff position 4
e are present in both unit cells, respectively. Given the only slightly smaller ionic radius of Nd
3+ (1.163 Å for nine-fold coordination) compared to that of La
3+ (1.216 Å for nine-fold coordination) [
62], a full range of solubility of NdPO
4 within the LaPO
4 host is expected. Synthesis of the solid solutions La
1−xNd
xPO
4 by a co-precipitation approach instead conventional heterogeneous mixing and subsequent thermal annealing permits a more random distribution of the Nd
3+ activators substituting for the La
3+ ions, as has also been recently independently established by solid state magic angle spinning nuclear magnetic resonance (MAS-NMR) experiments on the
31P nuclei in lanthanide-activated LaPO
4, whose resonances sensitively react on paramagnetic impurities in their close environment [
63,
64,
65].
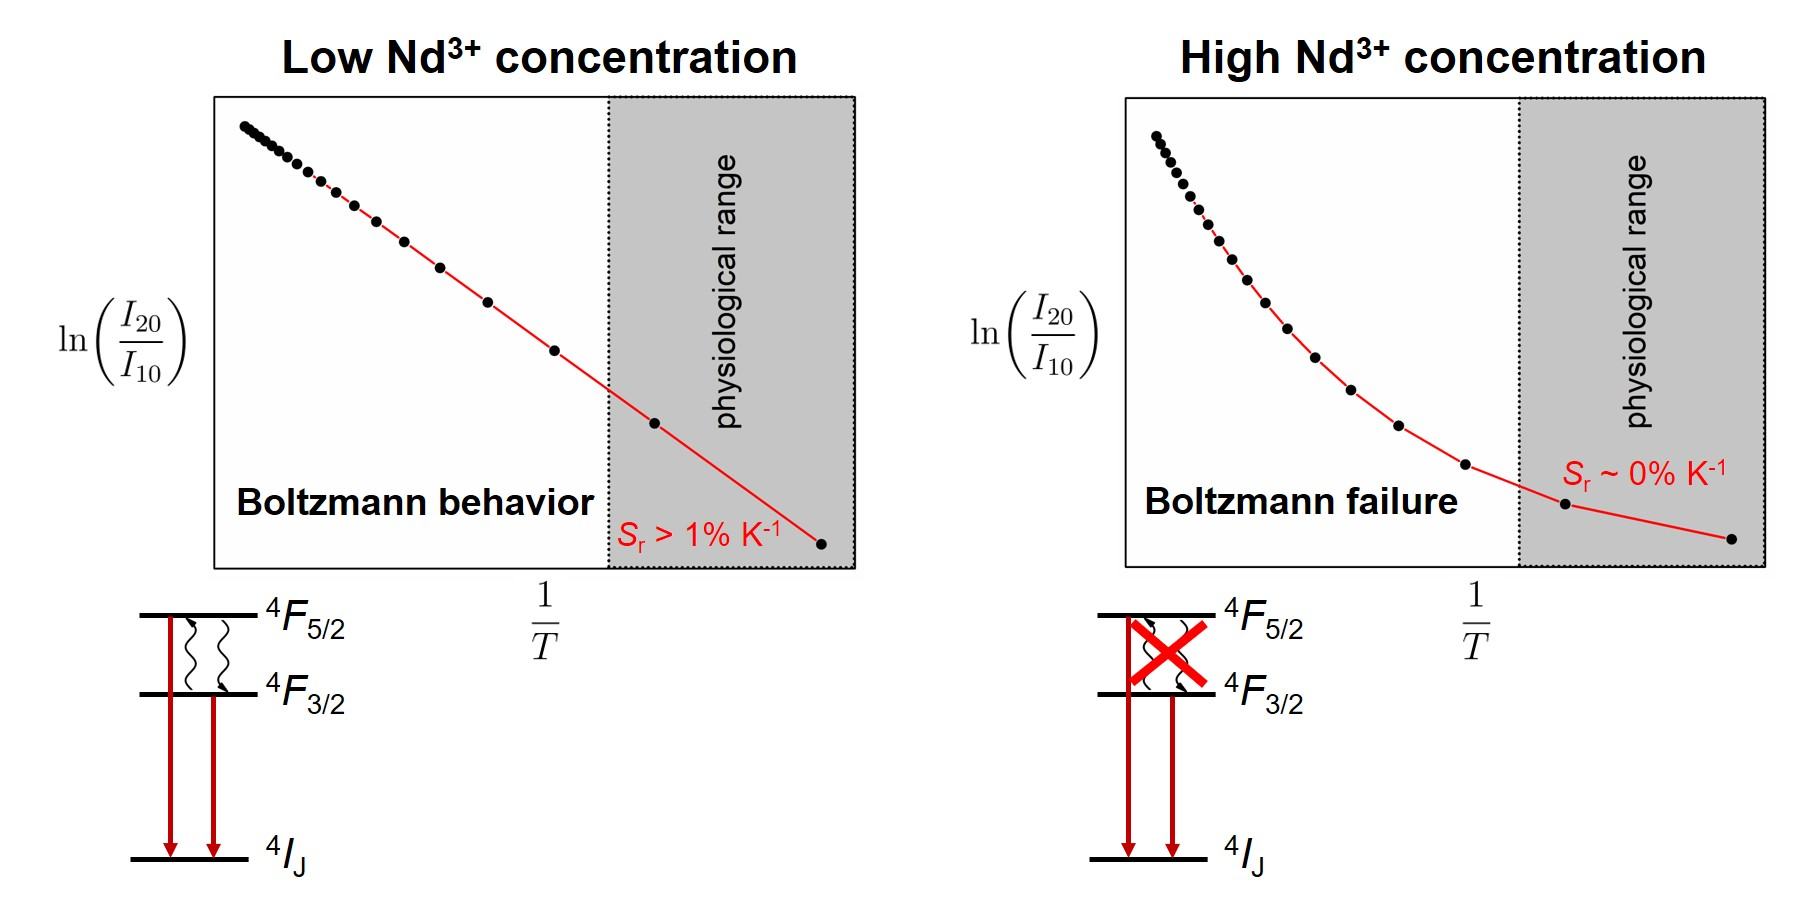
Figure 1a depicts the XRPD patterns of the Nd
3+-activated LaPO
4 nanocrystals as prepared by the hydrothermal co-precipitation approach. The broad background in the low 2
θ regime as well as the low intensities and large widths of most Bragg reflections already indicate a small average crystallite size of the particles. Rietveld refinement of the X-ray diffraction patterns employing the monazite structure type as structural input [
60,
61], affords estimated average crystallite sizes between 6 nm and 10 nm (see
Table 1). The small
R factors below 10% and the goodness of fit (G.o.f.) parameter close to 1 indicate a very good agreement between the theoretically expected powder diffraction pattern according to the structural input of the monazite-type phases and the experimentally measured diffraction patterns (see
Table 1). Moreover, the resulting strain percentage within the nanocrystals is close to 0%, which reflects the miscibility of the two constituents LaPO
4 and NdPO
4 in the solid solution.
Additional evidence for the homogeneous distribution of the Nd
3+ ions substituting for the La
3+ sites in LaPO
4 is given by observation of a gradual shift of the Bragg reflections towards higher values of 2
θ with increasing Nd
3+ content in the nanocrystals (see
Figure 1b). The microcrystalline sample was separated from that analysis since the well-defined reflections in that particular case merge together upon particle-size induced broadening of the Bragg reflections in the nanocrystals.
This effect leads to artificial shifts to yet lower Bragg angles despite an increase of the Nd
3+ content from
x = 0.001 to
x = 0.02. Accordingly, the resulting cell volume as obtained from the Rietveld refinement also gradually decreases with higher Nd
3+ content (see
Table 1).
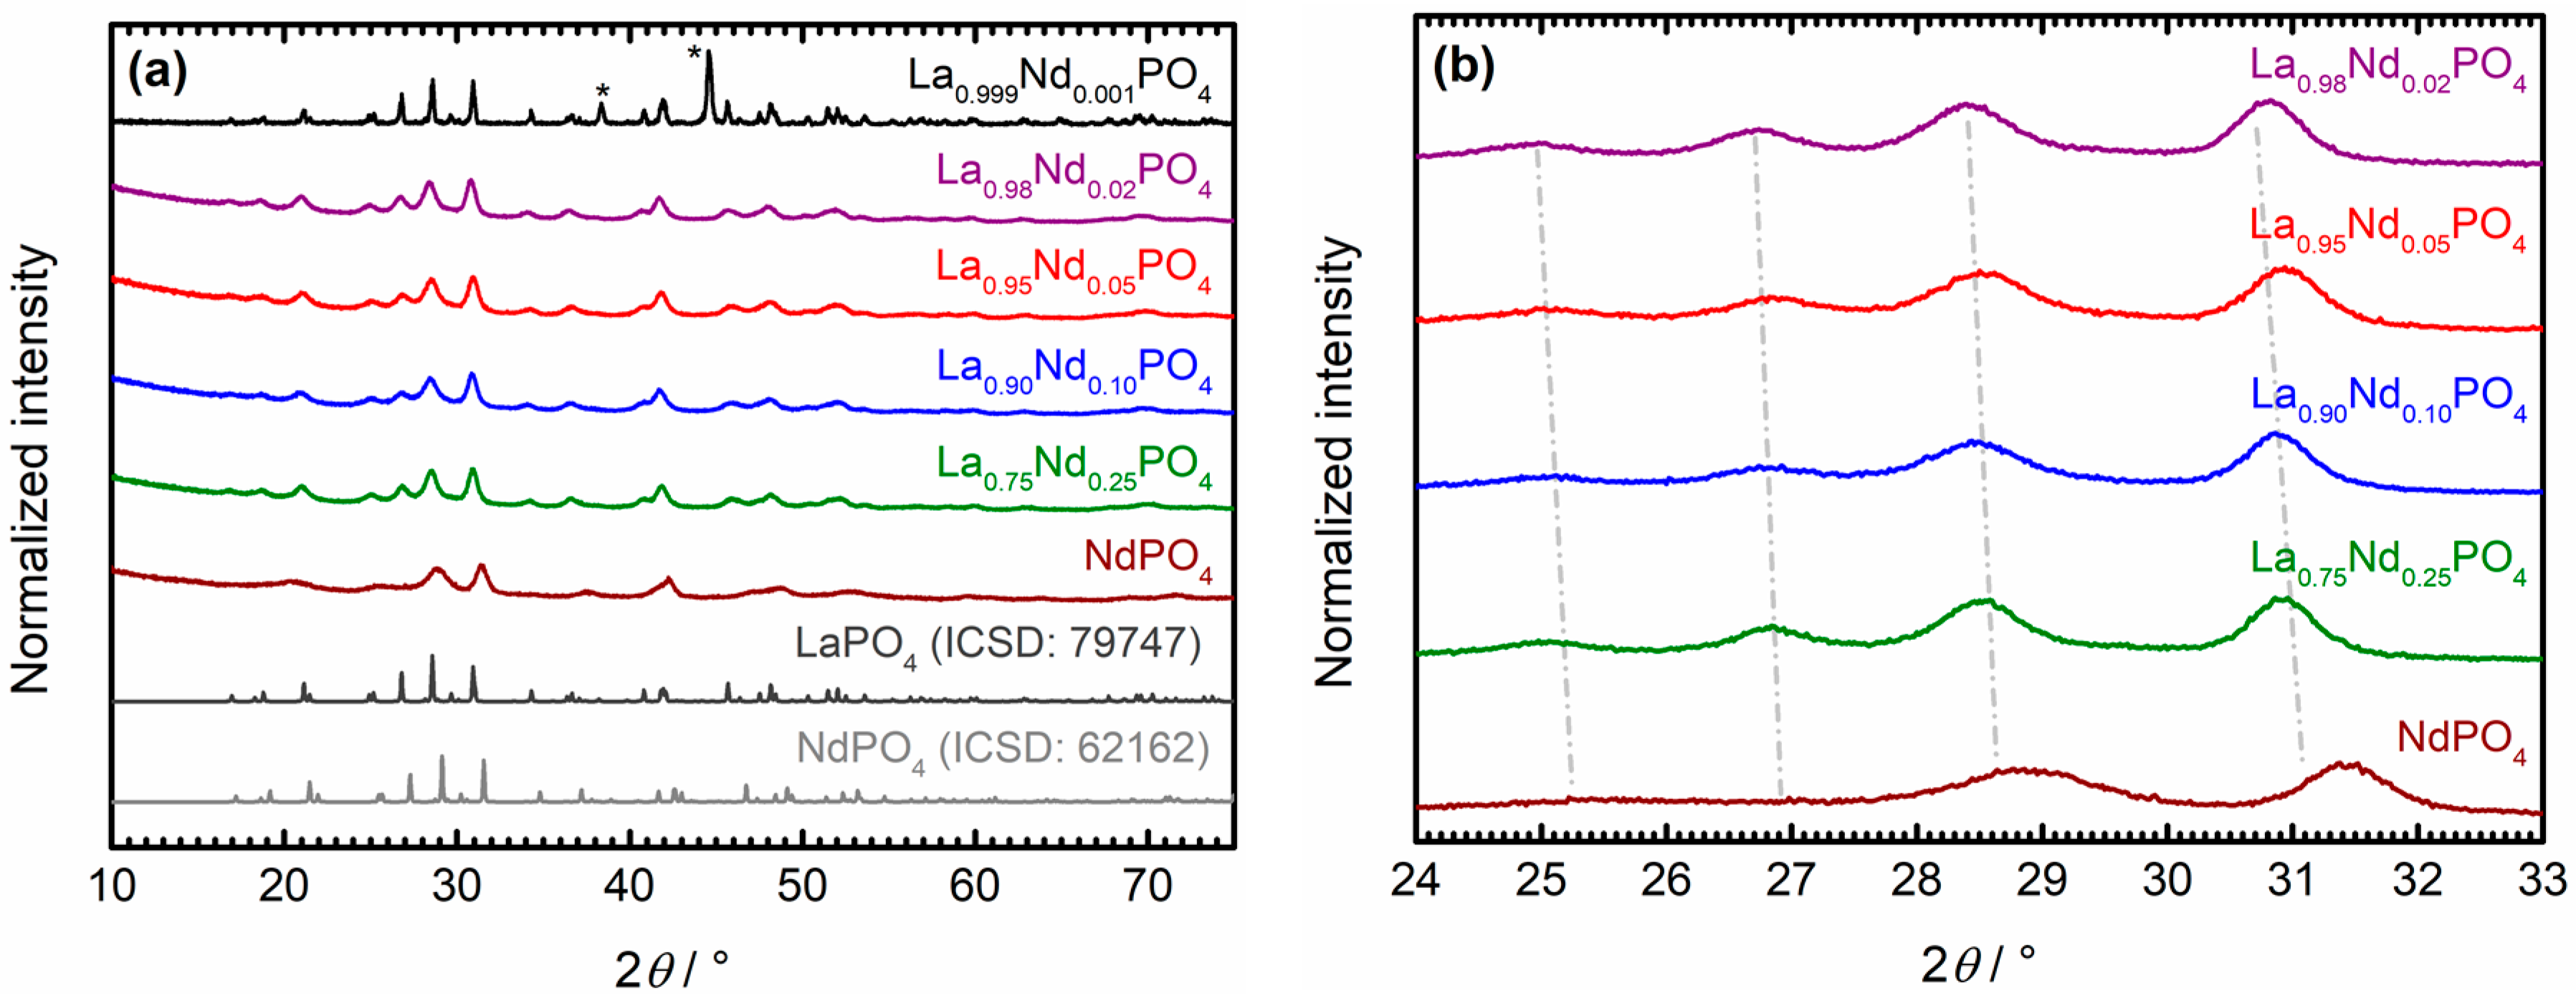
The TEM images (see
Figure 2) of the La
1−xNd
xPO
4 nanocrystals confirm the estimated crystallite sizes according to the XRPD patterns and diameters in the range of 10 nm to 15 nm are found. The nanocrystals have an anisotropic rod-like shape, which is also expected given the monoclinic crystal system. An average aspect ratio of around length/width = 1.5 is found for all nanocrystals. Moreover, the TEM images reveal a strong aggregation tendency of the nanocrystals in the powder, which was also found previously in higher condensed La-based phosphates such as the tetraphosphates ALa
1−yNd
y(PO
3)
4 (A = Li – Rb; 0 ≤
y ≤ 1) [
66].
3.2. Diffuse Reflectance and Optical Absorption
Diffuse reflectance spectra can serve as an additional characterization tool for the successful incorporation of Nd
3+ ions into the synthesized Nd
3+-activated LaPO
4 nanocrystals. The very low Nd
3+ concentration in microcrystalline La
0.999Nd
0.0001PO
4 did not give rise to a measurable reflectance signal and was thus excluded. A measure for the absorption coefficient of the respective powdered samples is accessible by the Kubelka-Munk function
K/
S under the assumption of a constant scattering part of the powders:
where
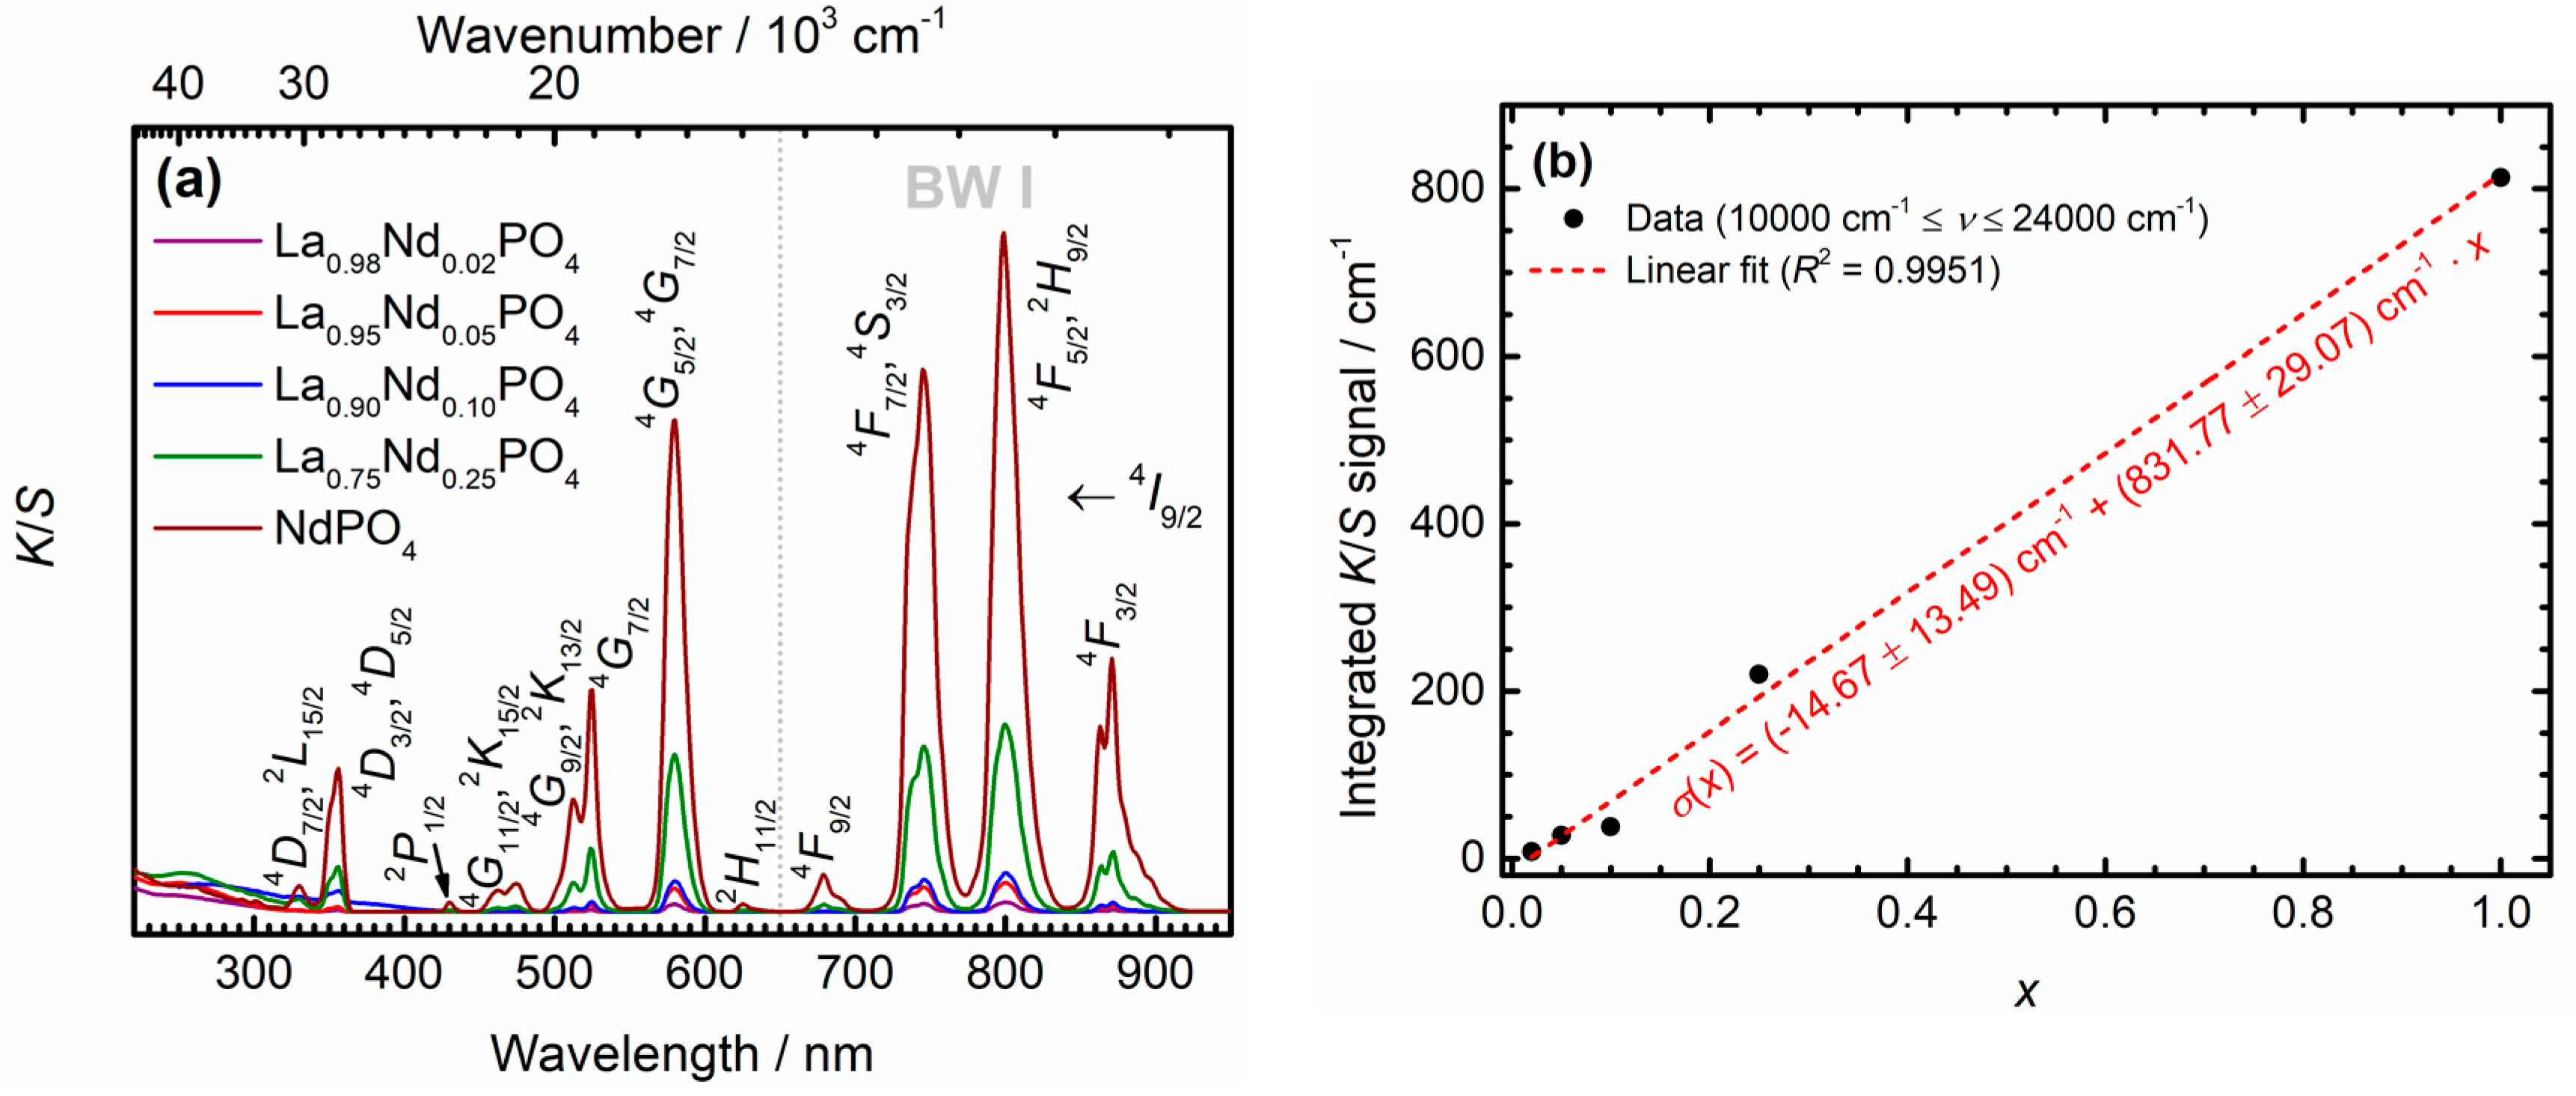
denotes the diffuse reflectance in the limit of a much higher scale of layer thickness of the powder compared to the average crystallite size, which is clearly fulfilled under the employed measurement conditions. The Kubelka-Munk spectra are depicted in
Figure 3a. As expected, the narrow 4
f3(
4I9/2) → 4
f3(
2S+1LJ) transitions of Nd
3+ show an increasing absorption strength with increasing Nd
3+ content of the nanocrystals. Indeed, a linear correlation between the integrated Kubelka-Munk signal—if accordingly translated to an energy scale—and nominal Nd
3+ concentration
x is present over the whole regime between
x = 0 and
x = 1, in agreement with expectations from electromagnetic dispersion theory (see
Figure 3b) [
67]. On a statistical significance level of
α = 0.05, the intercept of the linear calibration line does not differ from zero, as verified by a conventional
t test. Altogether, the diffuse reflectance spectra confirm a homogeneous miscibility between the LaPO
4 and NdPO
4 phases within the nanocrystals.
In the context of suitability for in vivo nanothermometry, the Kubelka-Munk spectra (see
Figure 3a) also reveal that the strongest absorption transitions of Nd
3+ within the discussed nanocrystals are located in the first biological window between 650 nm and 950 nm. This demonstrates the general suitability of Nd
3+ as a potent absorber for in vivo applications since its absorption remains negligibly affected by light attenuation due to surrounding tissue. The linear correlation of the integrated absorption strength with concentration in the La
1−xNd
xPO
4 nanocrystals does in principle allow for a simple strategy to improve the absorption strength in the Nd
3+-activated nanocrystals using higher Nd
3+ contents. As will be discussed below, however, this can induce both energy migration and cross-relaxation effects that limit the temperature window and thermometric performance of the nanocrystals.
3.3. Photoluminescence Properties and Luminescence Decay Dynamics—Predictions on Consequences for Thermometry with Nd3+
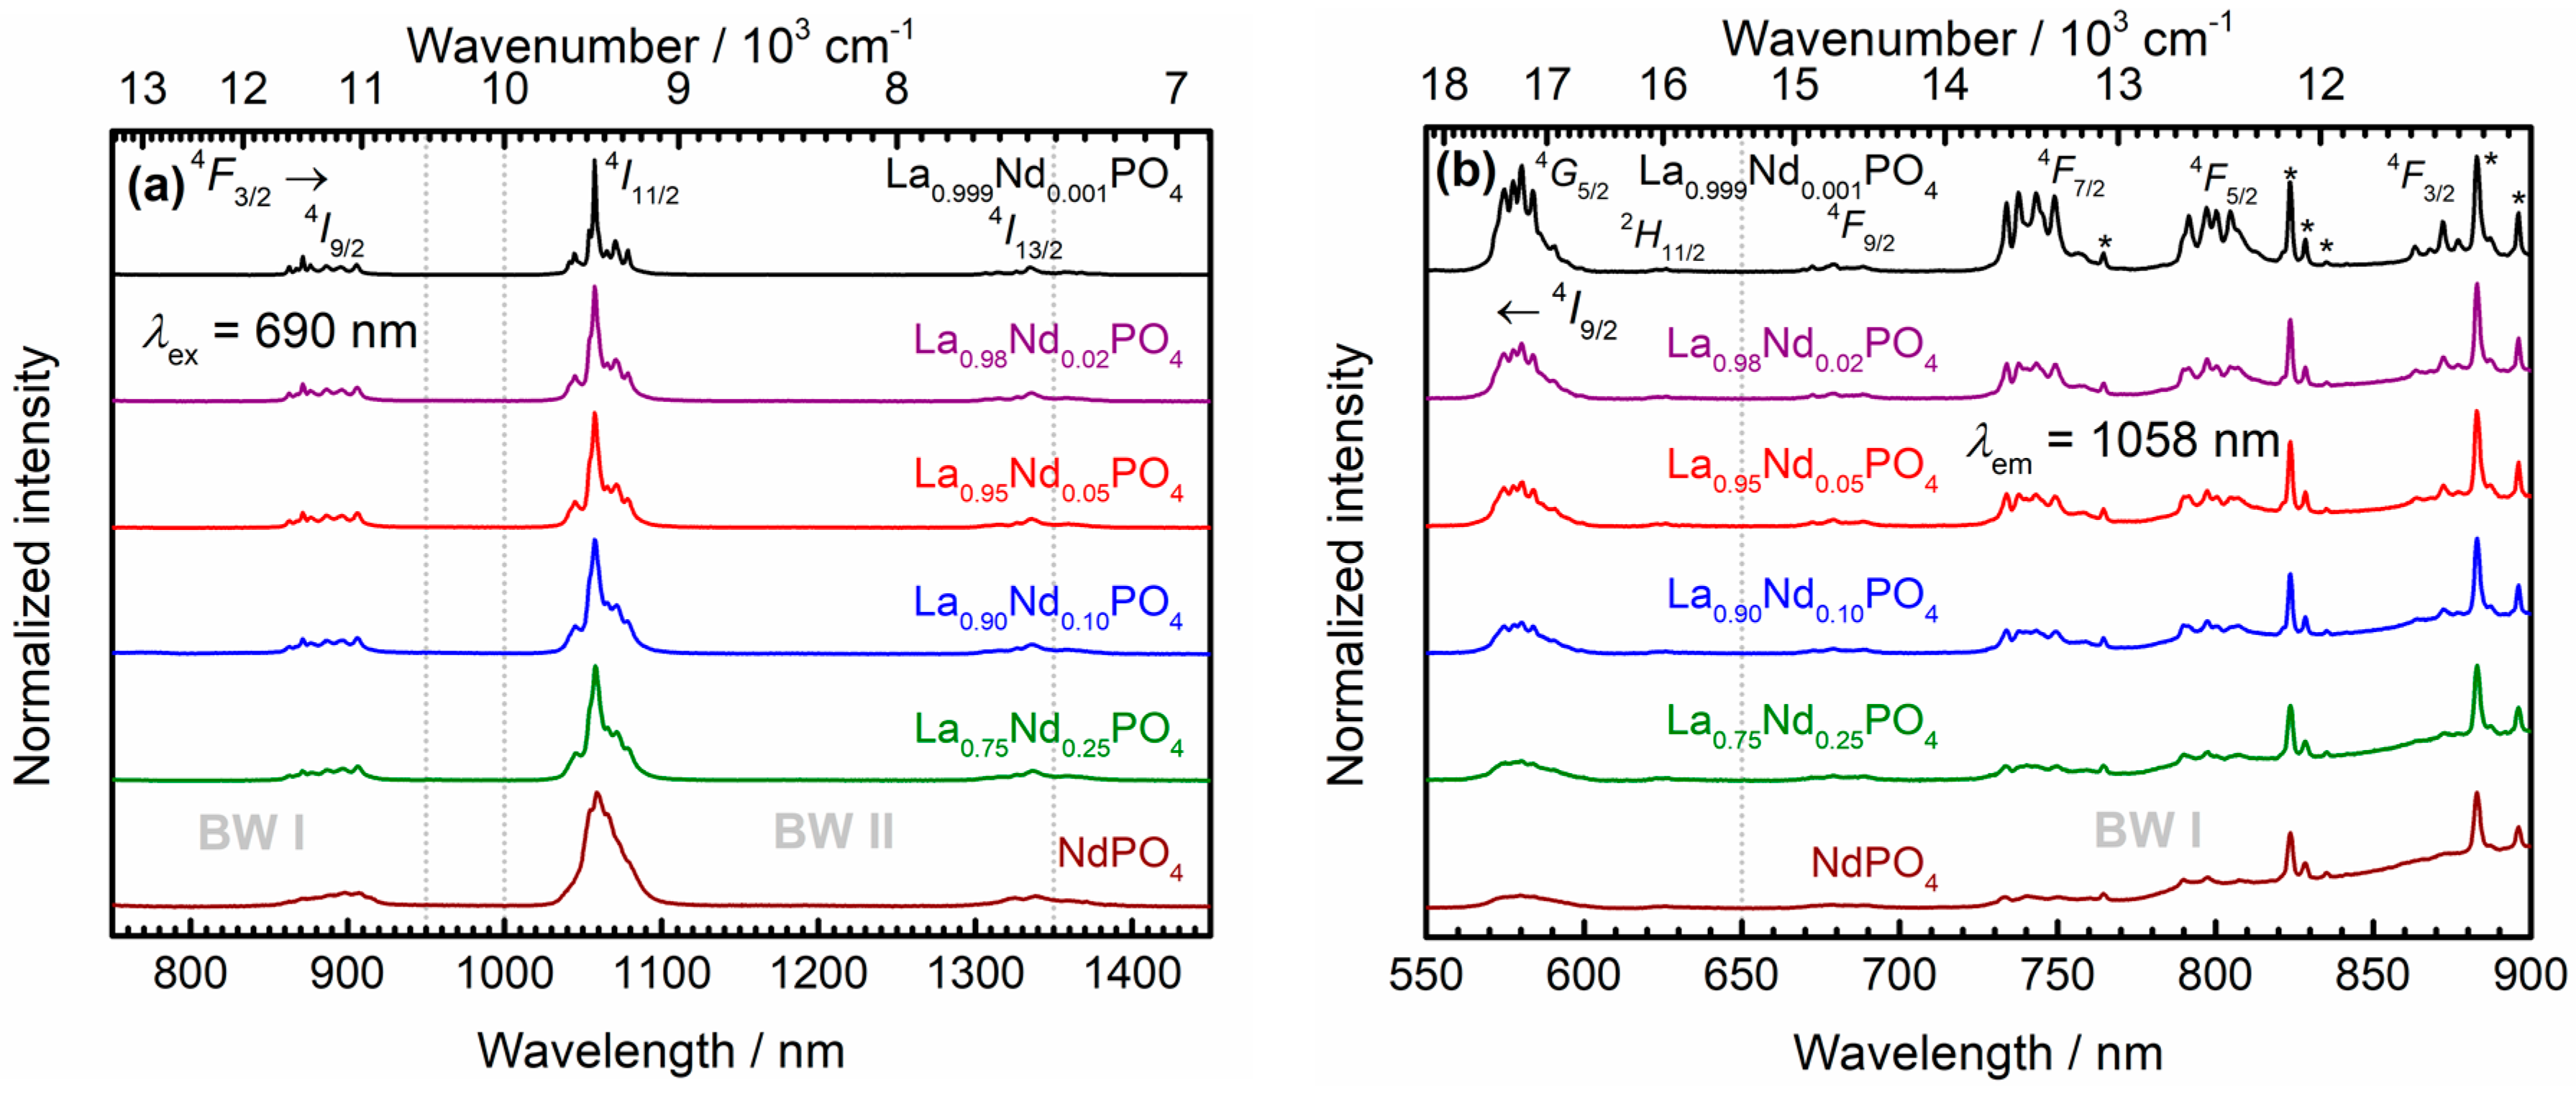
Figure 4a depicts the photoluminescence emission spectra of the La
1−xNd
xPO
4 nanocrystals at room temperature upon CW laser excitation at 690 nm into the
4F9/2 spin-orbit level of the Nd
3+ ions. Irrespective of the Nd
3+ content, the room temperature emission spectra show radiative transitions from the
4F3/2 level into the ground levels
4I9/2 (
= 890 nm),
4I11/2 (
= 1063 nm) and
4I13/2 (
= 1341 nm). The
4F3/2 →
4I11/2 transition has the largest intensity, reflecting a large branching ratio of around
β11/2(
4F3/2) = 0.67 compared to the other observable radiative transitions (
β9/2(
4F3/2) = 0.17,
β13/2(
4F3/2) = 0.16). This is understandable as
= 3,
= 4 implies a Judd-Ofelt allowed forced electric dipole transition and moreover, Nd
3+ is typically characterized by large Ω
4 and Ω
6 Judd-Ofelt intensity parameters in phosphates [
68,
69]. Similar findings have been reported in the previously mentioned higher condensed phosphates ALa
1-yNd
y(PO
3)
4 (A = Li – Rb; 0 ≤
y ≤ 1) [
66]. As expected, the emission spectra become inhomogeneously broadened and the spectral resolution of the different crystal field components decreases with increasing Nd
3+ content. The corresponding photoluminescence excitation spectra at room temperature acquired upon monitoring the most intense
4F3/2 →
4I11/2 emissive transition of Nd
3+ at 1057 nm are depicted in
Figure 4b). While the Kubelka-Munk spectra clearly suggest that the
4I9/2 →
4F5/2 transition at
= 808 nm shows the maximum absorption coefficient, as expected for a Judd-Ofelt-allowed transition (
= 3,
= 2), the excitation spectra reveal that absorption into any of the
4FJ (
J = 3/2…9/2) levels efficiently induces emission from the
4F3/2 level at room temperature, in particular with increasing Nd
3+ content. Like in the emission spectra, the respective excitation transitions also suffer inhomogeneous broadening. Moreover, several artefacts due to the Xe lamp lines are present in the excitation spectra (see peaks marked with asterisks in
Figure 4b). These artefacts can serve as an internal intensity standard. The strong decrease in relative intensity of Nd
3+ excitation lines relative to the Xe-lamp lines with
x indicates the presence of concentration quenching of the photoluminescence in the nanocrystals.
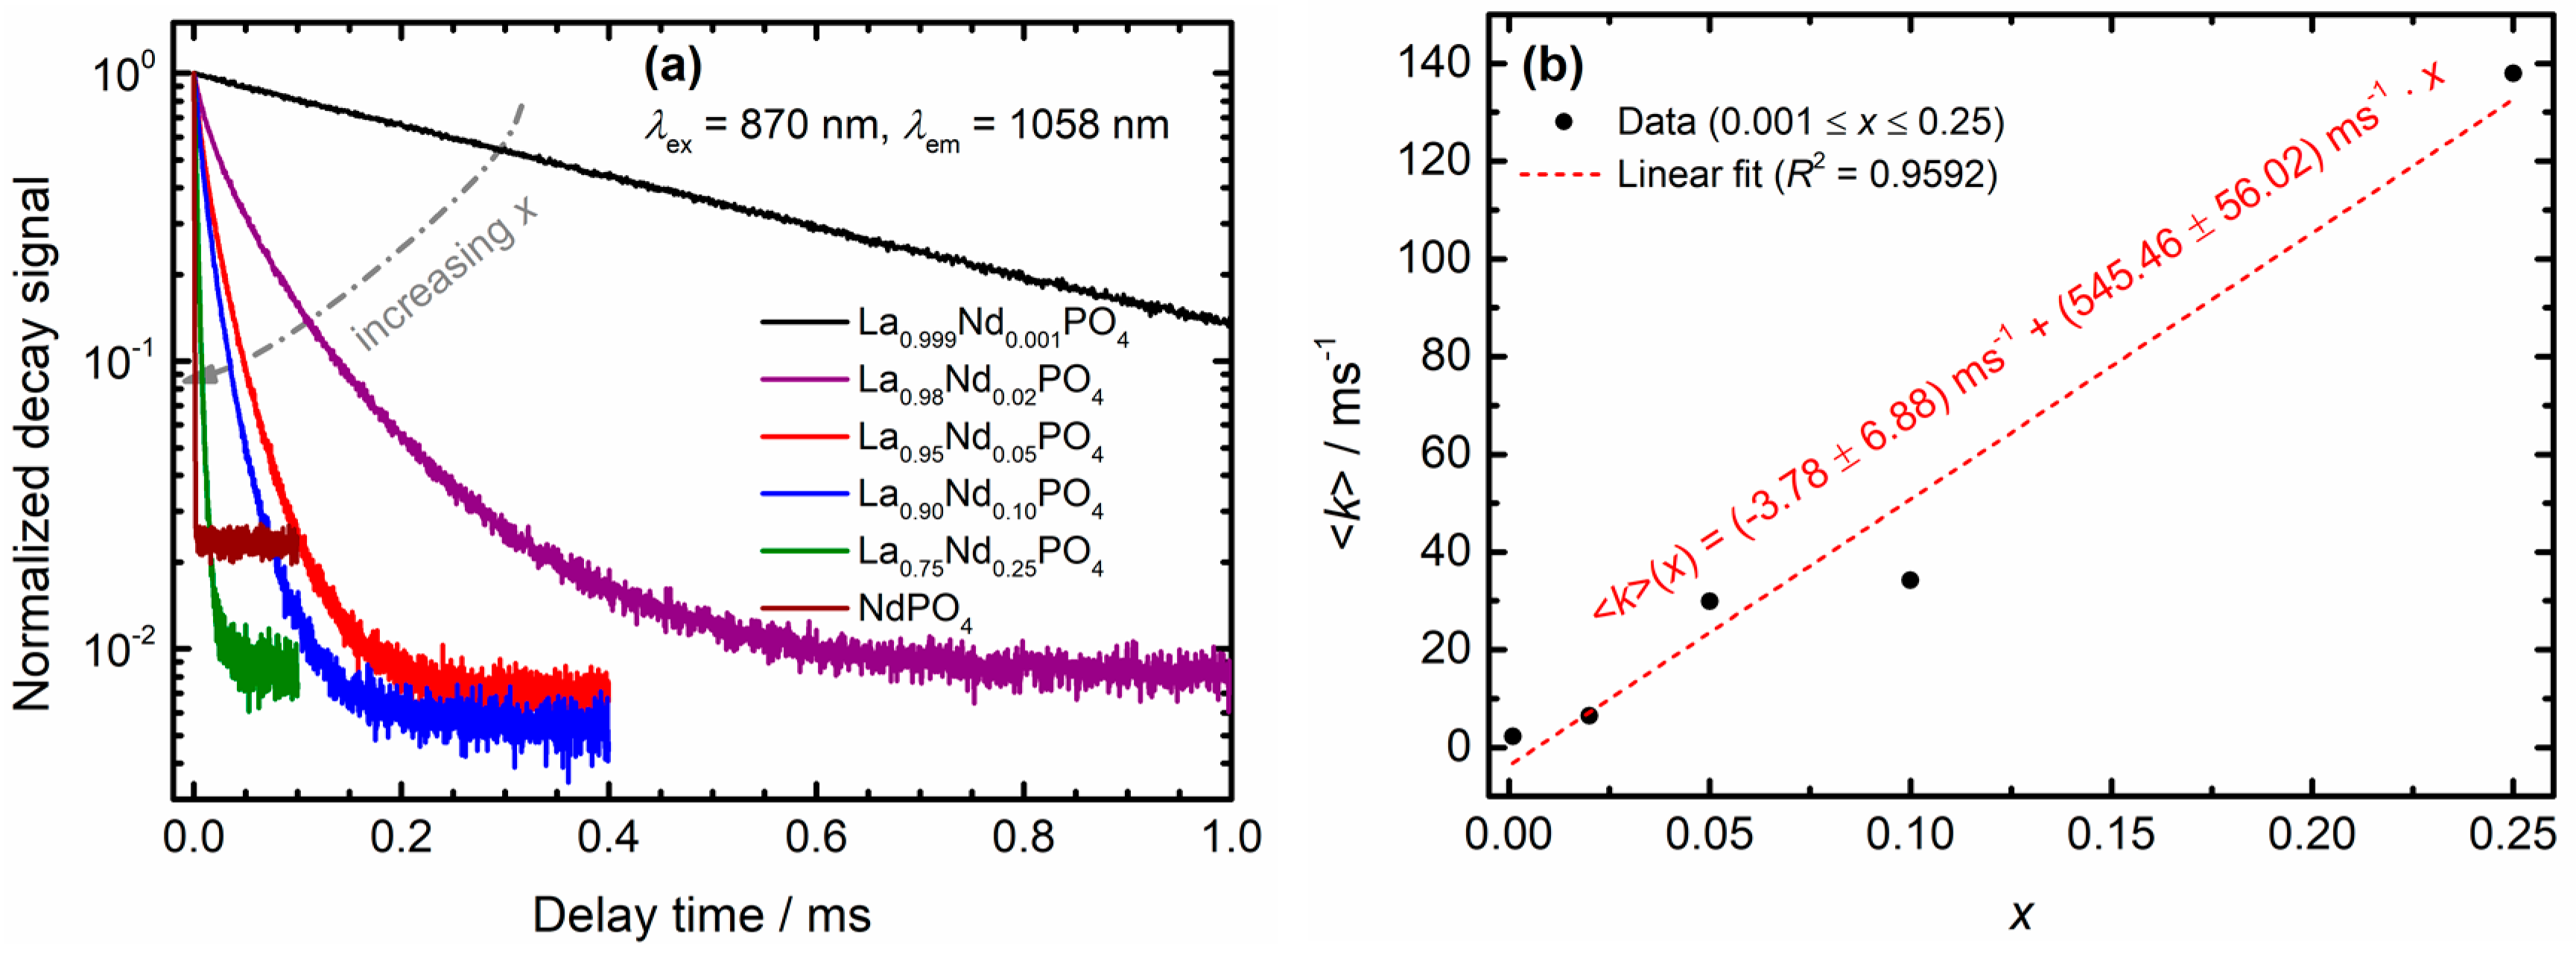
Important information on radiative and non-radiative decay rates can be obtained from luminescence decay measurements.
Figure 5a depicts the luminescence decay curves obtained upon direct excitation into the
4F3/2 level of Nd
3+ at 870 nm and detection of the most intense
4F3/2 →
4I11/2 emissive transition around 1060 nm. The intensity of the
4F3/2–excited emission at
λem = 1058 nm in a very dilute, microcrystalline La
0.999Nd
0.001PO
4 control sample (
λex = 870 nm) decays monoexponentially with an (assumed purely radiative) decay rate of
kr(
4F3/2) = 2.25 ms
−1 at room temperature (see
Figure 5a). With increasing Nd
3+ content, a faster and non-exponential decay is observed. This behavior is a clear signature of an energy transfer processes involving quenching of the
4F3/2 emission. In order to gain insight in the underlying quenching mechanism, the average decay rates
were determined with Equation (2) from the decay data depicted in
Figure 5a.
In Equation (2),
I(
tj) denotes the normalized, background-corrected luminescence intensity at time
tj and
j runs over all acquired data points. In the case of NdPO
4, the luminescence decay is already so fast that it was not feasible to reliably determine an average decay rate (see
Figure 5a). Thus, it was excluded from further analysis. A plot of the average decay rates in La
1−xNd
xPO
4 versus the Nd
3+ concentration
x reveals an approximately linear relation between the two quantities (see
Figure 5b). This is a clear signature of a two-ion process [
70] and indicates that cross-relaxation of the
4F3/2 level between the Nd
3+ ions becomes active in the LaPO
4 host even at concentrations as low as 2 mol%. An explanation for the high cross-relaxation efficiency is the small nearest neighbor distance of Nd
3+ ions in the orthophosphates (only 4.036 Å (NdPO
4), 4.104 Å (LaPO
4)) [
60,
61], which allows for an efficient electric dipole—electric dipole-type energy transfer. At lower concentrations and homogeneous do**, the average distances between Nd
3+ ions will be larger and thus, the cross-relaxation efficiency is reduced. However, for electric dipole-electric dipole type energy transfer, cross-relaxation can be still effective over distances as large as 10 Å.
Inspection of the energy level diagram of Nd
3+ shows that indeed the phonon-assisted cross-relaxation pathways [Nd1, Nd2]: [
4F3/2,
4I9/2] → [
4I15/2,
4I13/2] +
and [
4F3/2,
4I9/2] → [
4I13/2,
4I15/2] +
can take place if
1050–1100 cm
−1 (see
Figure 5c). The required phonon energy agrees very well with the asymmetric O-P-O stretching vibration [
59,
66], whose energy also matches the energy gap between the
4F5/2 and
4F3/2 level. The
4F5/2 level is even prone to resonant cross-relaxation, [Nd1, Nd2]: [
4F5/2,
4I9/2] → [
4I15/2,
4I15/2] (see
Figure 5c). The possibility of both the
4F3/2 and
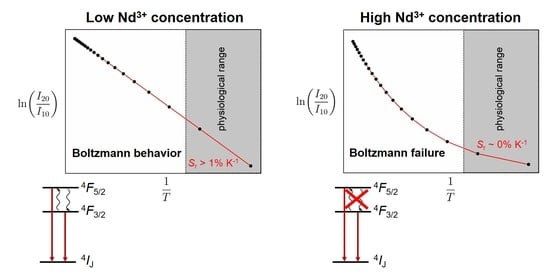
4F5/2 level to decay via cross-relaxation effectively increases the decay rate of both spin-orbit levels. This is expected to have immediate consequences for the thermometric performance of Nd
3+ once the average decay rates of those levels become similar to the non-radiative transition rates governing the thermal coupling of the excited states. If the average decay rates supersede the non-radiative transition rates to bridge the
4F5/2 –
4F3/2 gap, thermodynamic Boltzmann equilibrium cannot be sustained anymore, and the thermometric performance is lost.
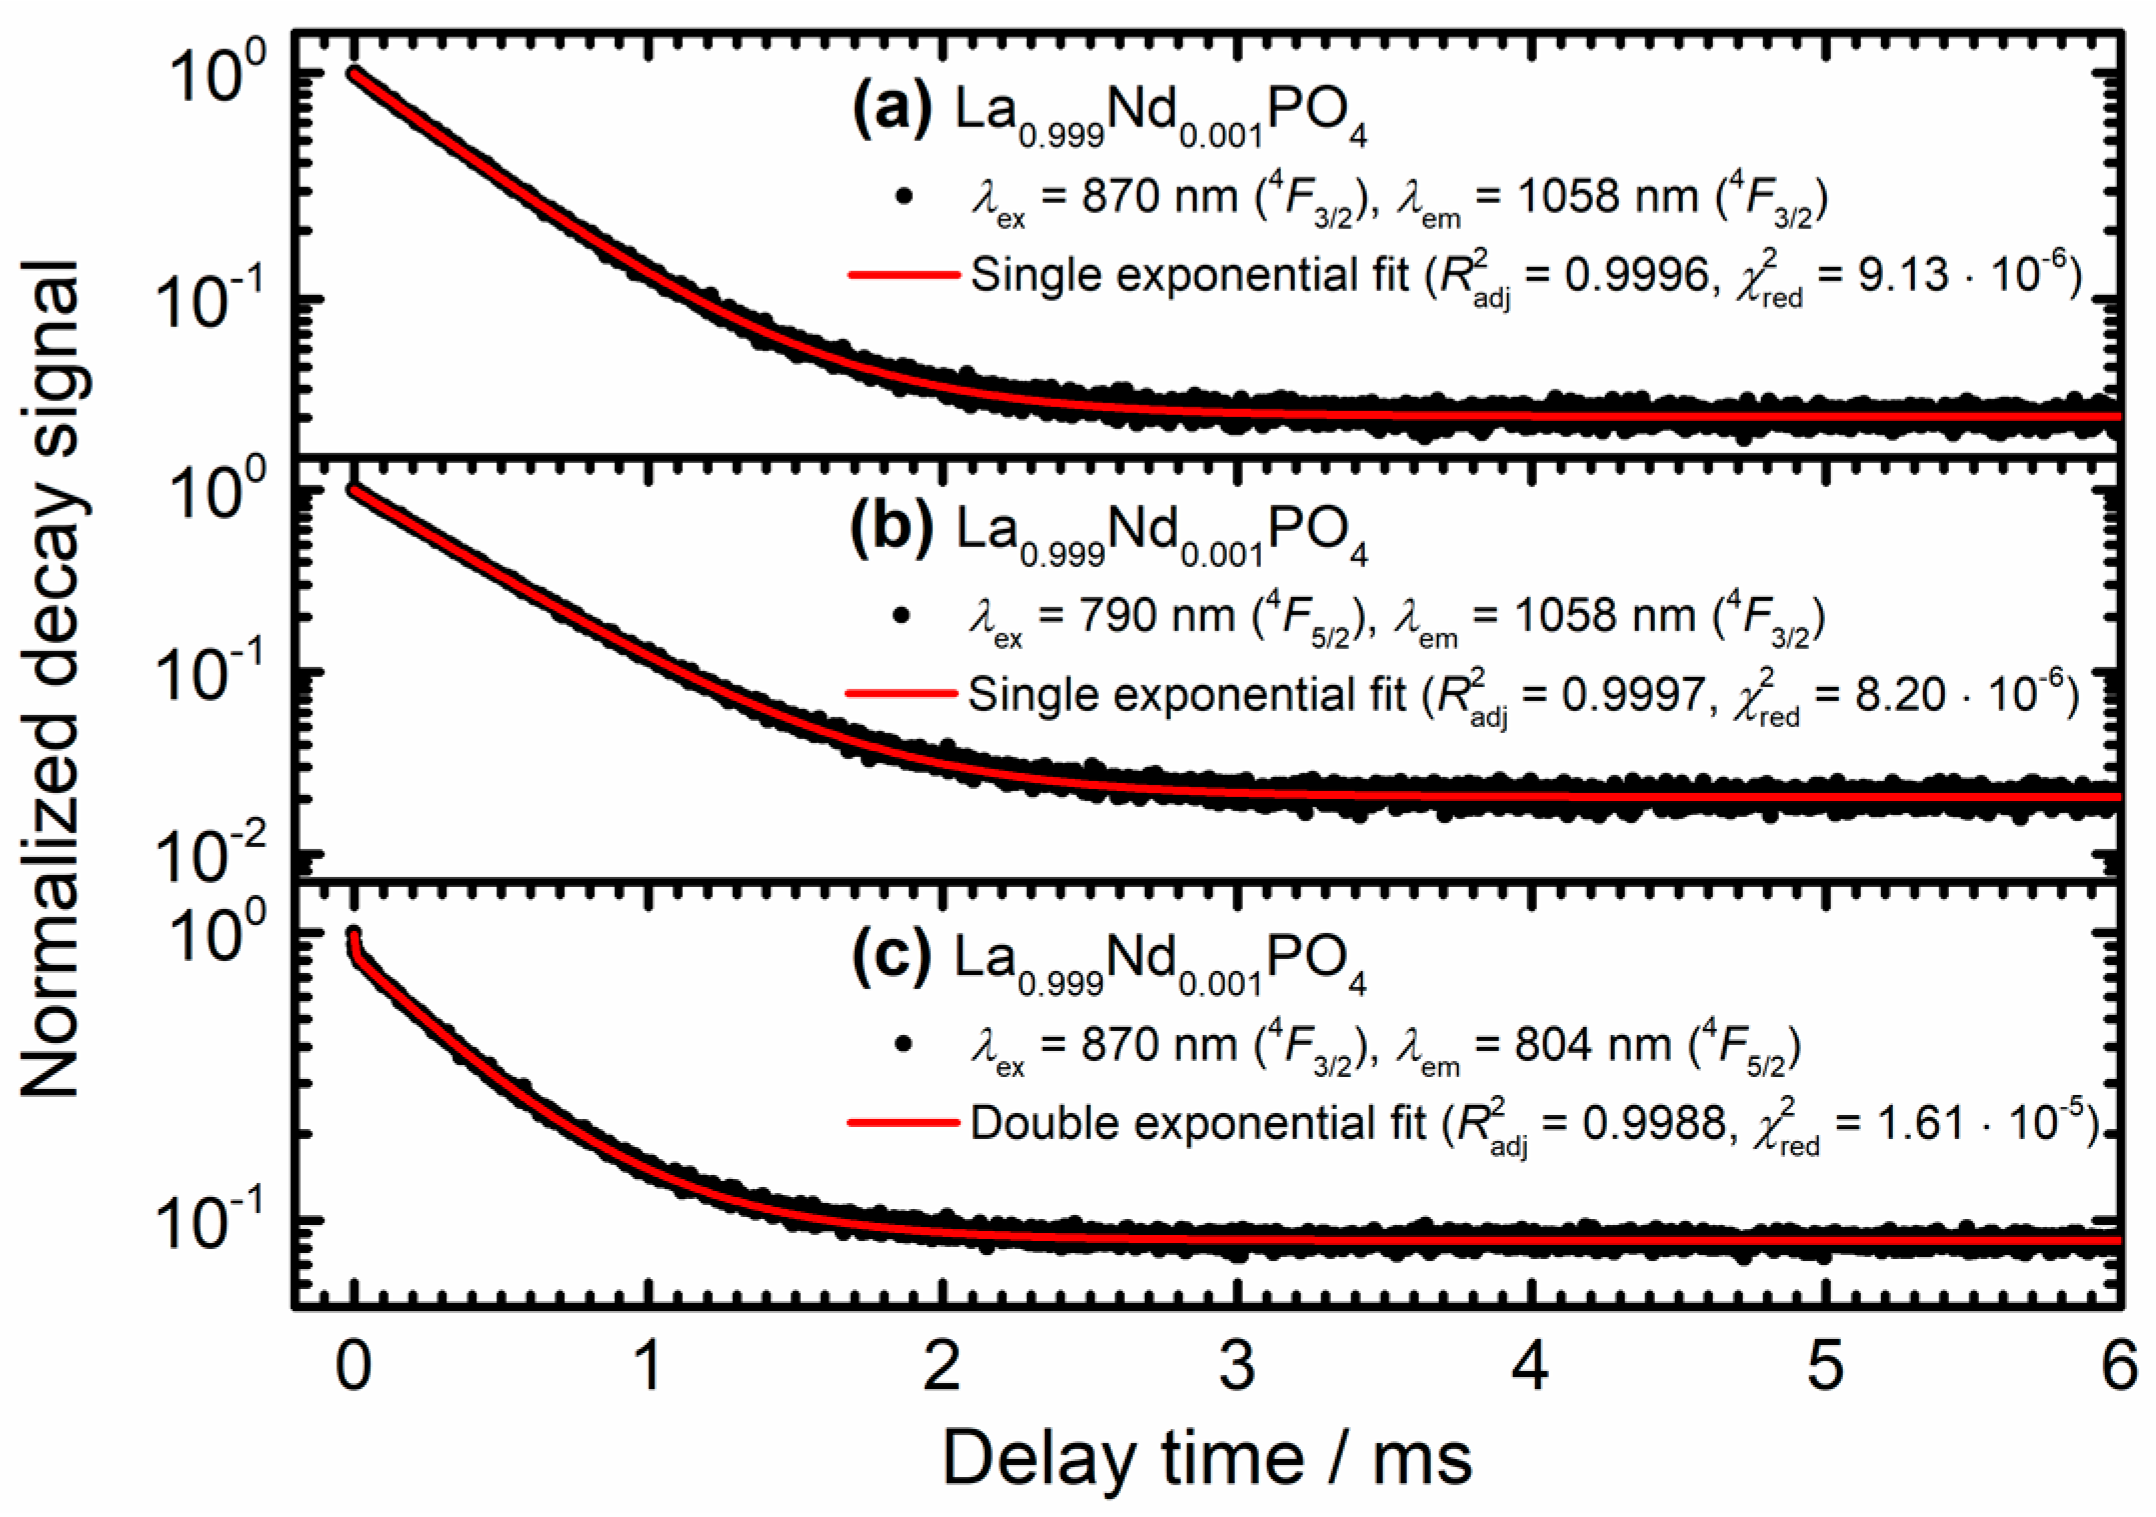
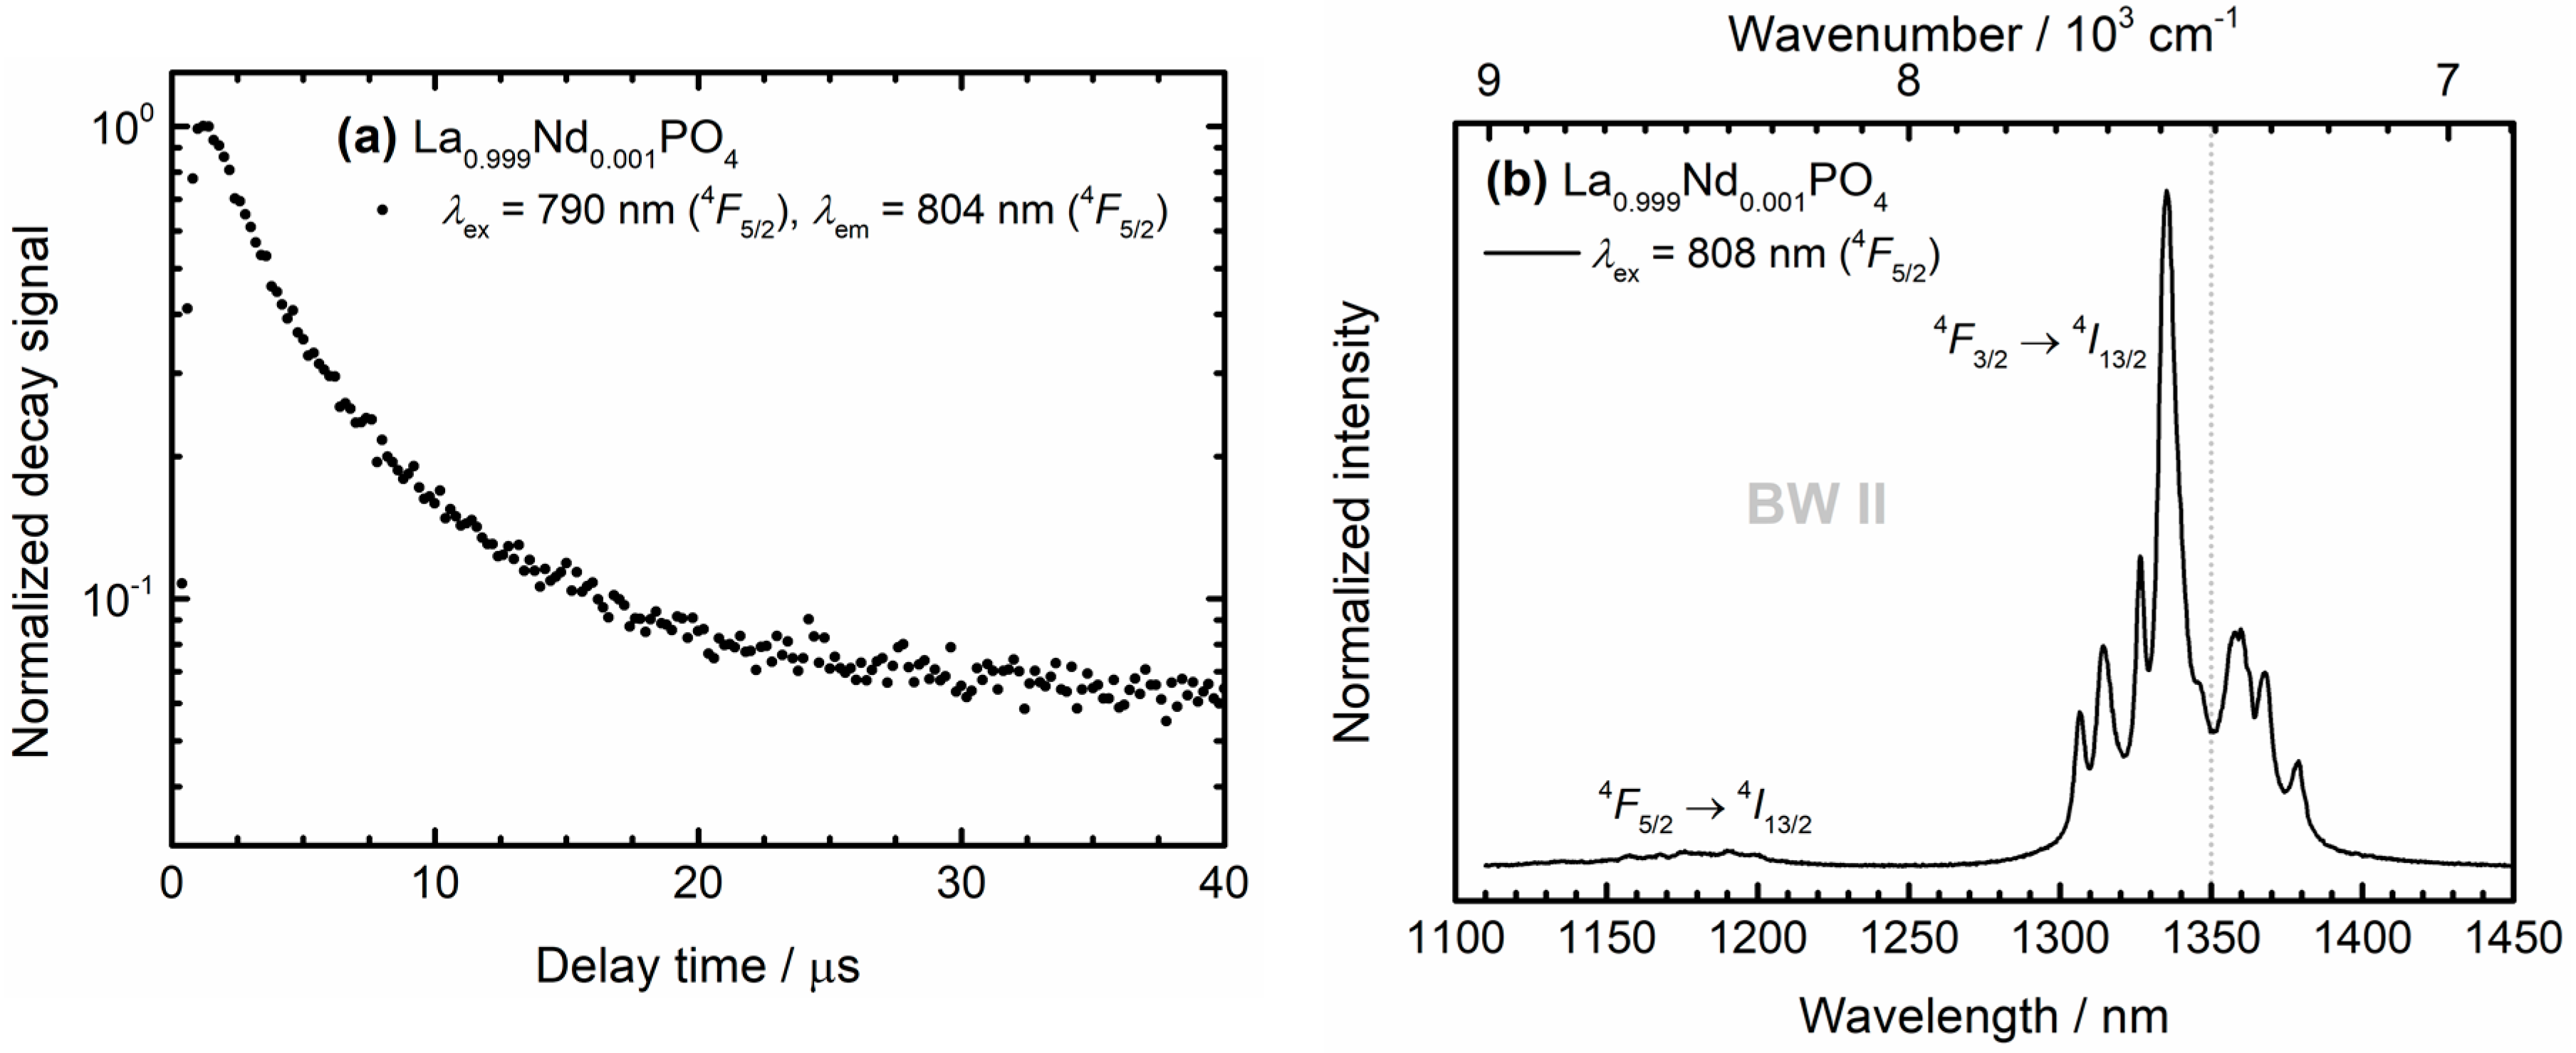
In order to obtain a semi-quantitative measure for the non-radiative transition rates mediating the thermal coupling between the
4F5/2 and
4F3/2 levels of Nd
3+, luminescence decay curves upon selective excitation into each of those levels were recorded for the dilute microcrystalline La
0.999Nd
0.001PO
4 sample. For excitation into either the
4F3/2 (
λex = 870 nm) or
4F5/2 level (
λex = 790 nm) and monitoring the luminescence decay of the
4F3/2 →
4I11/2-related transition at 1058 nm at room temperature, a purely single exponential decay with a radiative decay rate of
kr(
4F3/2) = 2.25 ms
−1 is observed with errors well below 0.01 ms
−1 (see
Figure 6a,b).
This observation indicates that the sum of radiative and non-radiative decay rate from the
4F5/2 level,
kr(
4F5/2) +
, have to be much higher than the radiative decay rate
kr(
4F3/2) since otherwise a rise component is expected in the decay curve recorded for
4F5/2 excitation. For selective excitation at 870 nm (resonant with excitation into the
4F3/2 level) very weak anti-Stokes
4F5/2 emission is observed with a much faster initial decay component besides the slower decay of the overlap**
4F3/2 →
4I9/2 – related luminescence. This fast ~4 μs initial decay is assigned to the total decay rate of the
4F5/2 level. In order to obtain a more precise value, upon selective excitation into the
4F5/2 level, the luminescence decay was recorded for the strongest
4F5/2 →
4I9/2 – related emission at 804 nm (see
Figure 7a). A fast decay with an average (radiative and non-radiative) decay rate of
kr(
4F5/2) +
= 204 ms
−1 was found using Equation (2). The value agrees well with the result for the fast component from the double exponential fit (
kr(
4F5/2) +
= (242 ± 12) ms
−1) as depicted in
Figure 6c. For the following analysis, we will employ the average value
kr(
4F5/2) +
= (223 ± 19) ms
−1.
In order to separate the contribution of radiative decay rate
kr(
4F5/2) from the non-radiative rate
at temperature
T, an emission spectrum containing the emissive transitions from both the
4F5/2 and
4F3/2 spin-orbit levels into the same ground level
4I13/2 was recorded for selective excitation into the
4F5/2 level (
λex = 808 nm). The ratio between the integrated intensities (if measured in photon counts) of the emission,
Iem, from the
4F5/2 and the
4F3/2 is equal to the ratio between
kr(
4F5/2) and
, respectively:
with
= 0.16 and
= 0.60 as the branching ratios of the respective transitions derived from the luminescence spectra (see
Figure 4a and
Figure 7b). Equation (3) is only valid if thermally excited non-radiative absorption from the
4F3/2 level back to the
4F5/2 is negligible and if there are no other non-radiative decay paths for the two levels.
The temperature dependence of non-radiative rates among 4
fn-related spin-orbit levels is governed by thermally excited multi-phonon transitions. The thermal average number
of effective phonon modes with energy
resonantly bridging the regarded energy gap between two electronic levels is given by the Planck formula:
with
kB as the Boltzmann constant. With an effective phonon energy of
1050 cm
−1, even at room temperature (
T = 298 K), it is
6.34 ∙ 10
−3, i.e., effectively, one phonon mode is only thermally excited with a very low probability. Based on Equation (3) and the emission spectrum depicted in
Figure 7b, a non-radiative emission rate of
(298 K) =
g1knr(0)
≈
g1knr(0) = (219 ± 19) ms
−1 can be derived, where
g1 = 4 is the (2
J + 1)-fold degeneracy of the
4F3/2 level. Thus, the intrinsic non-radiative rate is estimated to be
knr(0) = (54.6 ± 4.7) ms
−1.
The validity of the employed approximation of a still negligible thermal multi-phonon absorption rate for the non-radiative transition
4F3/2 →
4F5/2 can now be verified. With the value for
knr(0) and the degeneracy of the
4F5/2 level,
g2 = 6, it is
(298 K) =
g2knr(0)
= (2.08 ± 0.18) ms
−1, which agrees with
kr(
4F3/2) within the statistical error. Thus, the approximation to neglect that non-radiative absorption pathway for Nd
3+ ions in the dilute La
0.999Nd
0.001PO
4 microcrystals is just about to fail at room temperature and Boltzmann behavior should be expected to set in just above room temperature. In the case of the concentrated Nd
3+-doped nanocrystals La
1−xNd
xPO
4, however, the additional cross-relaxation pathways and possible quenching of the
4F3/2 and
4F5/2 emission by high energy vibrations of any cap** ligands such as -OH groups on the nanocrystal surface effectively increases the decay rate of the
4F3/2 and
4F5/2 level (see
Figure 5a). Consequently, Boltzmann equilibrium is then expected to become active only at successively higher temperatures, once
supersedes these higher average decay rates.
Table 2 compiles the relevant decay rates derived from decay dynamics and emission spectra of the dilute microcrystalline La
0.999Nd
0.001PO
4 sample.
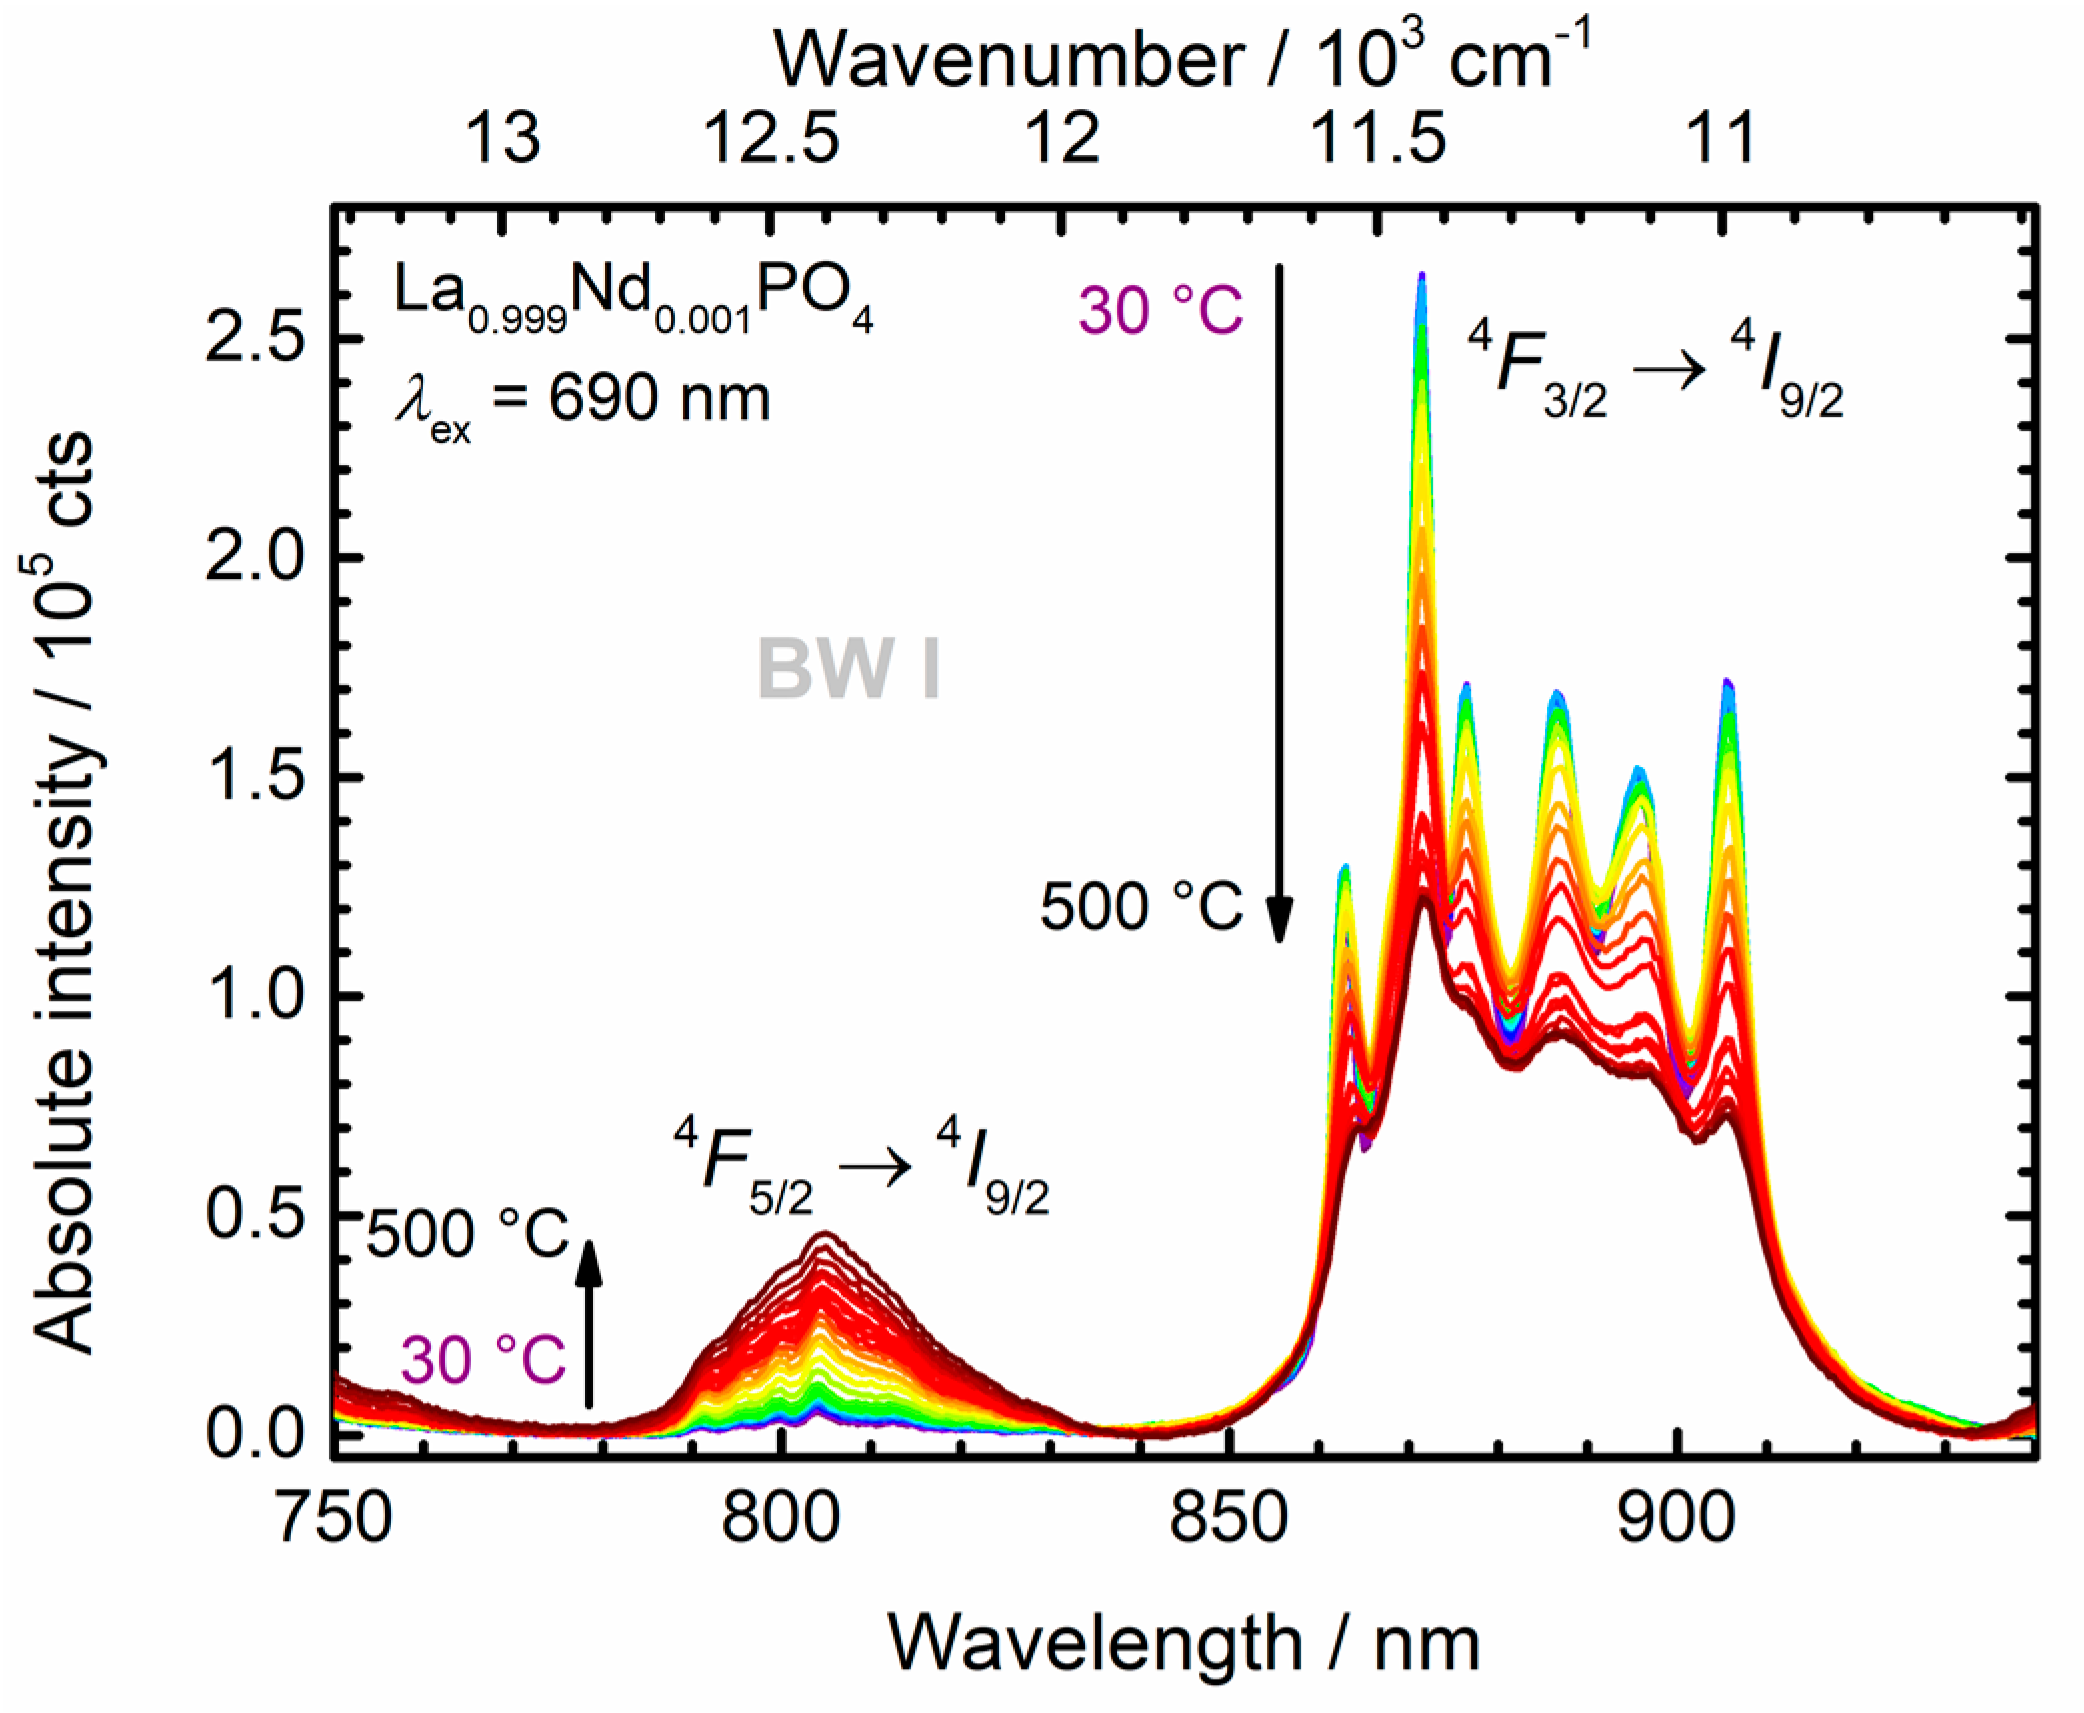
3.4. Consequences of Cross-Relaxation on Luminescence Thermometry Employing the 4F5/2 and 4F3/2 Spin-Orbit Levels of Nd3+
For Boltzmann-based luminescence thermometry, it is beneficial to select a different auxiliary excited state that feeds the thermally coupled states giving rise to the temperature-dependent luminescence phenomena. Direct excitation into one of those levels provides an additional non-equilibrium component to the excited state population and although steady-state conditions might be retained, the single ion luminescence thermometer is driven out of thermodynamic equilibrium. Thus, despite the high absorption strength of the
4I9/2 →
4F5/2 transition at 808 nm, we decided to selectively excite into the
4F9/2 spin-orbit level with a corresponding absorption wavelength of 690 nm for all luminescence thermometry experiments. The temperature-dependent luminescence spectra of the microcrystalline La
0.999Nd
0.001PO
4 upon excitation at 690 nm are depicted in
Figure 8.
All samples were investigated over a wide temperature range, also above physiological temperatures, for the sake of better insight into the thermal coupling between the
4F3/2 and
4F5/2 levels and to investigate the predicted thermometric performance at higher temperatures. In the case of thermodynamic equilibrium conditions between the two excited levels, the LIR,
R(
T), should obey Boltzmann’s law:
where we denote the excited
4F3/2 level as state
and the
4F5/2 level as state
in the following. The ground level
4I9/2 is referred to as state
. Then,
g1 = 4 and
g2 = 6 represent the (2
J + 1)-fold degeneracies of the two spin-orbit levels, while Δ
E21 = 1020 cm
−1 as derived from the Kubelka-Munk spectra is the energy gap between the two excited levels. This value is in good agreement with expectations according to the Dieke—Carnall diagram [
71].
kB is Boltzmann’s constant and
C is a pre-exponential factor that basically relates the electronic line strengths of the regarded radiative transitions of interest. It can also be estimated from Judd-Ofelt theory [
14,
69], but will be considered as a fitting parameter in the present study.
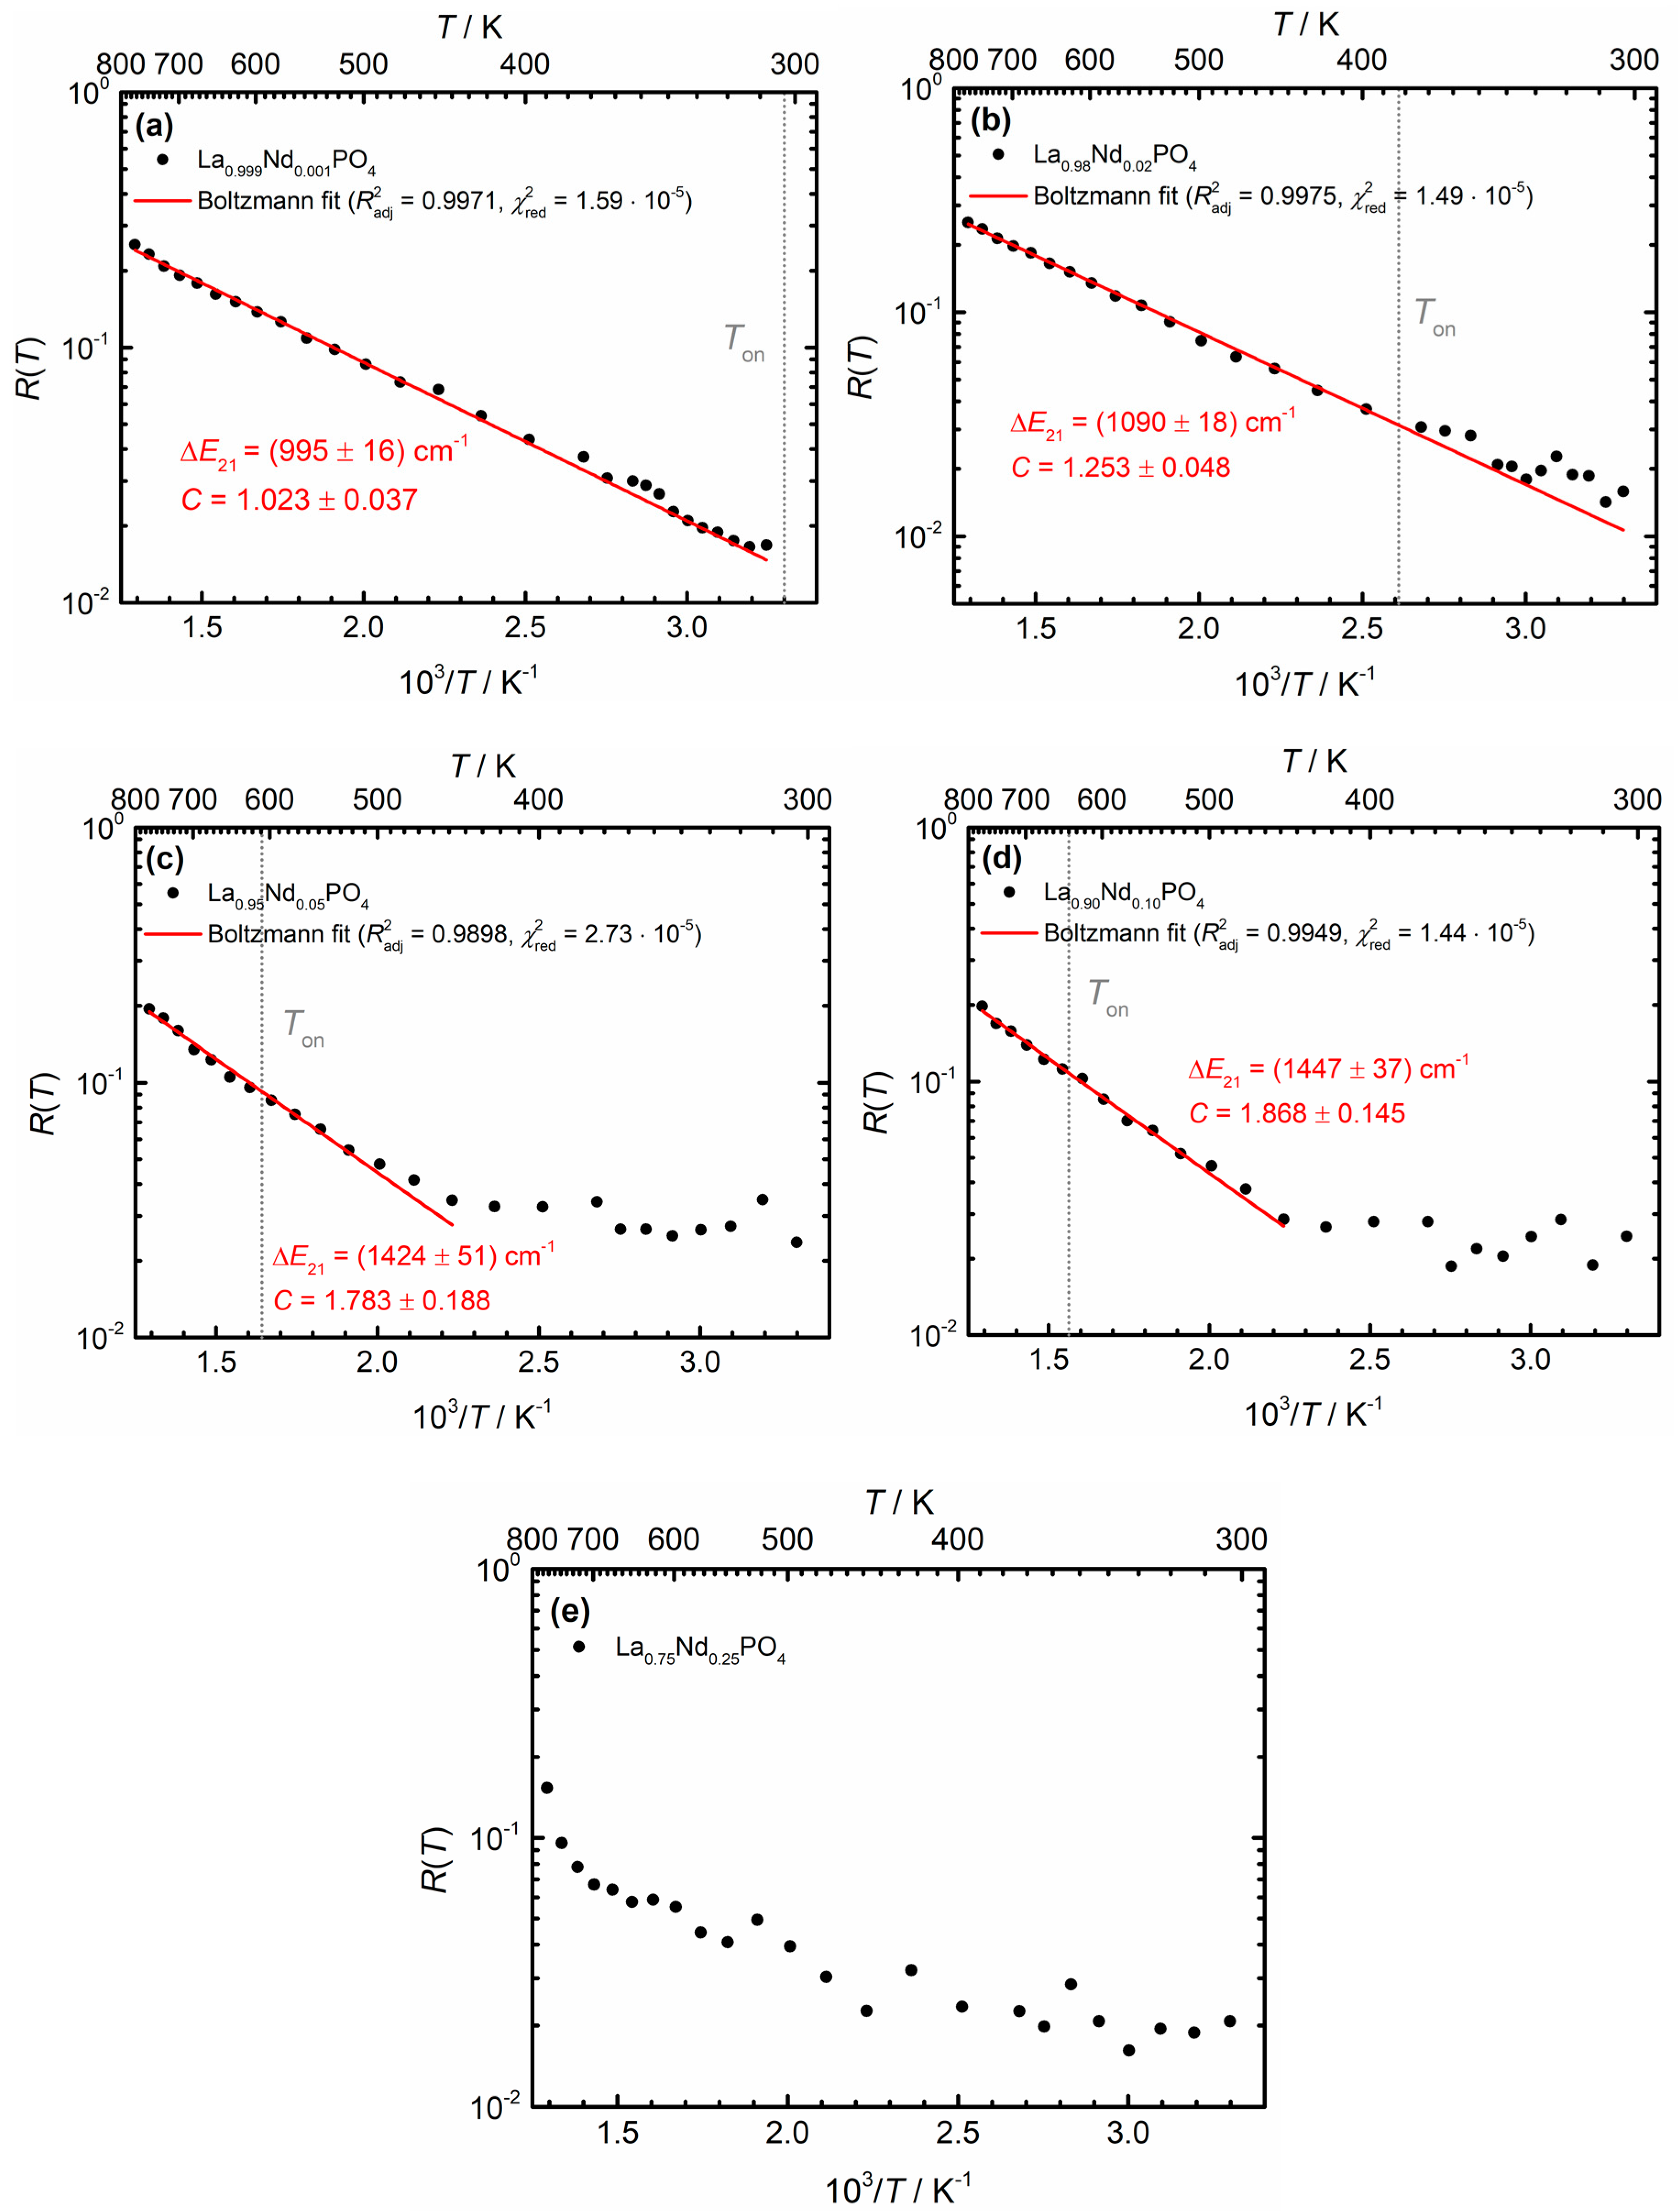
Figure 9 depicts the thermometric Boltzmann plots derived from the temperature-dependent luminescence spectra of the La
1−xNd
xPO
4 nanocrystals in the wavelength range between 775 nm and 950 nm (i.e., in BW I). All spectra were corrected for constant instrumental background of the NIR PMT and additional blackbody radiation background,
B(
λ,
T), at a given temperature
T to obtain meaningful LIR data,
with
A and
D as free parameters,
λ as the wavelength,
h as Planck’s constant and
c as the light velocity. Due to concentration quenching the luminescence in NdPO
4 was so weak, especially at temperatures above 100 °C, that no meaningful information could be extracted and thus, it was excluded from further analysis. The predictions according to the luminescence decay kinetics of Nd
3+ can be directly compared to the experimental data. The LIR of the
4FJ →
4I9/2 (
J = 3/2, 5/2) transitions in La
0.999Nd
0.001PO
4 shows Boltzmann behavior over the full temperature range from 30 °C to 500 °C. This observation is consistent with the observation that the non-radiative absorption rate
(
T) governing the non-radiative
4F3/2 →
4F5/2 transition is similar to the radiative decay rate of the
4F3/2 level at room temperature and increases at higher temperatures. This will result in Boltzmann equilibrium starting just above room temperature. Overall, thermodynamic equilibrium between the two spin-orbit levels can be sustained over the full temperature range above ~300 K.
In the La
1−xNd
xPO
4 (
x > 0.001) nanocrystals, the average decay rate of the
4F3/2 level increases with Nd
3+ content due to the additional cross-relaxation pathways between neighboring Nd
3+ ions. This additional decay channel competes with the non-radiative absorption rate and can hamper Boltzmann equilibration. Given the known temperature dependence of
(
T) (scaling with the Planck factor in Equation (4)) and the faster decay of the
4F3/2 level (from the decay curves of the
4F3/2 emission in
Figure 5), it is possible to determine the threshold temperature
Ton, above which Boltzmann behavior is expected in the more concentrated Nd
3+-samples.
Ton is taken as the temperature at which the non-radiative absorption
becomes faster than the total decay rate of the
4F3/2 level. In very good agreement with expectations, a shifted onset of the Boltzmann behavior is observed in all higher concentrated La
1−xNd
xPO
4 nanocrystals, both experimentally and theoretically. The predicted onset temperatures
Ton derived from the requirement of equal non-radiative absorption and average decay rates from the
4F3/2 level increases with Nd
3+ content
x and are indicated in
Figure 9. For
x = 0.02, Boltzmann equilibrium becomes problematic in the physiological temperature window and for
x = 0.05, temperature sensing becomes possible only above 450 K. For the higher Nd
3+ concentrations (
x = 0.25) no Boltzmann behavior is observed even up to 500 °C. The predicted temperature at which the non-radiative absorption rate dominates is even higher, above 900 °C. Thus, although a higher Nd
3+ content may increase the absorption efficiency of the nanocrystals (cf.
Figure 3b), the efficient cross-relaxation of Nd
3+ ions prevents sustainment of a Boltzmann equilibrium for the excited
4F3/2 and
4F5/2 levels for a larger temperature range. As a result, higher Nd
3+ contents destroy the promising potential of the large
4F5/2–
4F3/2 gap for Boltzmann thermometry with high sensitivity at physiological temperatures. In contrast, higher temperature thermometry (100 °C–500 °C) is still feasible even for Nd
3+ concentrations as high as
x = 0.10. Measurements of higher temperatures in BW I (and consequently, also in BW II) with those nanocrystals is however cumbersome since the blackbody background starts to dominate the emission spectrum and temperature can be measured more accurately from the background itself.
The effect of cross-relaxation on the useable temperature window for LIR temperature sensing can differ among lanthanide ions. Here we show for the
4F3/2 and
4F5/2 levels of Nd
3+ that high dopant concentrations are clearly detrimental because cross-relaxation shortens the lifetime of the emitting levels, thus limiting the time available for Boltzmann equilibration. However, cross-relaxation can also be beneficial, if it provides an additional pathway for thermalization between the emitting levels, thus establishing Boltzmann equilibrium. This has been shown to be the case for the
5D0 and
5D1 levels of Eu
3+ where cross-relaxation between neighboring Eu
3+ ions provides an alternative path for relaxation and thus sustains Boltzmann behavior over a wider temperature range at elevated Eu
3+ concentrations, as was demonstrated in the case of
β-NaYF
4:Eu
3+ [
58].
It is noteworthy that the fitted effective energy gaps, Δ
E21, gradually increase with higher Nd
3+ content
x. This can be explained by the fact that the fitted effective energy gap for the nanocrystals with higher Nd
3+ contents are obtained from higher temperature data. At higher temperatures, the probability for non-radiative absorption into the higher crystal field states of the
4F5/2 spin-orbit level increases, which effectively increases the energy gap Δ
E21. Thus, only in the very dilute La
0.999Nd
0.001PO
4 compound does the energy gap agree with the spectroscopically deduced energy gap according to the Kubelka-Munk spectra (Δ
E21 = 1020 cm
−1, see
Figure 3a). Interestingly, also the pre-exponential constant
C systematically increases with increasing Nd
3+ content
x. As it is fundamentally related to both the branching ratios and the radiative decay rates from the two considered excited states of Nd
3+, its increase may also be related to the temperature-induced population of higher energetic crystal field states of the
4F3/2 and
4F5/2 levels. In conjunction with those observations, the predicted onset temperatures for Boltzmann behavior for the nanocrystals activated with 5 mol% and 10 mol% Nd
3+ are significantly higher than the experimentally observed onsets (see
Figure 9c,d). A possible explanation is a decreasing cross-relaxation efficiency of the
4F3/2 level at higher temperatures. Since cross-relaxation of the
4F3/2 level requires one high energy phonon mode of the phosphate host, an increasing temperature and population of the higher energy crystal field level may lead to an energy mismatch of the necessary energy transfer resonance condition and could thus reduce the cross-relaxation efficiency. Temperature-dependent luminescence decay analyses and modelling of the energy migration processes are necessary to confirm this hypothesis.
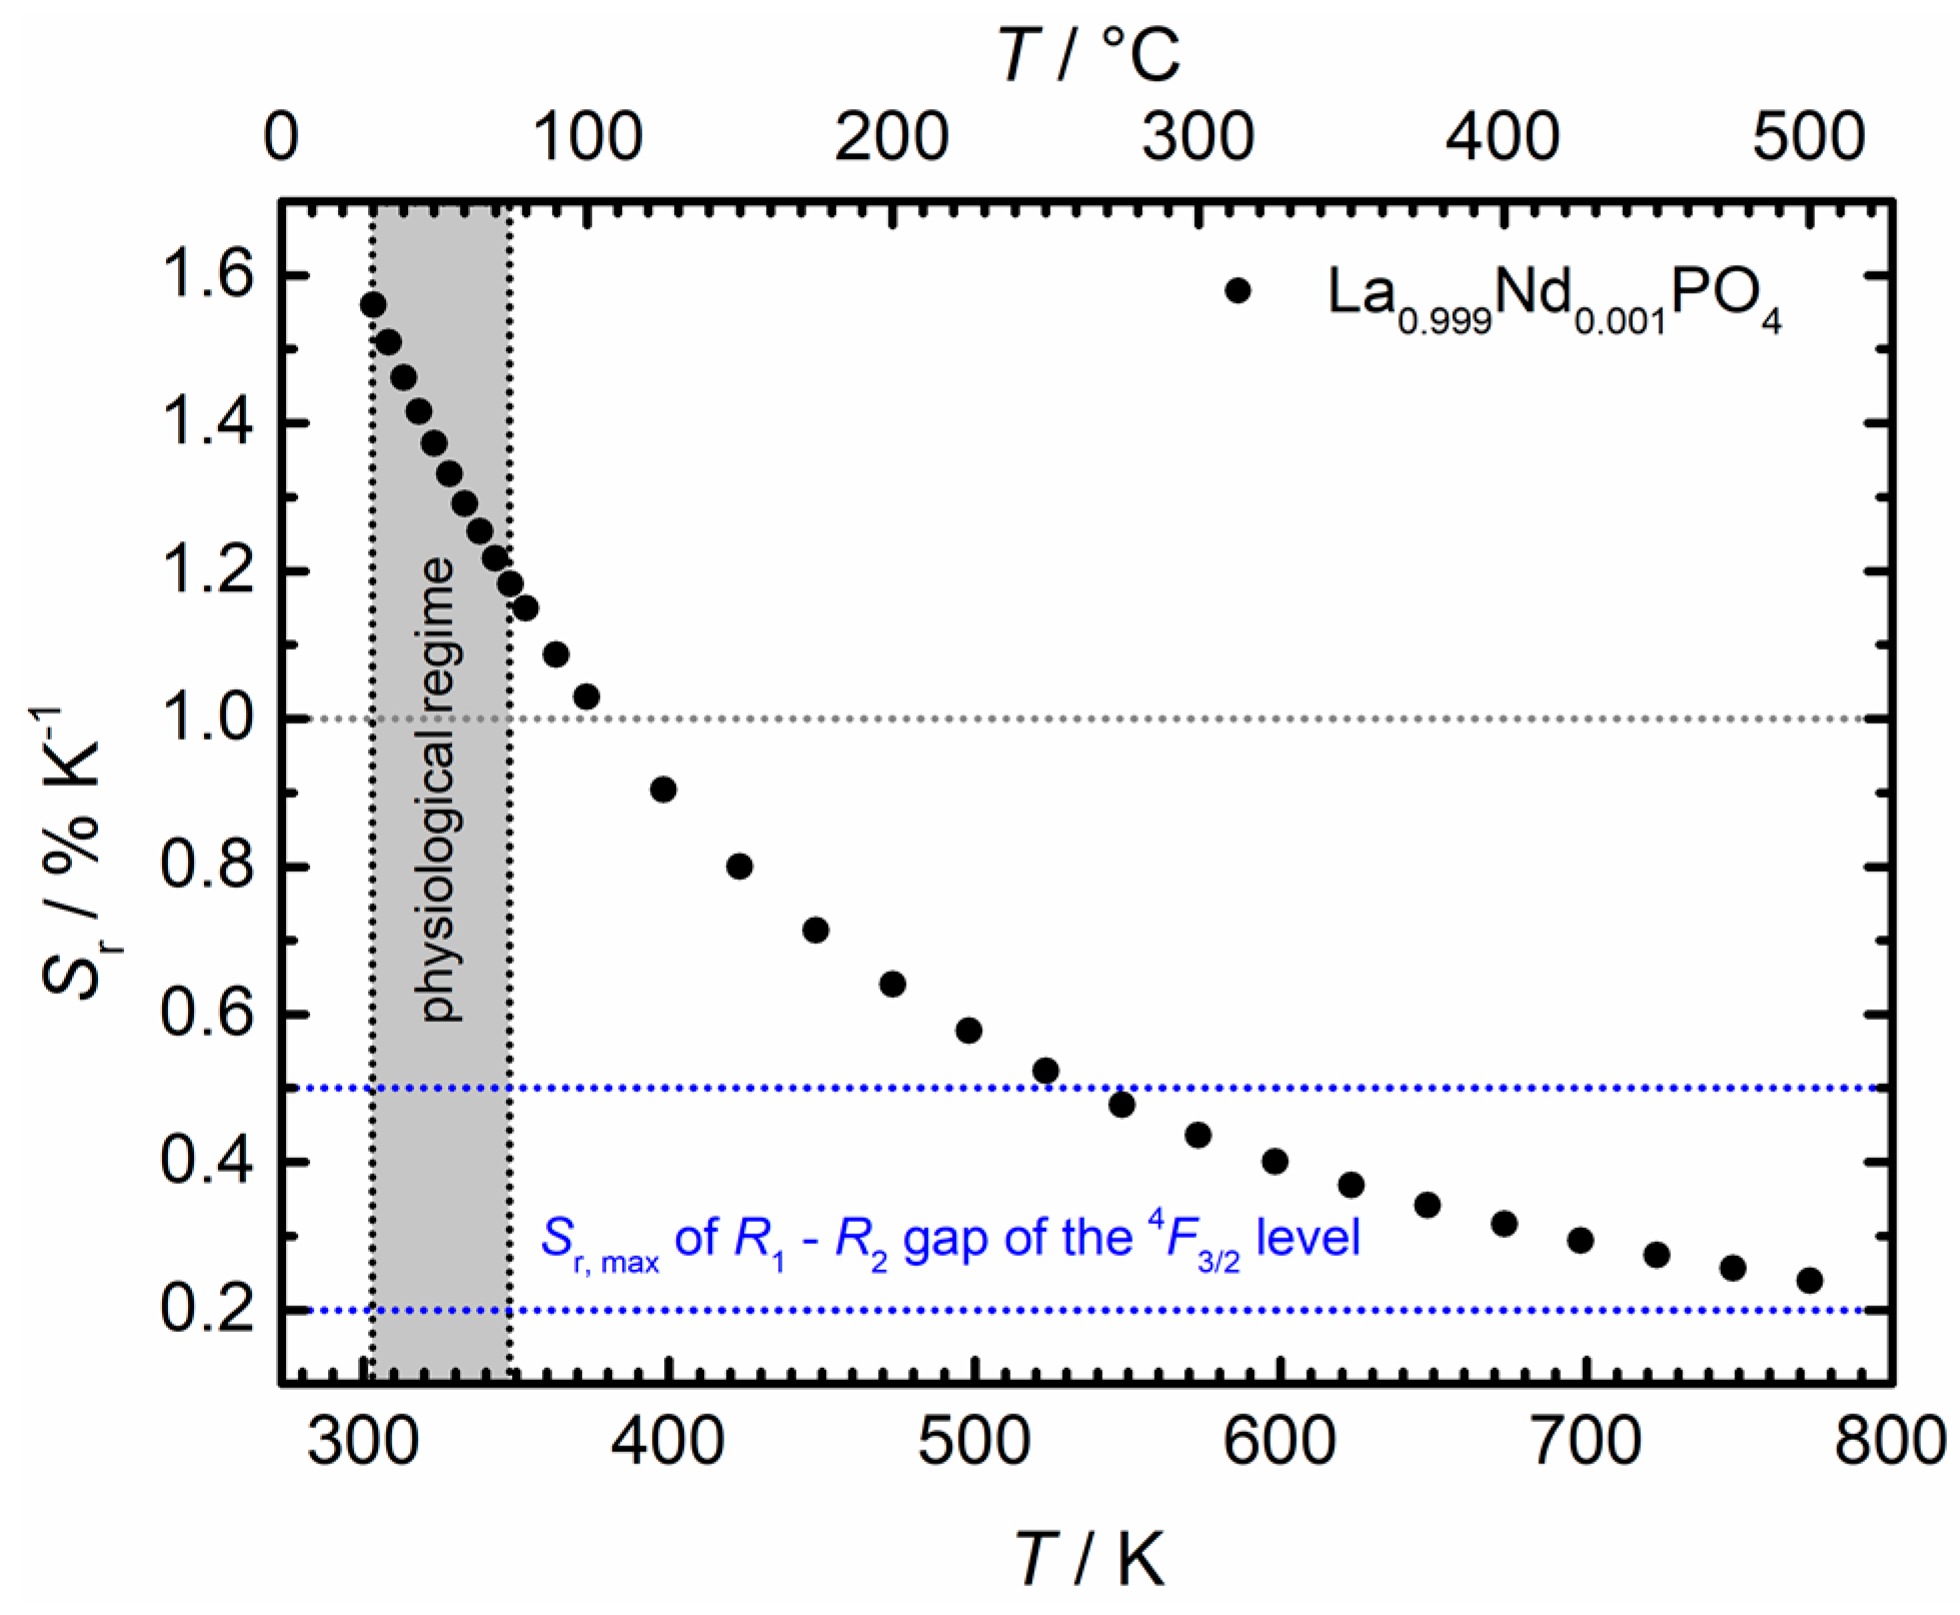
Since thermodynamic equilibrium between the
4F5/2 and
4F3/2 level of Nd
3+ is sustained over the full temperature range investigated (30 °C–500 °C) in La
0.999Nd
0.001PO
4, physiological temperatures are measurable by means of luminescence thermometry with that compound. As Boltzmann behavior is realized, the relative sensitivity
Sr (in % K
−1) of the luminescence thermometer is given by
Figure 10 depicts the evolution of the relative sensitivity for La
0.999Nd
0.001PO
4 as obtained from Equation (7). In particular, it is higher than 1% K
−1 for the full physiological temperature regime (30 °C–75 °C), which is practically difficult to achieve around room temperature with any single ion Boltzmann thermometer, especially in the NIR regime [
49,
50,
51,
57]. Typically, energy transfer-based thermometers are used in those cases [
30,
43,
54,
55] for which the underlying thermometric mechanisms are often not well established. The present results show promising potential of Nd
3+ for physiological temperature sensing by means of luminescence thermometry, if the boundary conditions for the validity of a Boltzmann equilibrium are met which requires low Nd
3+ concentrations. The
4F5/2–
4F3/2 spin-orbit gap in Nd
3+ gives rise to relative sensitivities that are an order of magnitude higher than the typically found ones in the range of 0.25% K
−1 [
50]. A disadvantage of the presented thermometric concept of Nd
3+ is the rather low intensity of the
4F5/2 →
4I9/2 emission that can give rise to a higher relative intensity uncertainty, depending on the sensitivity of the detection system. Since it is the temperature uncertainty that matters in a well performing luminescence thermometer, both the relative sensitivity and emission intensities have to be optimized.

 ,
, 


