1. Introduction
Patients presenting with balance insufficiency or vestibular hypofunction may be at risk for injuries from falling. Fall injuries resulted in 31 billion dollars of annual health care expenditures and income losses in the United States alone [
1,
2]. From a clinical standpoint, the correlation between vestibular hypofunction and fall risks is readily apparent. It is the standard of care that all patients with diagnoses of peripheral weakness should be advised of fall risks and referred for vestibular rehabilitation [
3]. The mechanism underlying balance instability predisposing an individual to falling is multifactorial, with muscular, neurologic, or visual etiologies. The ability to differentiate patients with balance insufficiency or vestibular hypofunction versus individuals with normal gaits is important to identify patients at risk for falling. Consequently, the development of predictive classifiers to achieve such identification would be desirable in alerting clinicians to take preventive measures and prophylactic treatment to mitigate fall risks, as well as to address the etiology of balance problems in patients earlier.
The measurement of gait has a long history, extending decades back to the develo** of image-based tracking of walking motions [
4]. Historically, gait measurement was relatively cumbersome, involving a number of parameters including kinetic analysis of joint movements through automated tracking systems and measurements of energy consumption [
5]. A central consideration in gait analysis is determining the variables or features to measure in a walking motion. The feasibility of determining gait cycle phases from an accelerometer was established in [
6], and similarly the estimation of initial and terminal contact during walking from accelerometer measurements was demonstrated in [
7]. Similarly, the defining events in walking—heel strike, toe strike, heel-off, and toe-off—were automatically extracted, again using accelerometers [
8]. Such measurements of walking motions have been used to categorize gaits as normal or abnormal [
9]. Aside from the determination of gait phases or events, other studies have turned to direct measurement of angular velocity and linear acceleration in categorizing normal and abnormal gaits [
10].
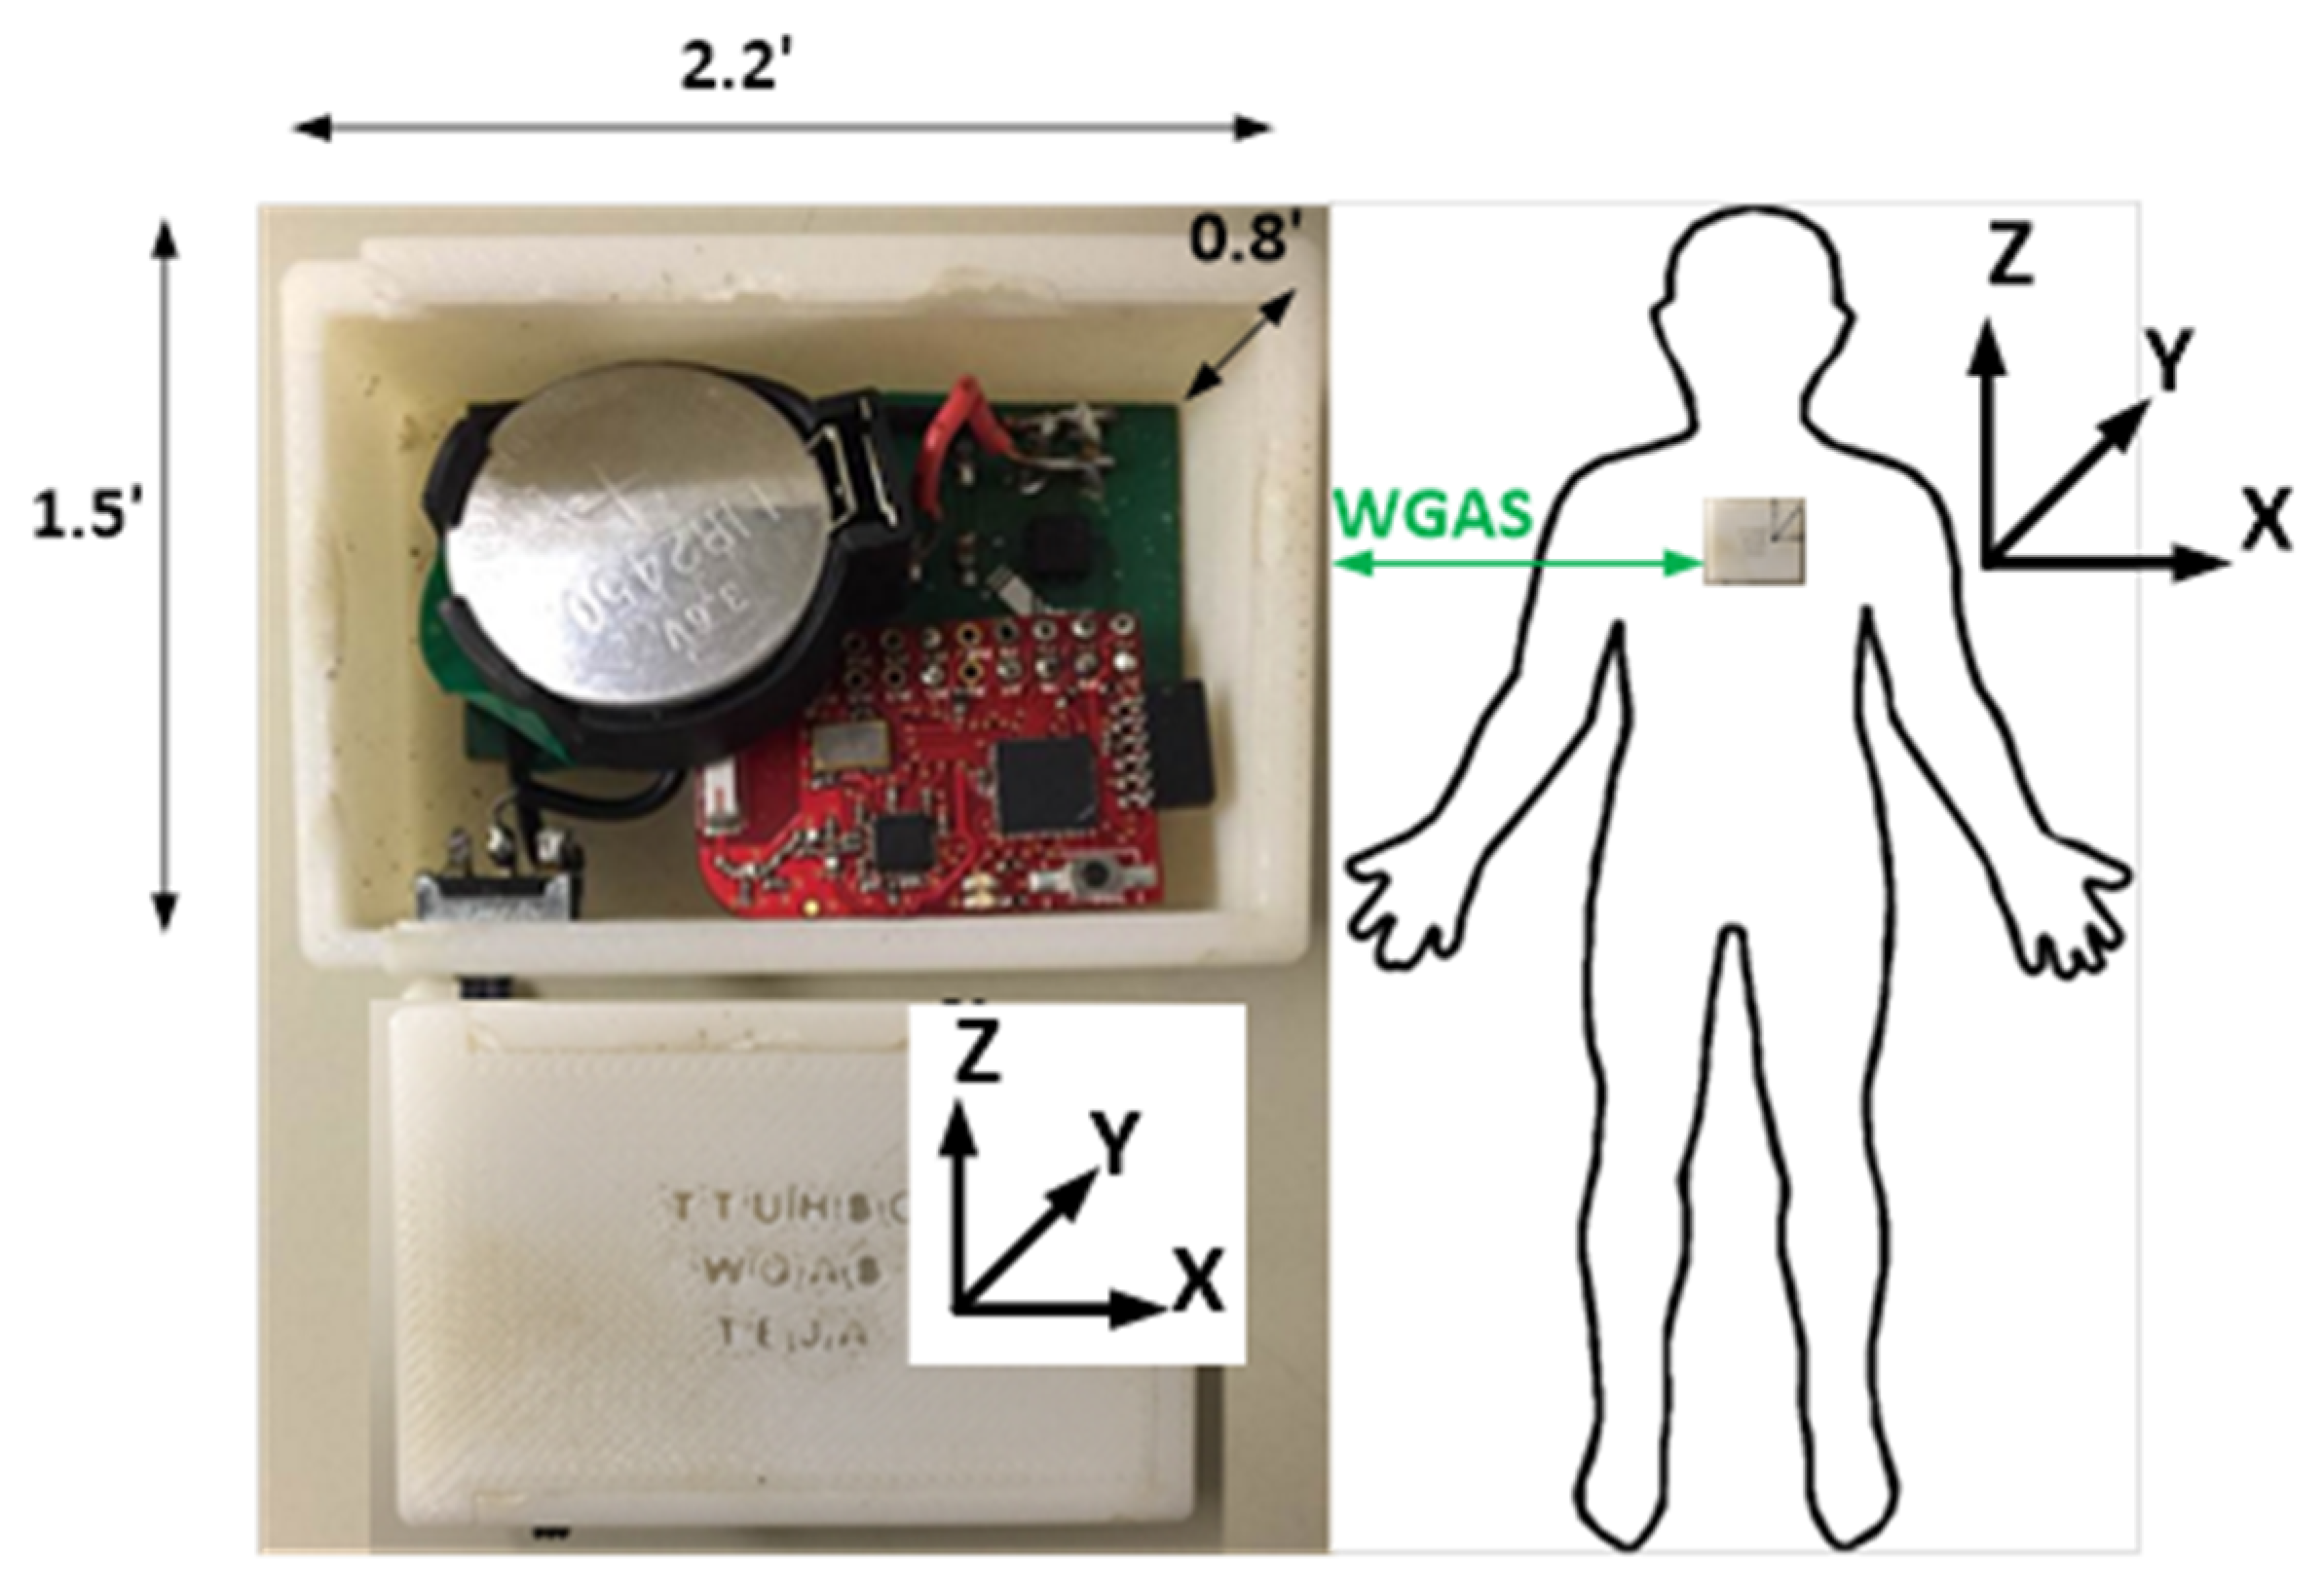
In our efforts to evaluate predictive modeling of fall risk, machine learning is applied to classify patients as having either a normal or abnormal gait on the basis of measurements from a small low-cost wearable wireless gait analysis sensor (WGAS). The WGAS is a noninvasive custom built device worn by each individual subject. The study group was divided into a cohort of healthy volunteers and patients referred for vestibular hypofunction. It is our understanding that many classifier platforms have been pursued in the past with promising outcomes. However, attempts to correlate with standard battery vestibular and balance tests (for example videonystagmography, caloric tests, rotary chair, or dynamic platform posturography) used in clinical settings have not been uniformly pursued. The long-term aim is to determine the applicability of WGAS for fall prediction using classifiers that demonstrate high performance on the patient cohort, thus suggesting that accurate predictions would be made on patients presenting for evaluation of vestibular hypofunction.
3. Results
The wireless gait analysis sensor (WGAS) collected data from a total of 60 subjects performing six dynamic gait index (DGI) tests. Study demographics are summarized in
Table 3. Ten patients were known to have abnormal gaits and the remaining fifty had normal gaits. The patient cohort included adults with or without diagnosed horizontal semicircular canal and otolith dysfunction (vestibular loss). They ranged in age from 21 to 80 years with an average age of 51.8 years. Thirty-eight (63%) of the individuals were female. Subjects walked for a total of 20 feet (6.1 m) while performing gait movements to assess their balance and therefore potential risk for falling, as listed in
Table 2 above. As not all subjects completed every possible DGI condition, there were ultimately 319 samples across all subjects performing a particular DGI test, 59 of which corresponded to an abnormal gait.
The range of linear acceleration, , and range of angular velocity, , in each of the x, y, and z axes (Equations (1) and (2) above) from the output of WGAS worn by each subject represent the six features used to distinguish normal from abnormal gaits. In a clinical setting, the data transmitted by the WGAS is essentially a vector of real-valued voltages, so the minimum and maximum voltages are easily and quickly calculated from the WGAS output. The classifiers trained to predict gait instability are not dependent on the age or other demographic features of the subjects.
3.1. Feature Extraction Separates Normal from Abnormal Gaits
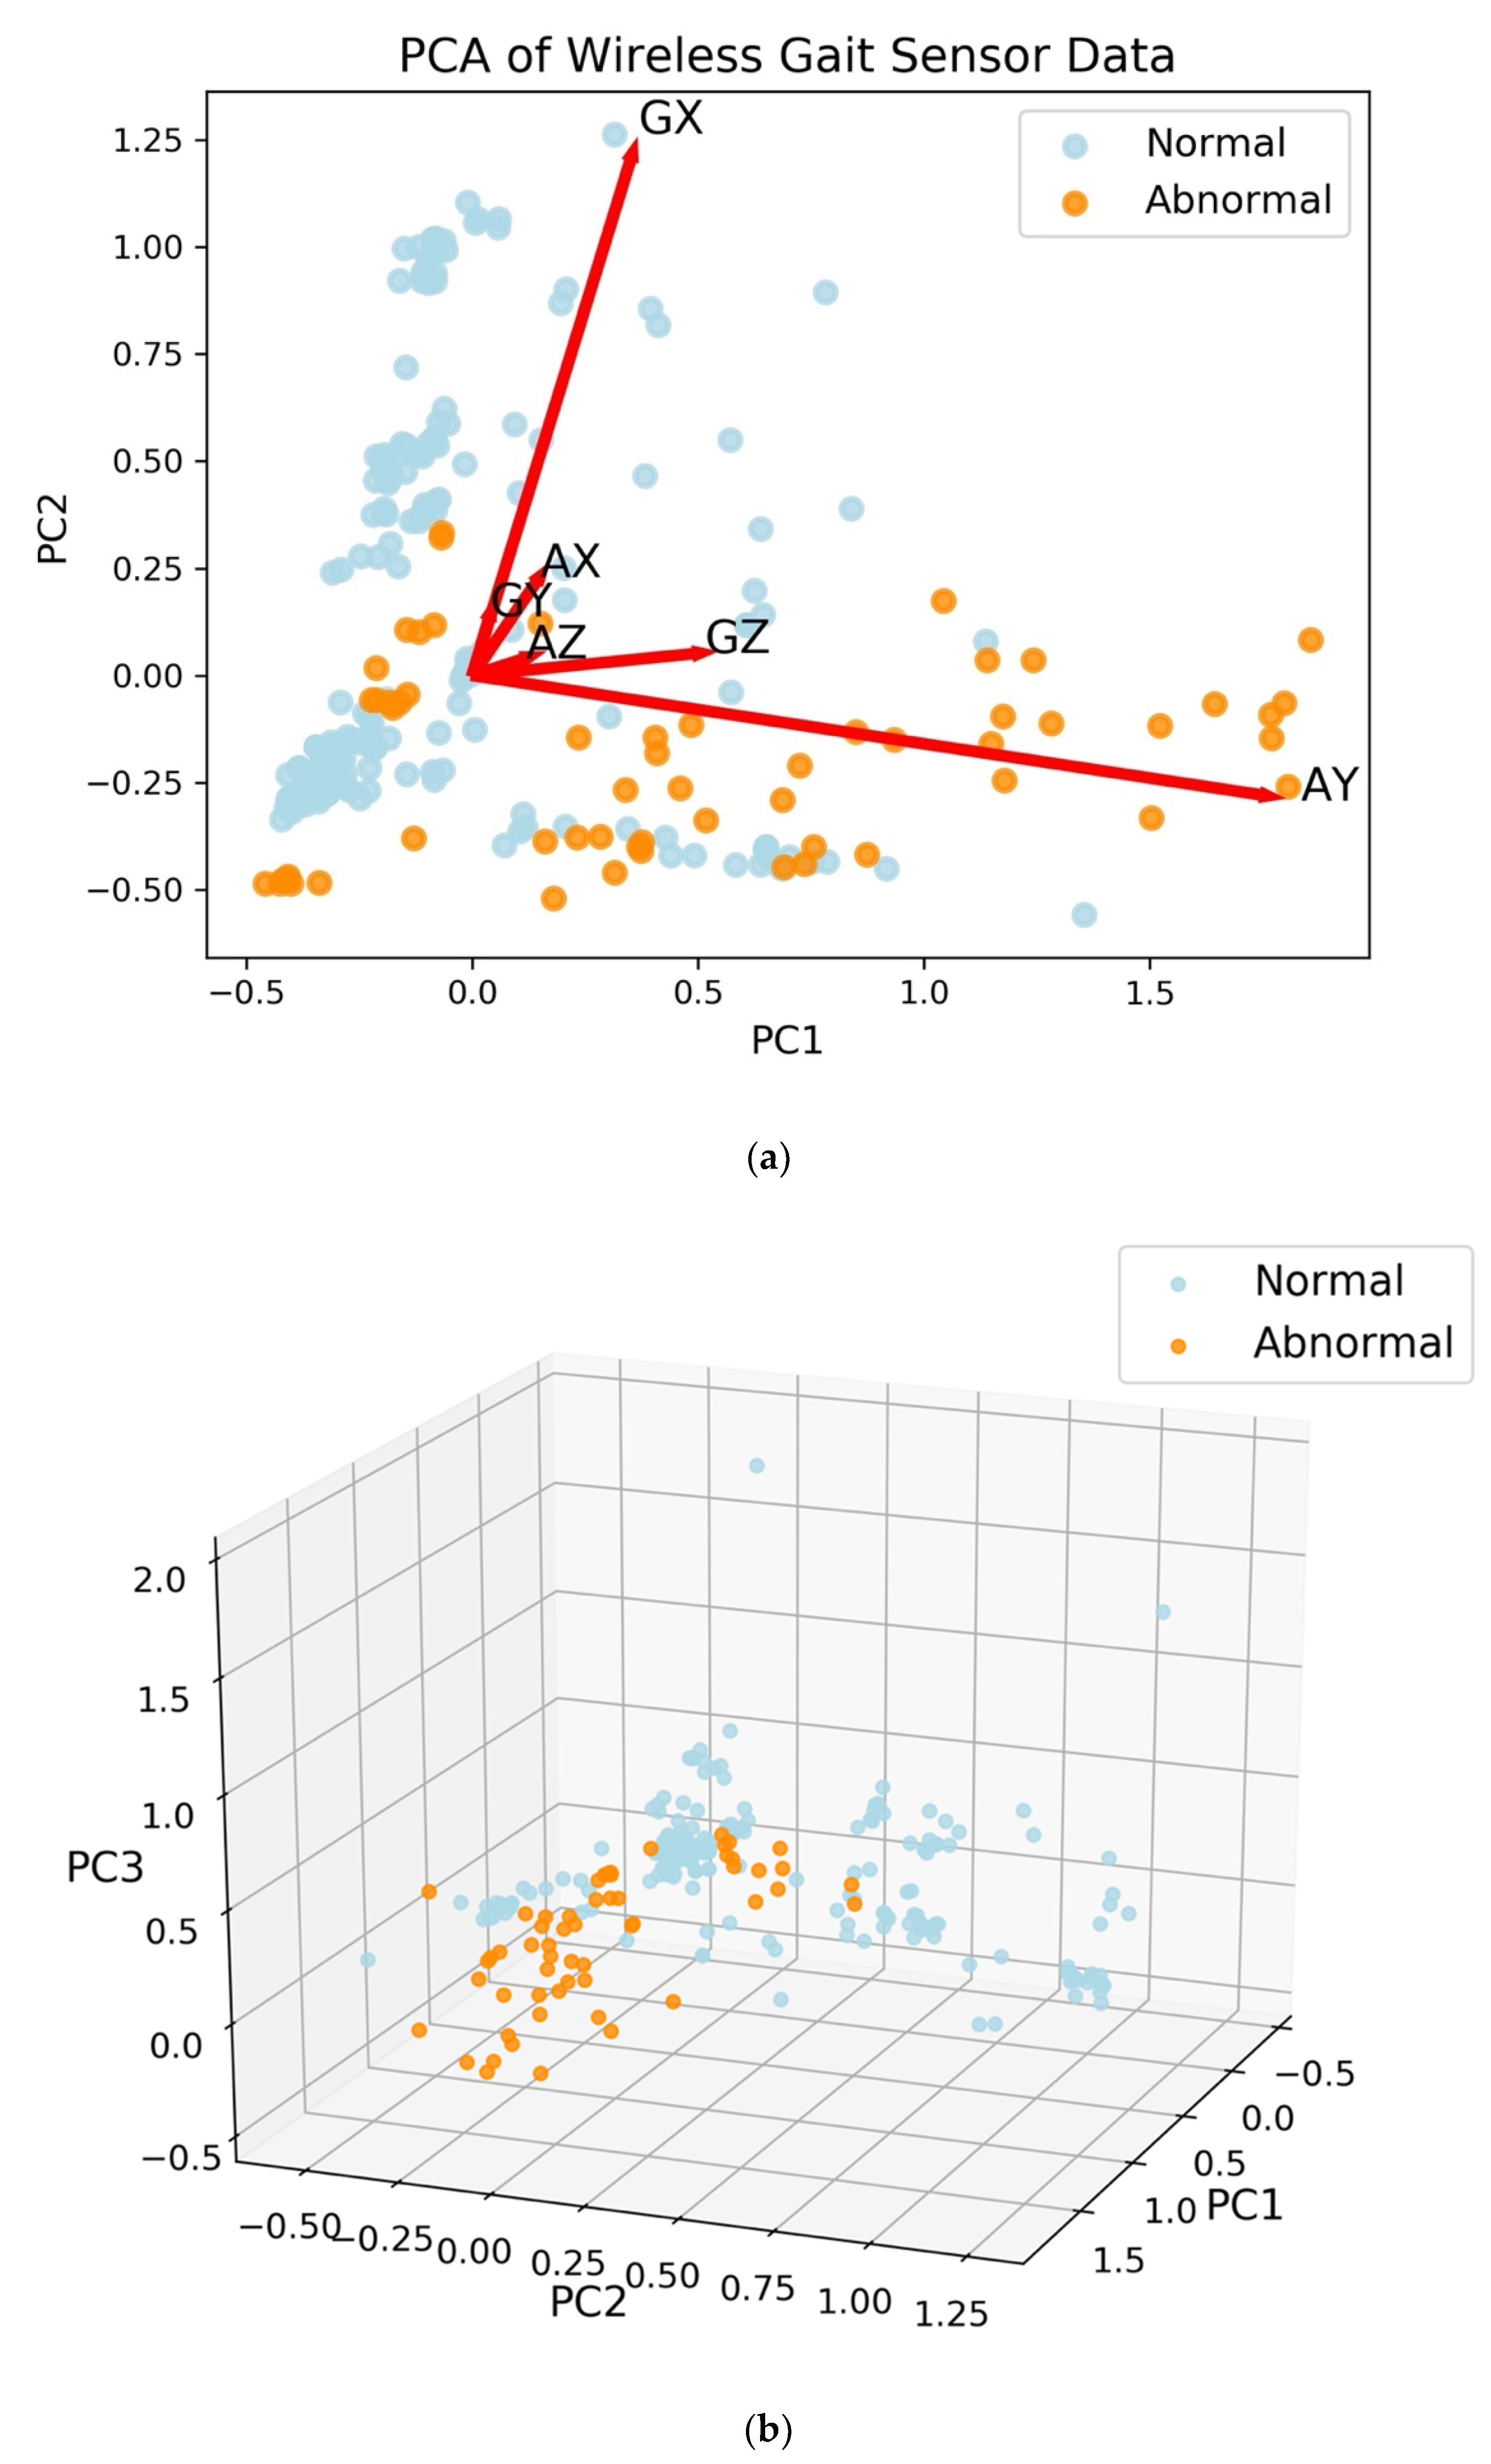
The first two principal components (PCs) from PCA were able to describe approximately 83% of the variance of the data. The largest loading for the first principal component is 0.94 for AY, which is the linear acceleration on the
y-axis (i.e., the acceleration along patient’s forward movement direction during the DGI tests), with the next largest loading equal to 0.26 for GZ, the
z-axis angular velocity (i.e., the angular velocity along the azimuth axis) [
12]. The second principal component has the largest loading of 0.95 for GX, the
x-axis angular velocity. The third principal component has most of the weight on the
x-axis acceleration (AX) with a loading of 0.74, while the
y- and
z-axis angular velocities (GY and GZ) have loadings of 0.46 and 0.39, respectively. With three PCs, 94% of the variance of the data is explained. The projection onto two-dimensional space is shown with loading vectors in
Figure 2a. With three PCs, abnormal gaits are separated from normal gaits (
Figure 2b).
3.2. An Artificial Neural Network Classifies Abnormal and Normal Gaits with High Accuracy
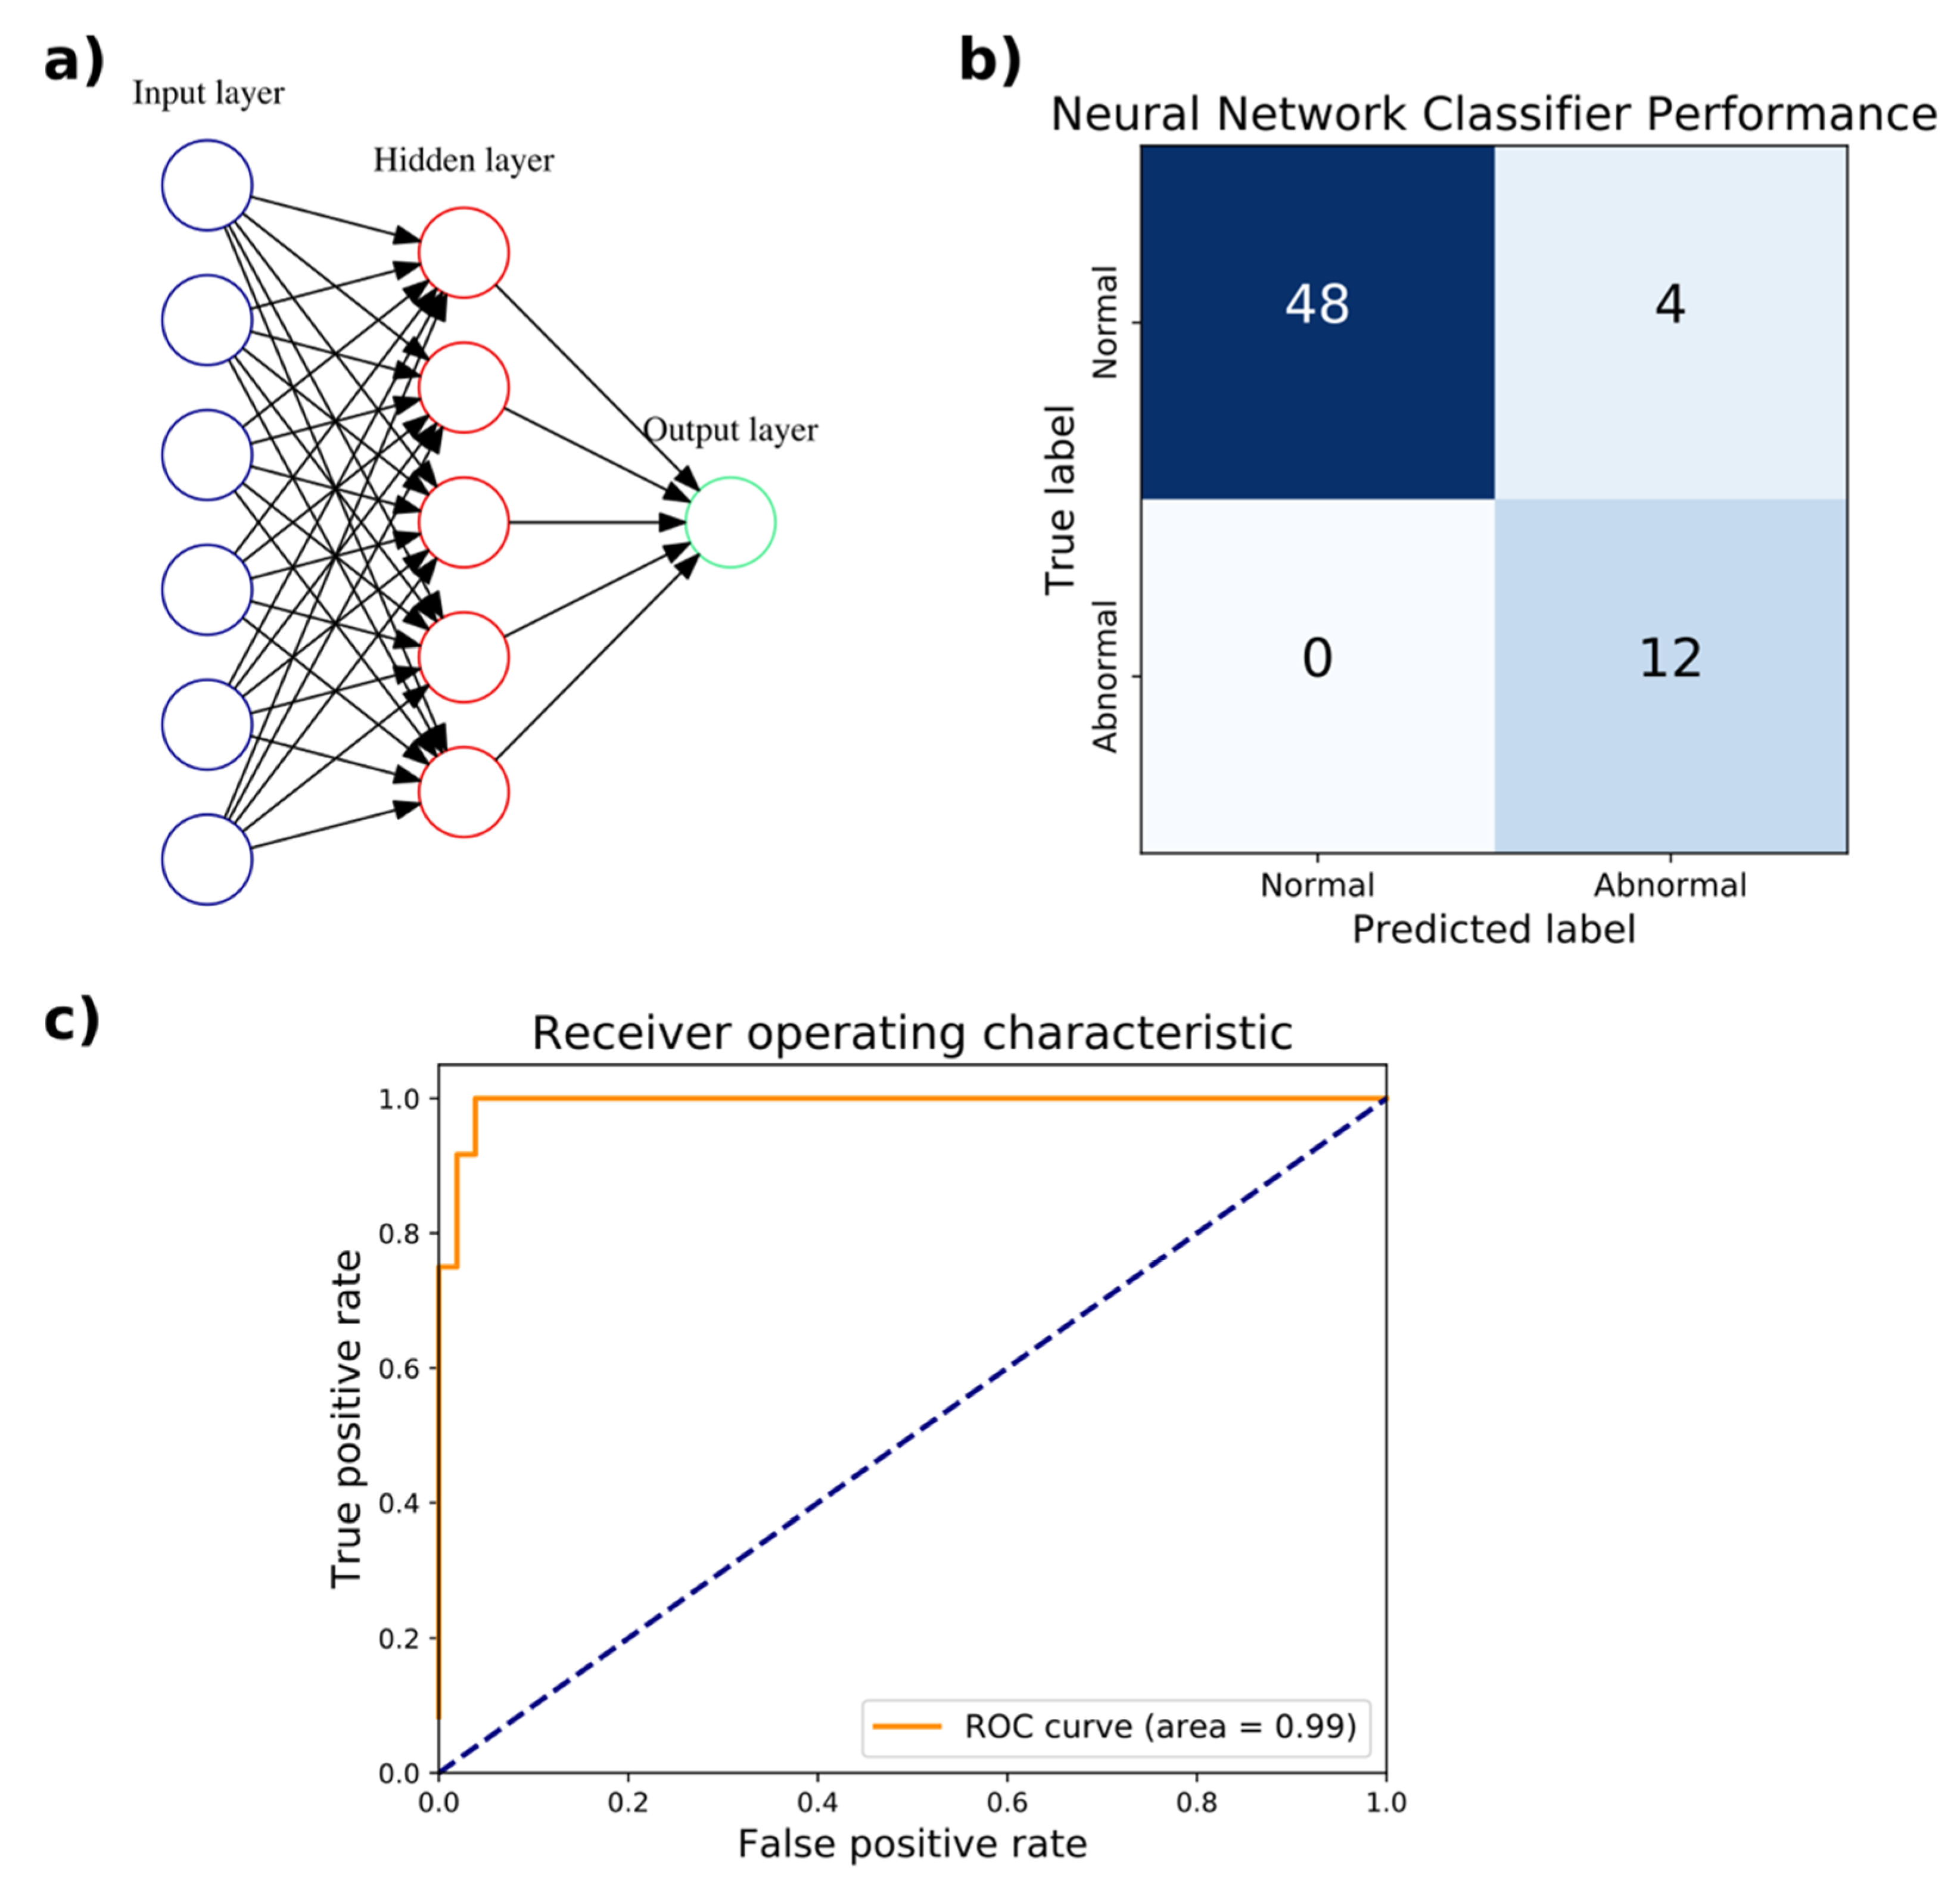
An artificial neural network (ANN) classifier was trained to distinguish normal from abnormal gaits with a random 80–20% train–test split of the WGAS dataset. The training set had 255 samples, 47 of which corresponded to an abnormal gait. The test set contained the remaining 64 samples, with 12 corresponding to an abnormal gait. As described above, each sample corresponds to a subject performing a single DGI test. The training split was further divided randomly 80–20% into a train–validation set for hyperparameter tuning. The input layer has six neurons for the six features from the linear acceleration and angular velocity in the three
x,
y, and
z axes. As a binary classifier, there is only a single output neuron. The hyperparameters optimized through 3-fold cross-validation (CV) were the number of hidden layers and number of neurons in each hidden layer. Based on the accuracy, F
1 score, and AUC, the optimal hyperparameter chosen was a single hidden layer consisting of five neurons, with an accuracy of 94.7%, F
1 score of 0.909, and AUC of 1.0. The performance of the hyperparameters evaluated in 3-fold CV is listed in
Table 4. On the test set, the accuracy achieved was 93.8% with a sensitivity of 100% and specificity of 92.3%. The AUC of the ROC curve was 0.99 (
Figure 3). The neural network classifier was implemented as a scikit-learn MLPClassifier object, which has a memory usage of 56 kilobytes. The wall clock time of the trained model for executing predictions averaged 65 µs over 7 runs of 10,000 iterations each.
3.3. A Support Vector Machine Yields Excellent Performance in Gait Classification
In addition to ANNs, support vector machines (SVM) were trained to distinguish abnormal versus normal gaits using the identical train and test sets for the ANNs above from the 80–20% split of the WGAS dataset. The penalty parameter of the error term and choice of kernel were among the hyperparameters optimized through 3-fold cross-validation (CV) on the training set. Based on the accuracy and AUC, the optimal hyperparameters chosen were radial basis function with a kernel coefficient γ = 0.1 and penalty parameter of the error term
C = 1000. In CV, these hyperparameters achieved an accuracy of 96.1% and AUC of 0.968. The performance of the hyperparameters evaluated by 3-fold CV is listed in
Table 5. On the held-out test set, the accuracy achieved was 96.9% with a sensitivity of 100% and specificity of 96.1%. The AUC of the ROC curve was 0.98 (
Figure 4). The SVM was implemented as a scikit-learn GridSearchCV object, which has a memory usage of 22 kilobytes. The wall clock time of the trained model for executing predictions averaged 129 µs over seven runs of 10,000 iterations each.
3.4. Feature Extraction Allows for High-Performance Classification
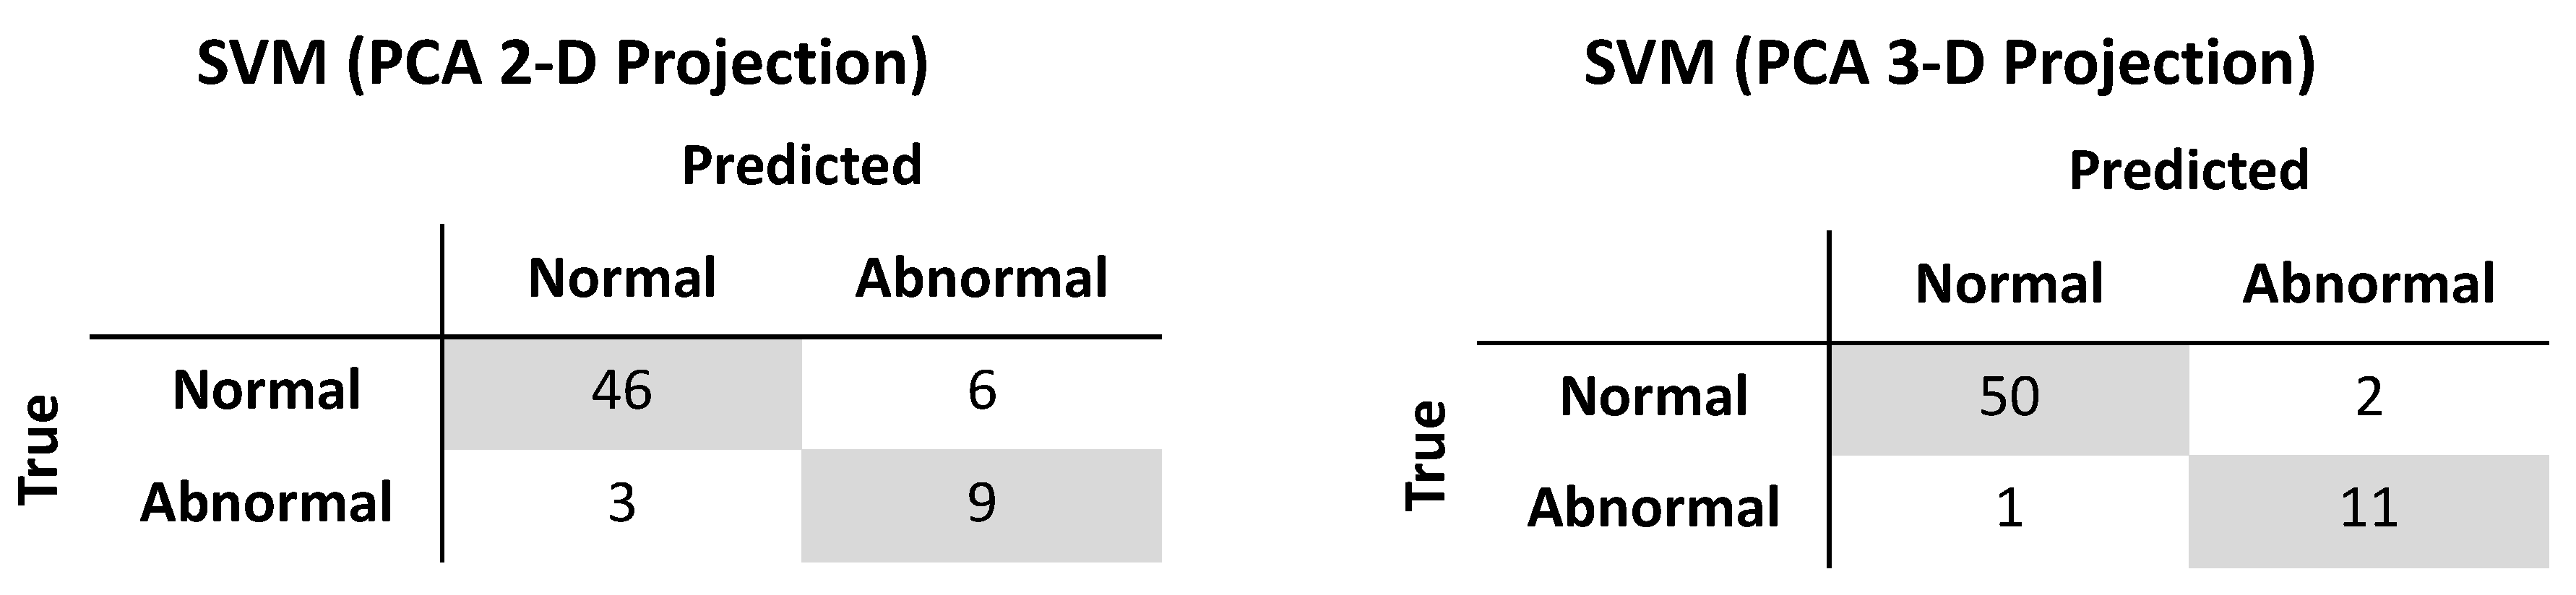
It was shown earlier that PCA could reduce the dimensionality of the gait features from six to two or three while still capturing 83% or 94% of the variance, respectively. Using similar methods as described above, a radial basis function SVM (γ = 10, C = 10000) trained on the two-dimensional reduced feature set produced an accuracy of 85.9%, sensitivity of 75.0%, and specificity of 88.5% on the test set. When trained on the three-dimensional reduced feature set, the accuracy, sensitivity, and specificity of a radial basis function SVM (γ = 10, C = 100) were 95.3%, 91.7%, and 96.2%, respectively (
Figure 5). The wall clock times for test set prediction of the classifiers trained on two and three dimensions averaged 115 µs and 124 µs, respectively, over seven runs of 10,000 iterations each. The memory usage of the classifiers trained on two and three dimensions were 27 and 28 kilobytes, respectively.
4. Discussion
In this study, the machine learning techniques achieved successful classification of abnormal and normal gaits in a large cohort of individuals wearing a WGAS. Compared to an ANN classifier, an SVM model demonstrated, in general, somewhat superior performance in terms of overall accuracy, sensitivity, and specificity. All classifiers were evaluated on the same test set. It was vital that a high true negative rate was shown, as clinicians and patients would certainly desire to avoid preemptive treatment for vestibular hypofunction when, in fact, no such pathology was truly present. In a similar vein, a high true positive rate is clearly desirable, as it is important to treat those who definitively have balance problems to mitigate or prevent falls. The patient cohort examined in this study had class imbalance, meaning that there were far more individuals with normal gaits than those with abnormal gaits. Such a distribution may mirror an actual patient population encountered in the clinic. On the other hand, if there had been more subjects with abnormal gaits than those with normal gaits, we would expect ANN and SVM to still yield high classifier performance using the same class balancing techniques from this study. In any case, the SVM and ANN classifiers evaluated here were robust to class imbalance in real-time, after adjusting for such factors. With a larger number of subjects, it is possible that the performance of a newly trained ANN classifier will increase in performance and exceed that of a similarly trained SVM. However, based on the results presented here, an SVM would still be expected to maintain high performance.
Another aspect of predicting individuals at risk involves identifying or engineering the features that are central to the prediction―often referred to as feature selection or feature extraction. Here, PCA on the WGAS data yielded loading vectors that when visualized in two dimensions show the relative contribution or weighting of each feature to the PCs. In the biplot shown in
Figure 2, the first PC has most of the weight on the
y-axis linear acceleration (AY), which is parallel to the direction of travel. The second PC corresponds to GX, which is the angular velocity in the
x-axis as measured by the gyroscope. Moreover, AY and GX are far apart in the biplot and hence are less correlated with one another. With an even larger clinical sample across more diversified vestibular pathologies and less noise in the data, we expect PCA should be able to provide useful feature extraction from better class separation.
Dimensionality reduction with PCA allowed for classification performance approaching that of the full dimensional data. Specificity of classification upon projection by PCA onto a three-dimensional subspace was identical to classifying on the full dimensional data. The difference in performance came from the sensitivity: when retaining three PCs, only one patient with abnormal gait was misclassified while classification on the full dimensional dataset had perfect sensitivity. As expected, classification performance by SVM increased when retaining three PCs compared to retaining two PCs. Interestingly, dimensionality reduction did not lead to improvements in memory usage, and while execution time of predictions were shorter, the gains were modest: an improvement of 11% and 4% with two and three PCs, respectively. The use of PCA necessitates the storage of the projection matrix to project the test set or any new data onto the lower dimensional subspace, which may account for the observed memory usage.
Previous studies of gait analysis have focused on identifying phases and defining events in walking motions [
4,
5,
6,
7,
8,
9]. For example, Ihlen et al. derived phase-dependent measures of local dynamic stability from 3-D acceleration data on activities of daily living over three days. Using a partial least-squares discriminant analysis, they were able to classify fallers and nonfallers with an AUC ranging from 0.83 to 0.93, depending on the features included in classification [
21]. In another approach, Bizovska et al. also employed inertial sensors and demonstrated improved predictive power for fall risk (AUC 0.755) when combining clinical features with measures of local dynamic stability, compared to local dynamic stability alone (AUC 0.673) [
22]. Hemmatpour et al. utilized the accelerometer and gyroscope sensors built into smartphones to predict abnormal gait with high accuracy (93.5%) [
23]. Here, the feasibility of utilizing direct measurements in real-time to extract simple features (ranges of linear acceleration and angular velocity) from gyroscopes and accelerometers to classify normal and abnormal gaits is demonstrated. Our SVM classifier achieved high predictive performance (96.9% accuracy, 100% sensitivity, and 96.1% specificity). Other studies have also focused on employing such features in gait classification, but have only focused on a small number of patients [
13]. In order for fall prediction to transition to clinical use, a larger cohort of patients must be studied. Sixty patients participated under various DGI tests in this study to yield more than 300 gait samples, far greater than the seven patients previously examined, yet the SVM and ANN here still mirrored a similar degree of classification performance [
13]. In [
13], ANNs outperformed SVMs, while here we find SVMs to be the superior classifier. The SVM has lower memory usage than the ANN while taking longer to perform predictions. Both classifiers have minimal memory requirements and are capable of performing real-time gait classification from WGAS. Yet the issue of feature selection of extraction in gait measurement still remains. Howcroft et al. evaluated various feature selection techniques, including correlation-based feature selection, fast correlation-based filter, and Relief-F, and utilizing a SVM classifier achieved 78% accuracy, 26% sensitivity, and 95% specificity [
24]. Feature extraction through PCA is shown here to potentially resolve the features that contribute most to differentiate normal from abnormal gaits, as using PCA as a preprocessing step for SVM yielded high predictive performance (95.3% accuracy, 91.7% sensitivity, and 96.2% specificity). More studies are needed to address vestibular hypofunction in the geriatric population and characterize the benefit of a gait analysis sensor in detecting gait differences in this population [
25,
26]. As a step in this direction, we have included older age individuals in our study. We also quantified vestibular hypofunction using clinical objective testing that allows one to diagnose even mild vestibular dysfunction that may result in functional gait disruptions.
While this study reports the prediction of abnormal from normal gaits on a large patient cohort, clinical trials will be necessary to further transition machine learning-based fall risk prediction into the clinic, particularly as asymmetric peripheral vestibular function does not necessarily imply balance deficit or pathology. The results of this study are preliminary as the methodology described here will need to be further validated on an even larger number of patients. Furthermore, predicting and testing patients for vestibular hypofunction does not necessarily cover all mechanisms of falling, for example from muscular, neurologic or visual deficits. In the future, it may be interesting to perform a train–test split for machine learning such that an individual’s data for all six DGI tests are kept entirely together in either the train or test set, instead of possibly being split across both. Such an approach would be relevant to the case when patients are evaluated in the clinic by conducting all DGI tests together. It would also be interesting to move beyond binary predictions (normal vs. abnormal) to continuous predictive scores and investigate fall risk stratification according to the predicted probability of falling. Moreover, the performance of other statistical learning models other than SVMs or ANNs would be informative, such as with dynamic time war** on WGAS data, given its applicability to time series and use in varied fields from finance to medicine [
27]. Future directions may include comparison of WGAS fall risk assessment with standard clinical vestibular testing. With an aging demographic in the United States, the potential of reducing and preventing fall injuries provides a compelling application for brining data-driven predictive analytics into the clinic.


