1. Introduction
Silicon Photomultipliers (SiPMs) are photo-electronic devices, which are gaining more and more importance, able to detect single photons and to allow the measurement of weak optical signals [
1,
2]. The device can be used in several applications, such as in 3D image sensors [
3,
4], in gamma spectroscopy [
5,
6,
7,
8], with particular emphasis in positron emission tomography (PET) [
9,
10,
11,
12,
13,
14], and, more recently, in visible-light communication (VLC) [
15,
16].
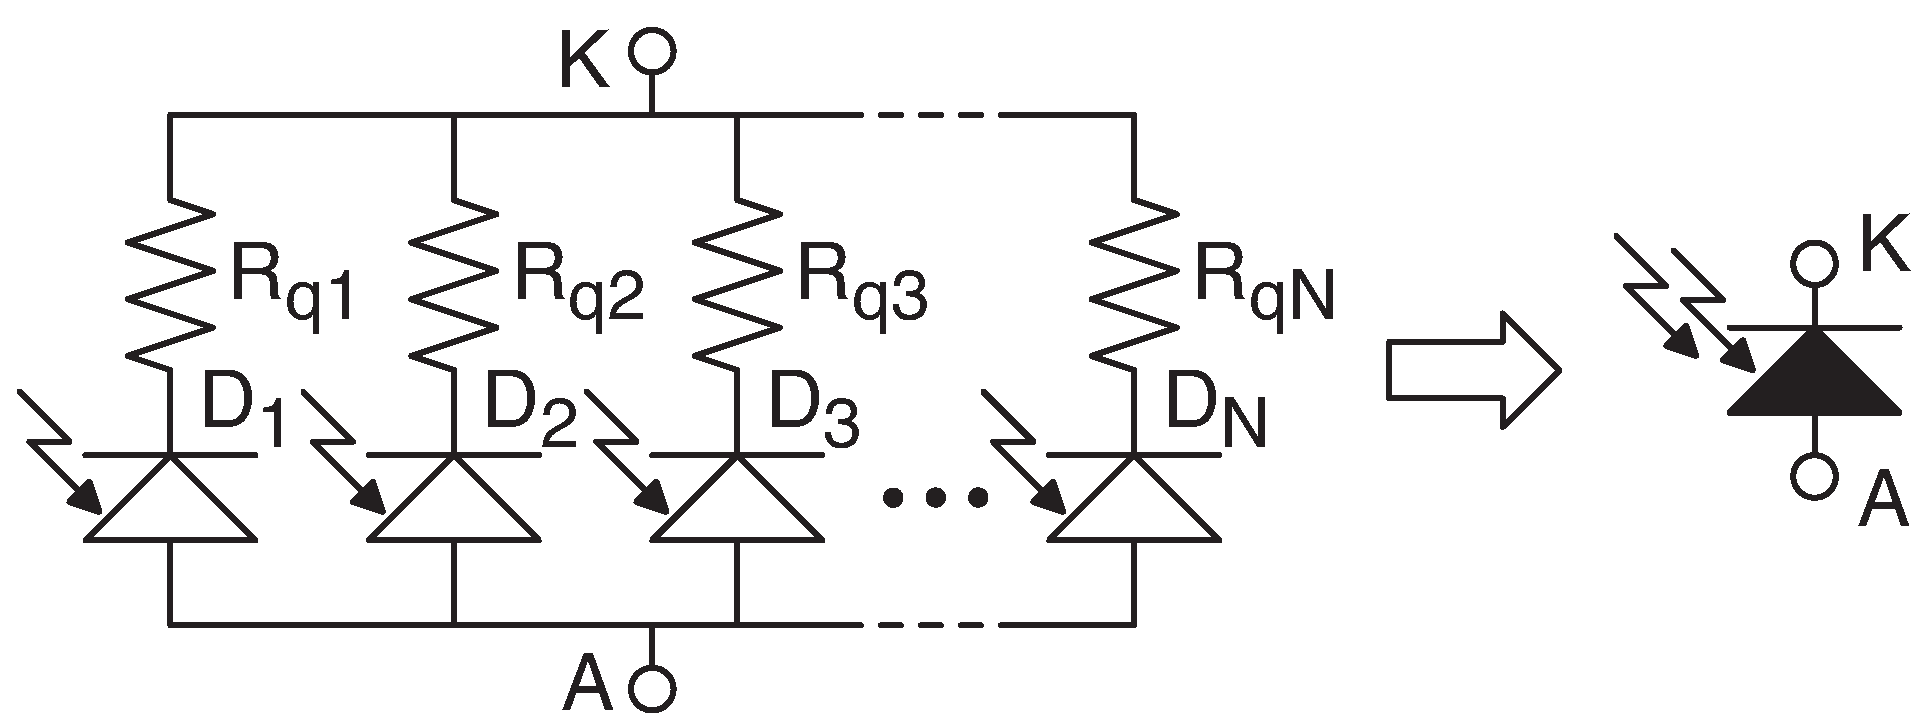
The SiPM is made up of
N parallel-connected avalanche photodiodes (APDs) operating in Geiger-mode. A quenching or ballast resistor is connected in series to each APD, as shown in
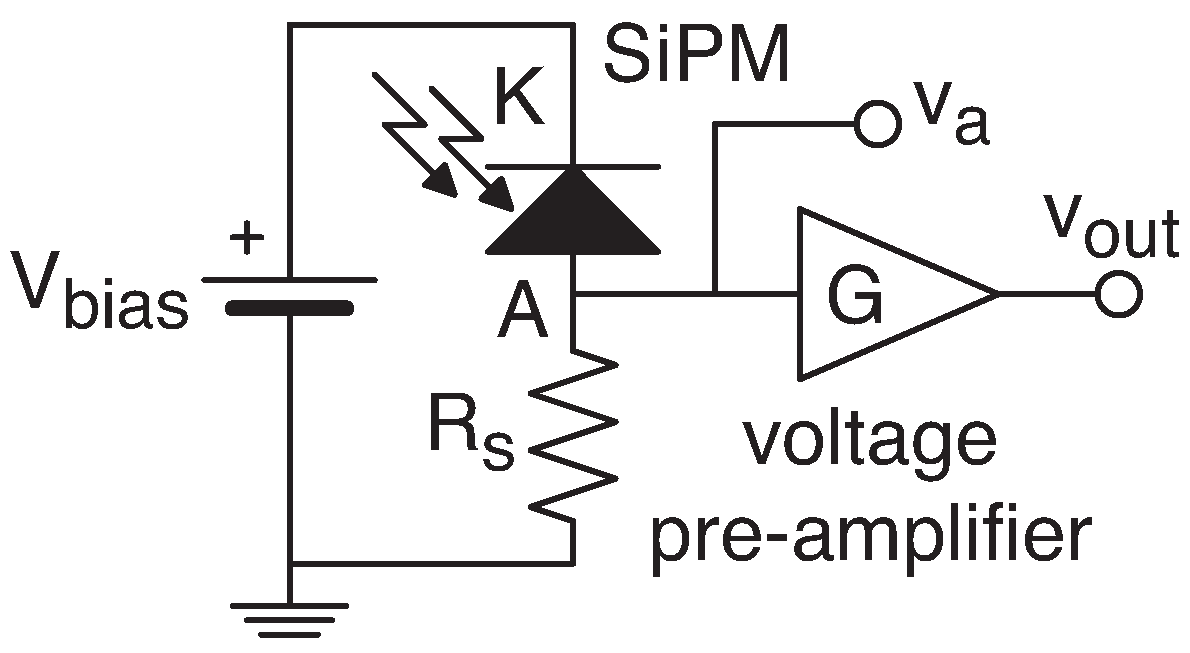
Figure 1. To detect optical signals, the SiPM requires a biasing and a read-out circuit, as shown in the simplified diagram in
Figure 2. In its idle condition, no current crosses the device, and voltage
sets the SiPM operating point at a voltage which, usually, is 10–20% higher than its breakdown voltage,
. A photon im**ing on the active surface of the
i-th APD can induce an avalanche current pulse,
, which is amplified to the output node as a voltage pulse,
. If more photons induce
k avalanche currents in
k different cells, the SiPM will produce a net current pulse proportional to the superposition of
k elementary cells with the (ideal) final result of having the output voltage pulse
In principle, the resulting photosensor is capable of discerning and counting the occurrence of single photons in a pulse of light. In reality, the ideal response of a SiPM in (
1) is altered by several sources of noise, such as dark-count, after-pulsing and optical crosstalk. Furthermore, the counting properties or the noise rejection strongly depends on the front-end electronics used to detect the avalanche process.
In this context, transistor-level simulations that examine the interaction between the SiPM device and the remaining components (biasing and read-out circuits) greatly help the designer. Hence, having a reliable electrical model of the SiPM with the possibility of including its noise characteristic, becomes an important aspect of the design phase.
In this paper, we propose an interesting SiPM model that exploits the Verilog-a behavioral language and is appropriate to transistor-level circuit simulations. The photon detection of a single cell is modeled using the traditional electrical model, but the detection of photons in more than one cell is also covered. A statistical model is included to describe the SiPM noise caused by dark-count or after-pulsing effects (The optical crosstalk was not implemented in our model, as it is negligible with new technology processes. However, our Verilog-a model can be extended to include crosstalk effects easily.). After a brief description of the traditional SiPM modeling, we discuss the basic theory of the proposed model in
Section 3 and
Section 4.
Section 5 introduces a procedure for extracting the parameters of the SiPM model from a proper set of measurements. The Verilog-a implementation is discussed in
Section 6. Finally, the Verilog-a model and the extraction procedure are validated in
Section 7. The conclusions are discussed in
Section 8.
2. Traditional SiPM Device Modeling
The literature reports different electrical models for the APD that constitutes the matrix of a SiPM. One of the first electrical models was introduced in [
17] and used SPICE to describe the APD as the parallel connection between a capacitor and the series of a voltage source, a controlled switch and a resistor. The model was improved in [
18] where, using the Orcad PSpice, the self-quenching mechanism was emulated by means of three controlled switches. These kind of SPICE-like models have been used fruitfully to design active quenching-and-reset circuits (QRCs) for silicon photodiodes such as those reported in [
19,
20]. Other APD models used the Verilog-a description language to emulate the dynamic response, the self-quenching mechanism and even the statistical operation of the diode [
21,
22].
However, especially for large arrays, the simulation time can become prohibitively large if a complex model is used for each single APD of the matrix. Hence, a model resulting from the trade-off between accuracy and simulation speed must be used.
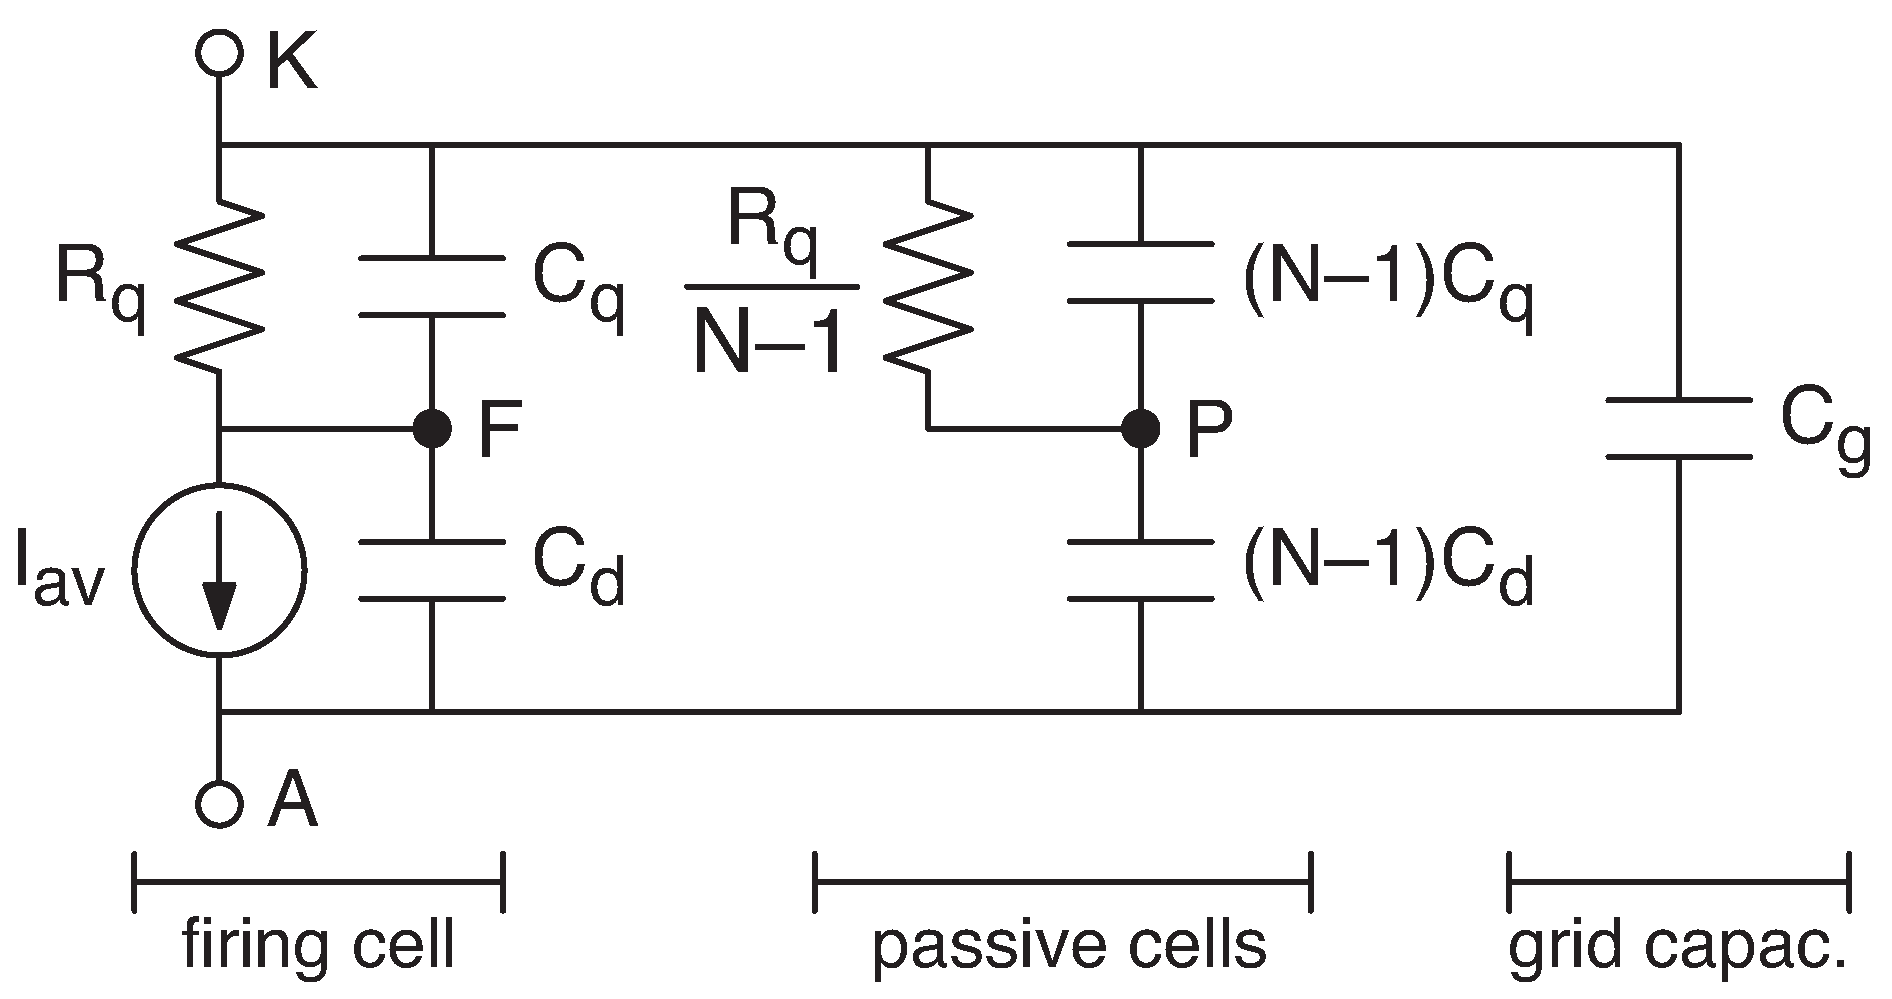
Figure 3 shows an accurate and widely accepted SPICE-like electrical model for the SiPM array. It was first introduced in [
23] and, afterwards, modified or enhanced. Specifically, some parasitic capacitors were added in [
24], the simultaneous firing of multiple cells was incorporated in the models in [
25,
26] and the read-out electronics were included in the model in [
27]. These SPICE-like models have been used successfully to design SiPM front-end circuits such as the current-mode front-end in [
28] or the fast read-out circuit in [
29].
The SPICE-like model is a good trade-off between accuracy and simplicity, but suffers from the following drawbacks:
- 1.
Several measurement steps are required for extracting the electrical parameters of the model, thus turning out in a cumbersome procedure [
24,
25,
30,
31];
- 2.
Since the photon arrival is emulated by the current generator,
, the model cannot self-quench the avalanche of the firing diode (specifically, either the designer uses a complex APD model, such as the one in [
18], or the APD model requires that the impulse of the avalanche current is calculated a priori);
- 3.
No statistical phenomena (i.e., dark-count or after-pulsing [
17]) are considered in the model.
The proposed model stems from the schematic in
Figure 3 and is appropriate to transistor-level circuit simulators. Moreover, differently from a SPICE-like model, it includes:
- 1.
Multiple concurrent firing cells;
- 2.
Avalanche self-quenching;
- 3.
Emulation of statistical phenomena (i.e., dark-count and after-pulsing effects).
The first two characteristics of the proposed model consent to emulate the situation of two photons that generate two avalanches in a very short interval of time. This correctly allows us to model the after-pulsing phenomena where a secondary avalanche triggers before the cell returns to its equilibrium state.
6. Verilog-a Model
We used the description language Verilog-a to implement the proposed SiPM model. Verilog-a is the analog extension of the well-known Verilog HDL (Hardware Description Language) [
39] and is a standard tool in industrial design environments for integrated circuits. More specifically, all the most widespread simulation tools (ELDO, HSPICE, SPECTRE, etc.) can perform mixed behavioral/transistor-level simulations that makes the proposed model appropriate to several simulation and design contexts.
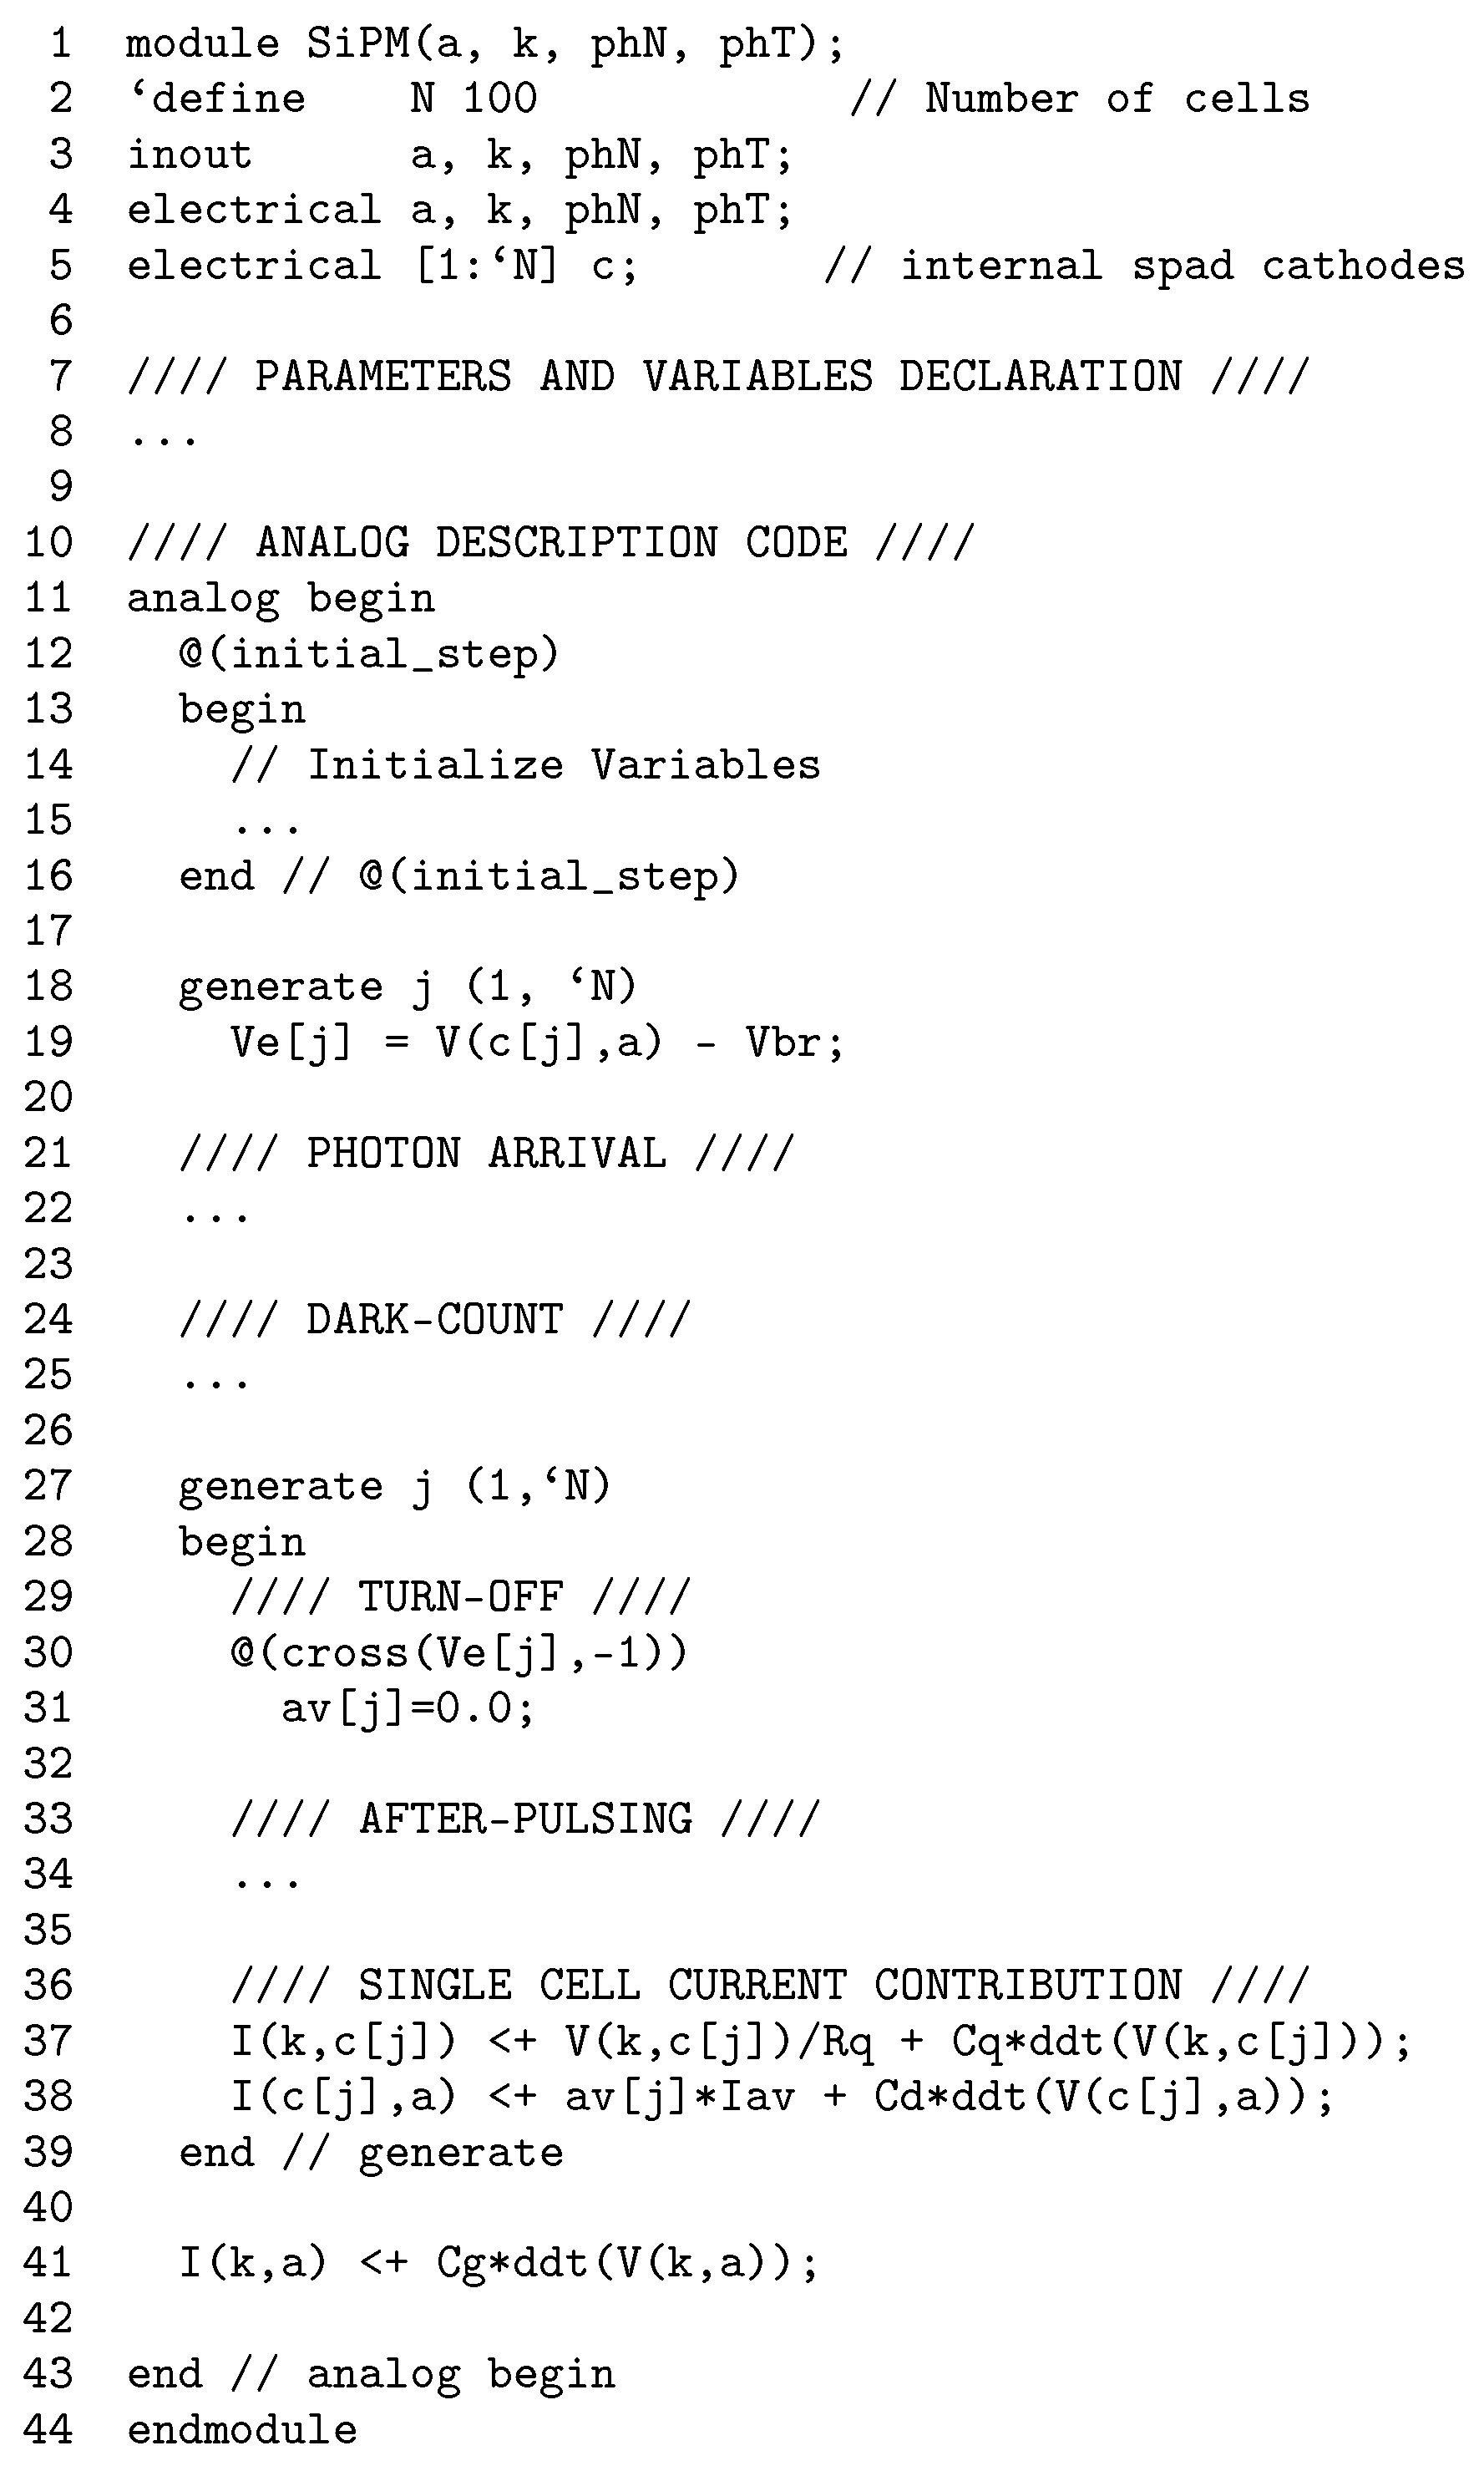
The main core of the Verilog-a code is reported in
Figure 6. The SiPM device is modeled as a four-terminal module,
a,
k,
phN and
phT, where the last two terminals are used to emulate the arrival of multiple photons. The number of APD cells that compose the SiPM matrix is set by the macro
N in line 2.
The section “Parameters and variable declaration” defines and the initializes several model parameters. The model is defined by electrical (
Rq,
Cd,
Cq,
Cg,
Vbr,
delta) and statistical parameters (
Ptrap,
etaT,
tau_dc,
tau_cr). Parameter
delta is used in the
@(initial_step) section (lines 12–16) to define the avalanche current as
Note, however, that this parameter is used just to evaluate the order of magnitude for , as the actual turn-off depends on the circuit evolution.
The “Analog description code” performs the electrical and the statistical model described in
Section 3 and
Section 4. Here, the
@(initial_step) section (lines 12–16) initializes all the required variables.
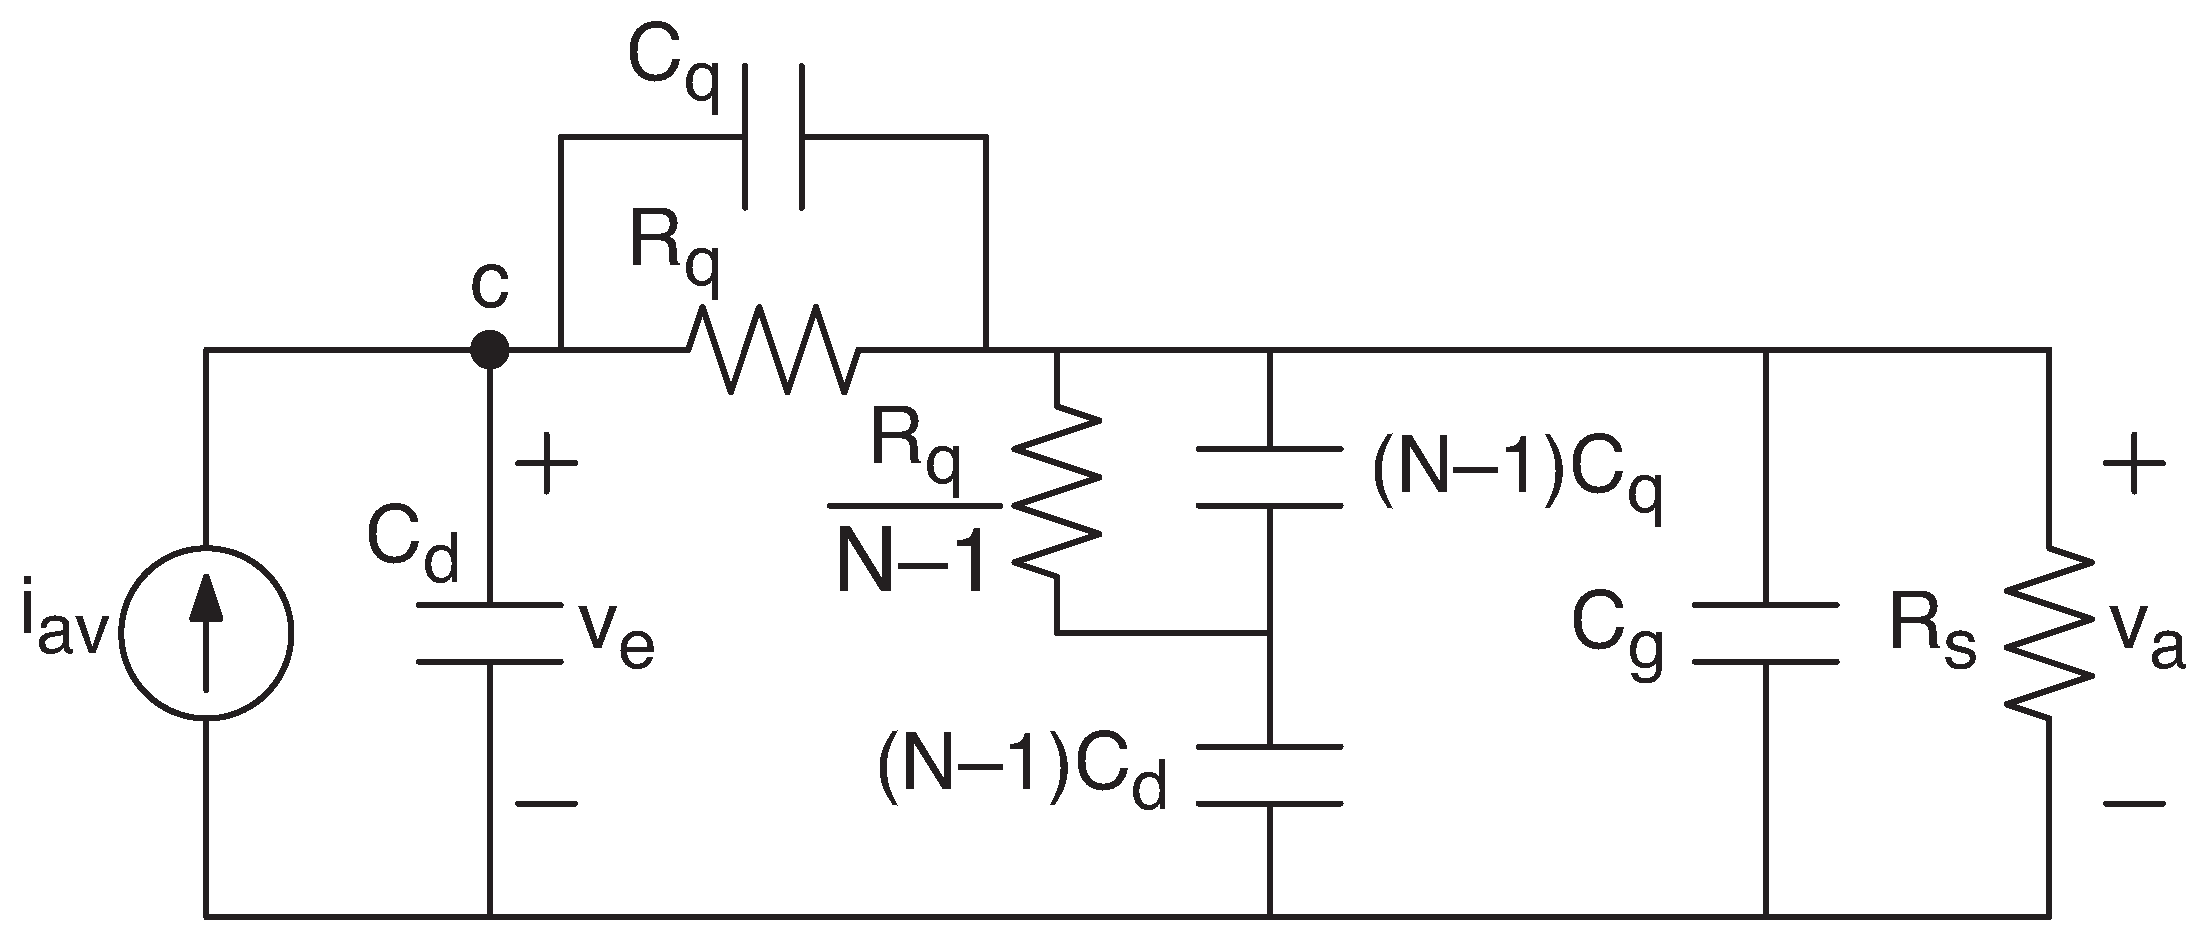
Referring to
Figure 4, the codes inside the two
generate loops (lines 18–19 and 27–39) are replicated
N times and are written for the generic
j-th cell. Hence, the electrical behavior of each cell is described in lines 37–38 by
while the contribution of the grid capacitor
is set in line 41, outside the
generate loop, as
In the code, the j-th APD cell is turned on/off by setting/resetting the flag . More specifically, the j-th APD cell is quenched as modeled in the “Turn-off” section, that is when the excess voltage, crosses the zero in the falling edge (lines 30–31). The avalanche in an APD cell can be turned on because of a photon arrival, a dark-count or an after-pulsing event. These three events are modeled in the respective sections of code and are described below.
6.1. Photon Arrival
The “Photon arrival” section of the Verilog-a code in
Figure 6 is expanded in
Figure 7. The code is executed when the voltage at terminal
phT crosses
in the positive edge (line 2). The number of photons, and the corresponding number of cells to be triggered, is set by the voltage at terminal
phN and, after truncation, is stored in the variable
Nph (line 4). If the number of arriving photons is higher than the number of APD cells of the SiPM matrix, the device is in saturation and all the cells are prepared to be turned-on by setting all the
N temporary avalanche flags,
, to ‘1’ (lines 5–6). Conversely, if the number of arriving photons is lower than the number of cells,
Nph cells are chosen randomly and are prepared to be turned on by setting the respective temporary avalanche flags
to ‘1’ (lines 8–20). In lines 22–31, for each cell to be triggered, after checking that no avalanche is taking place and that the APD is biased above breakdown, the avalanche is started. Meanwhile, with a probability established by the trap** probability,
, a new carrier release time is stored in the variable
for the
i-th cell. The carrier release time is chosen from an exponential distribution with mean
and shall be used for executing the “After-pulsing” code, as described in
Section 6.3.
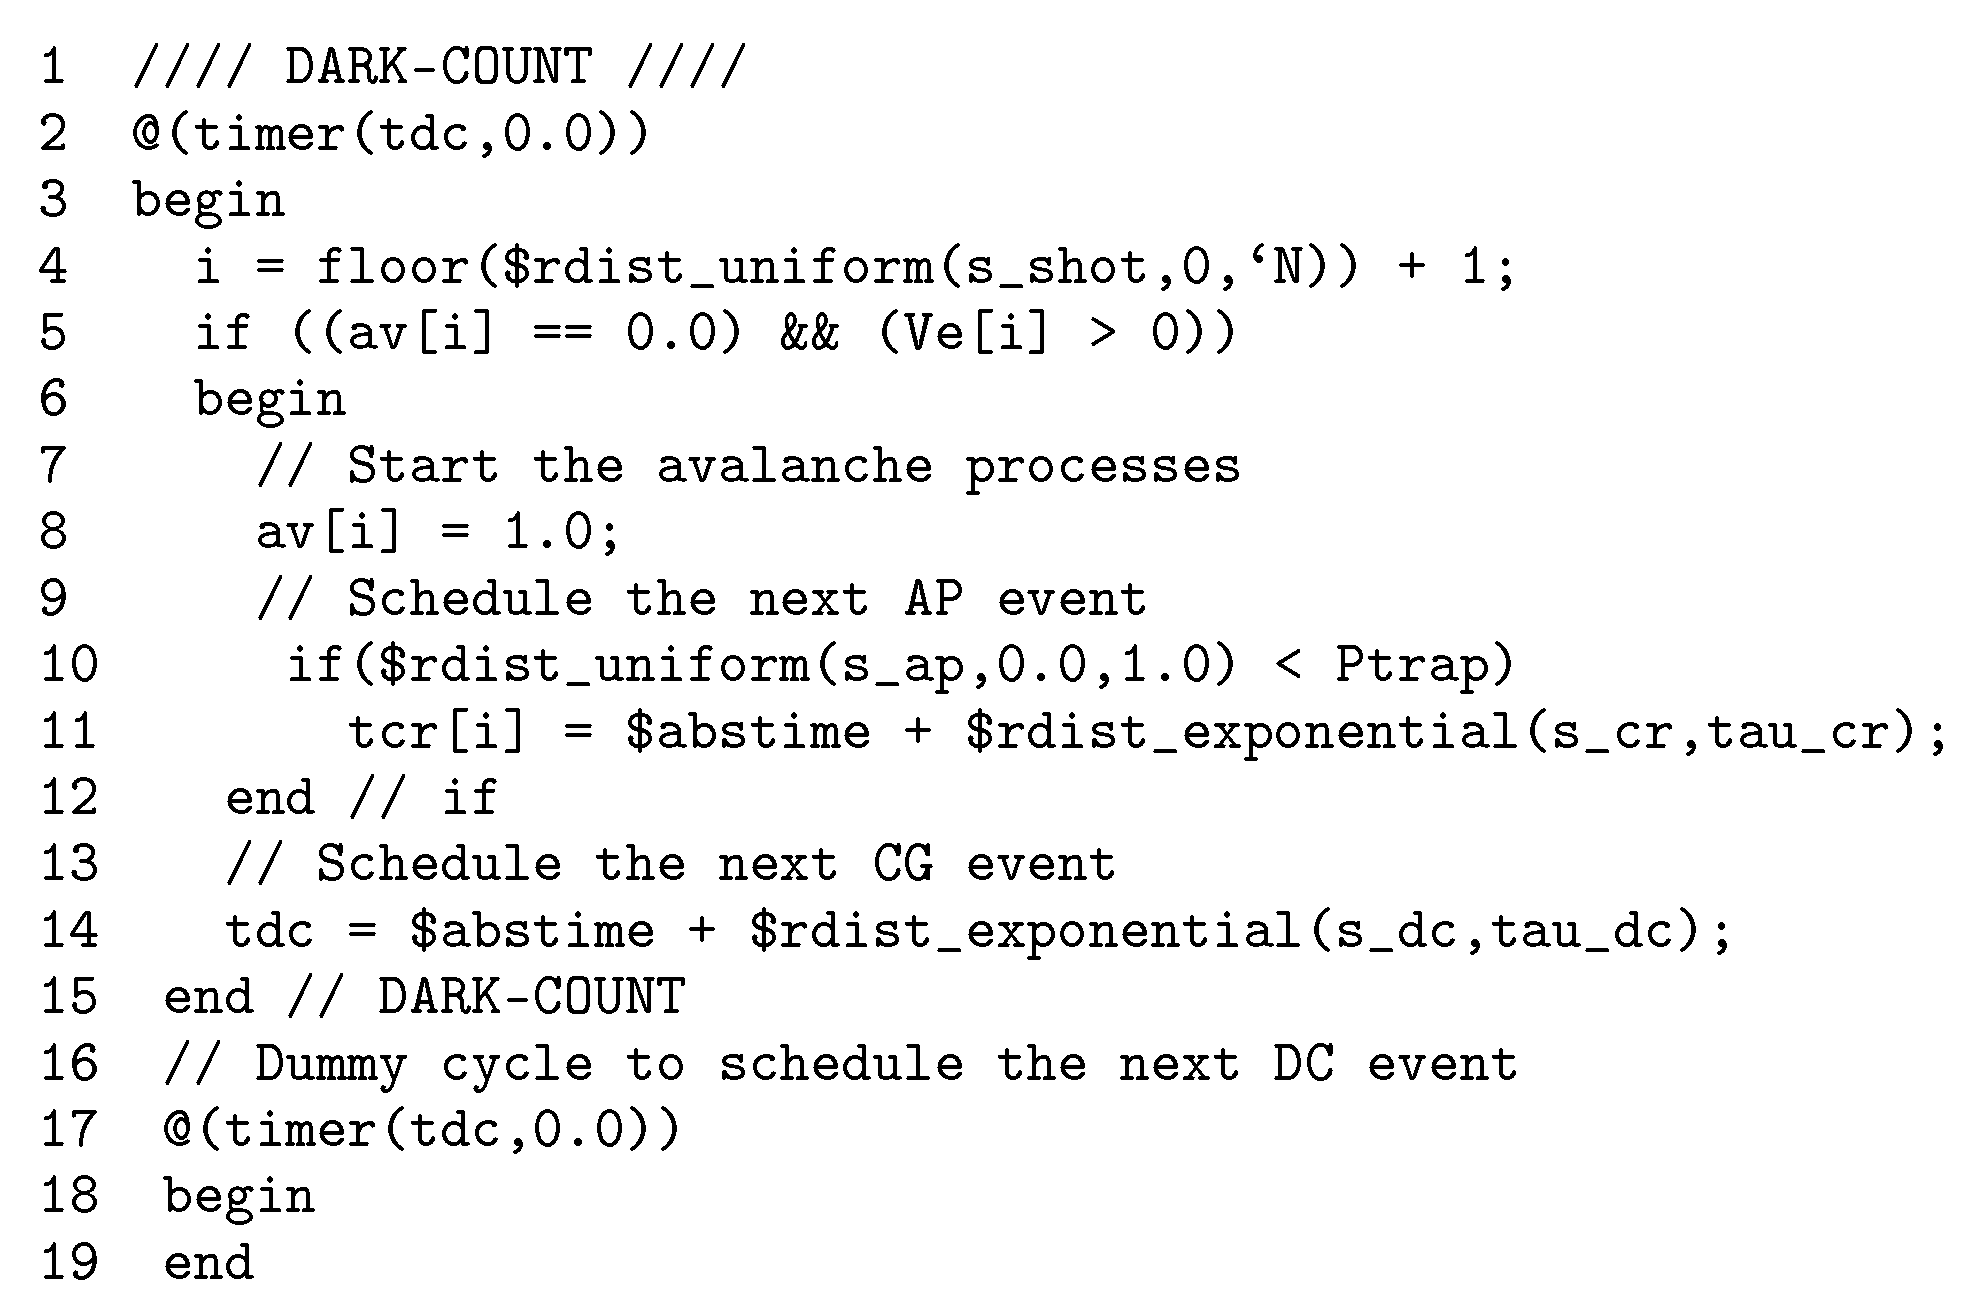
6.2. Dark-Count
The “Dark-count” section of the Verilog-a code in
Figure 6 is expanded in
Figure 8. The code is executed when the absolute simulation time equals the value assigned to the variable
(line 2). First, the cell to be turned on is chosen randomly (line 4). Then, if no avalanche is taking place and the
i-th APD is biased above breakdown, the avalanche process is started setting
. Meanwhile, with a probability set by the trap** probability,
, a new carrier release time is stored in the variable
using an exponential distribution with mean
(lines 5–12). Finally, a new the simulation time for the next dark-count event is stored in the variable
using an exponential distribution with mean
(line 14). Lines 17–19 are required to schedule the next dark-count event correctly.
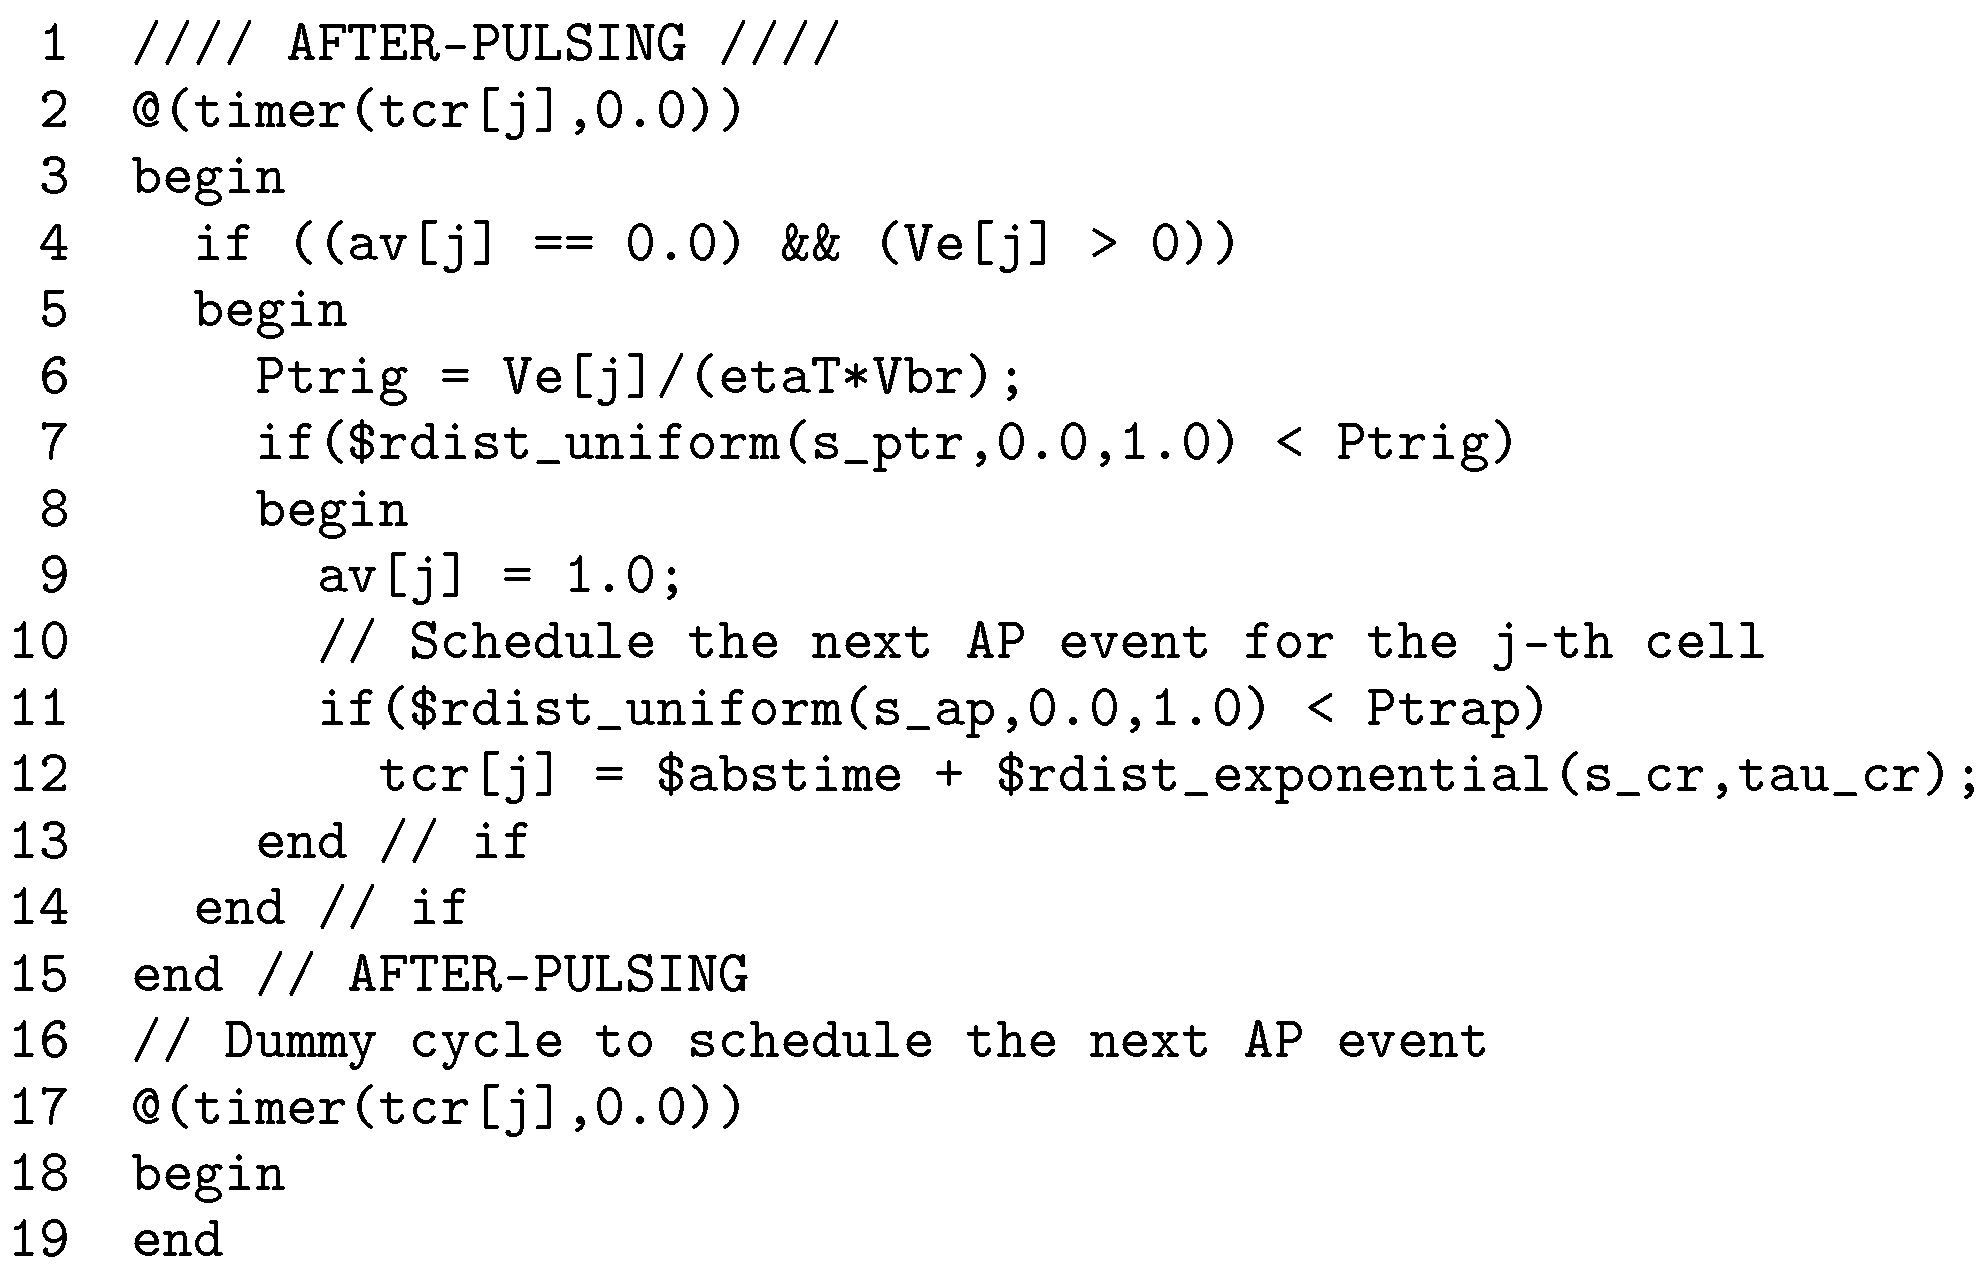
6.3. After-Pulsing
Referring to the main code in
Figure 6, the “After-pulsing” section is replicated
N times thanks to the
generate loop in lines 18–39. The corresponding Verilog-a code is reported in
Figure 9 and refers to the
j-th cell. The code for the
j-th cell is executed when the absolute simulation time equals the value assigned to the variable
(line 2). If no avalanche is taking place and the
j-th APD is biased above breakdown, the triggering probability,
, is evaluated and used to start the avalanche and schedule a new carrier release event at time
with a probability set by the trap** probability,
(lines 6–12). Lines 17–19 are required to schedule the next carrier release event correctly.
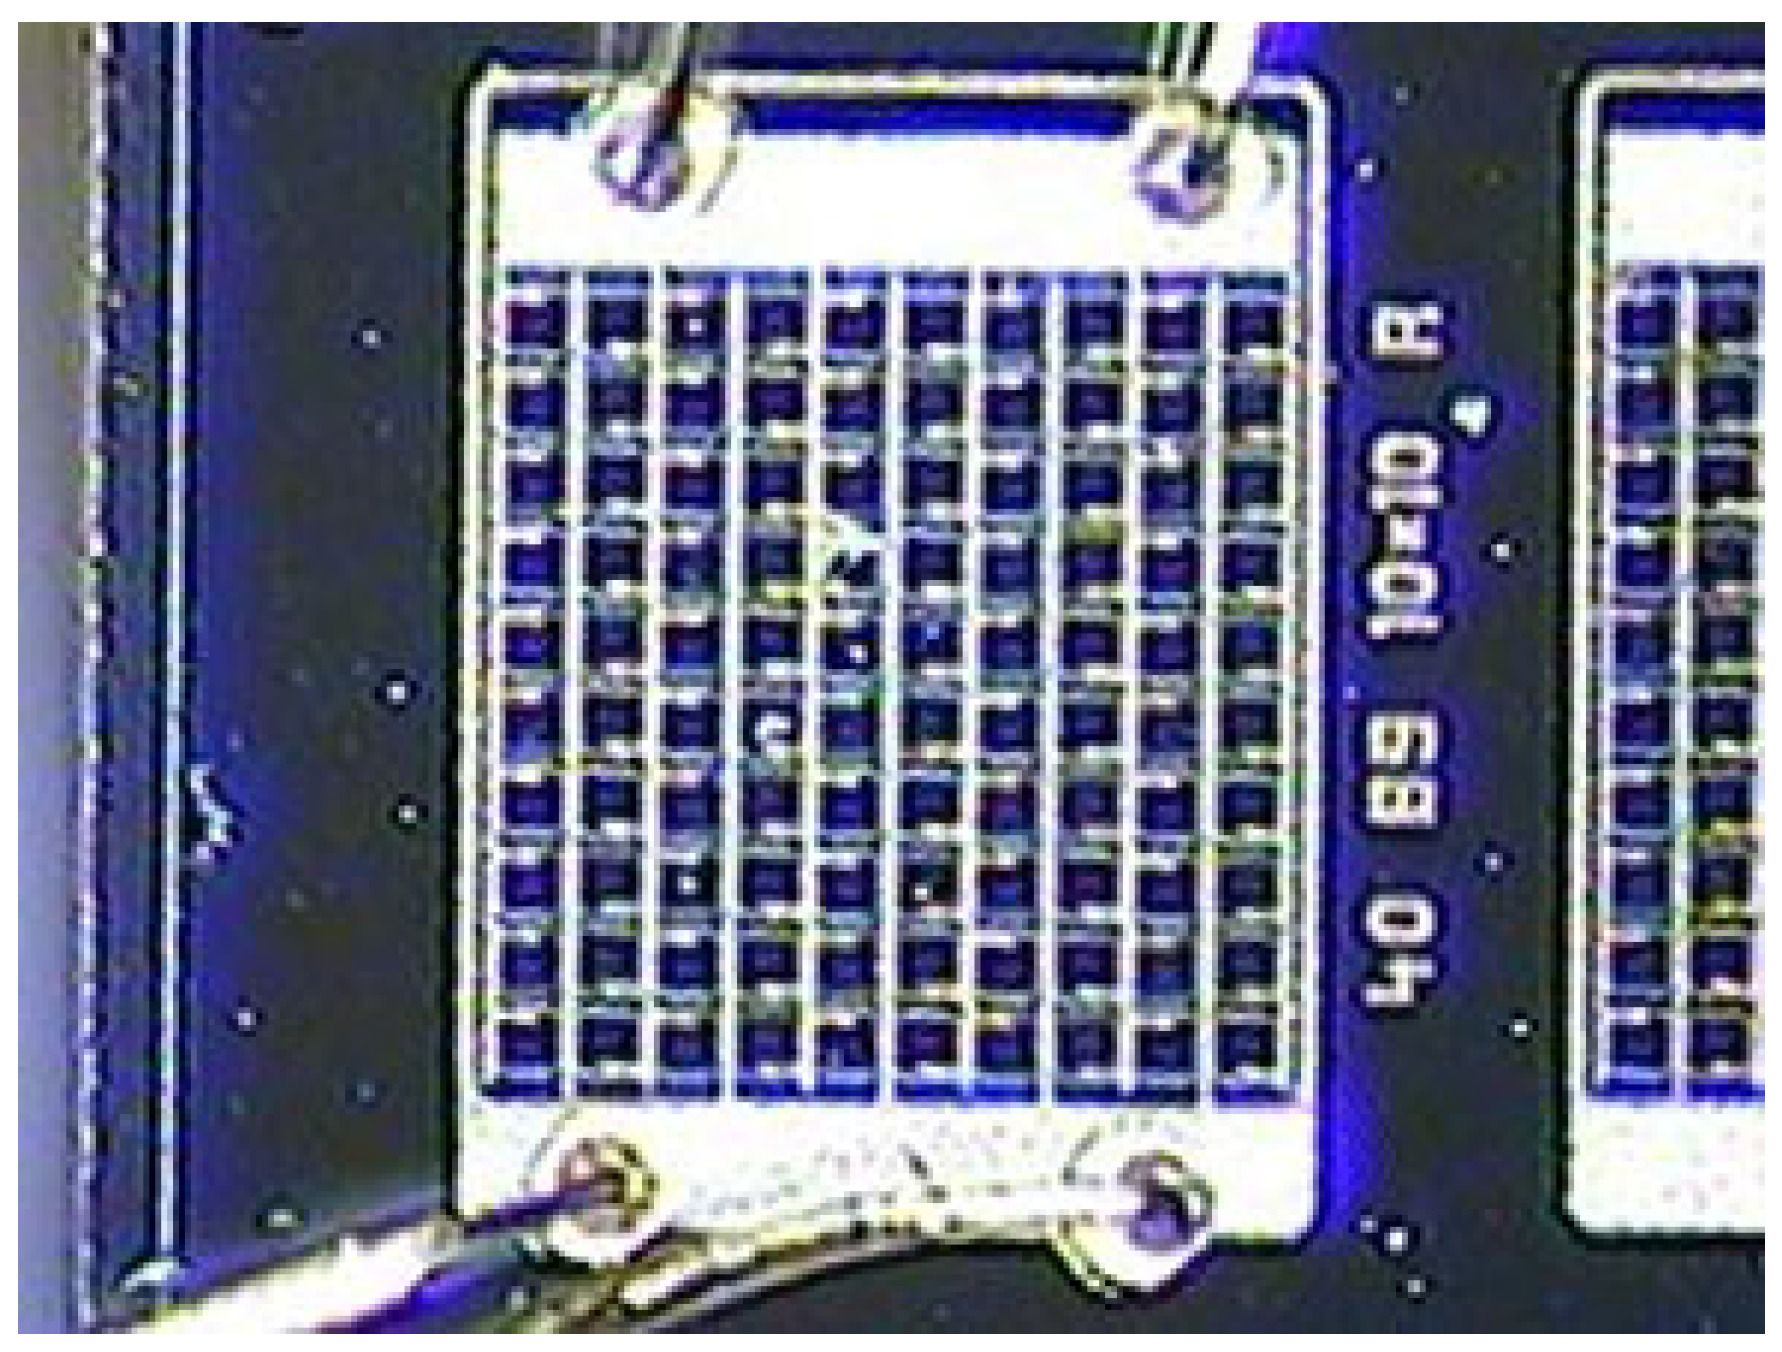
7. Model Validation
The proposed Verilog-a model was verified using two 10 × 10 SiPM prototypes provided by STMicroelectronics. We shall refer to them as SiPM-A and SiPM-B. They were used for testing the electrical and the statistical model, respectively.
The photo of the SiPM-A device is shown in
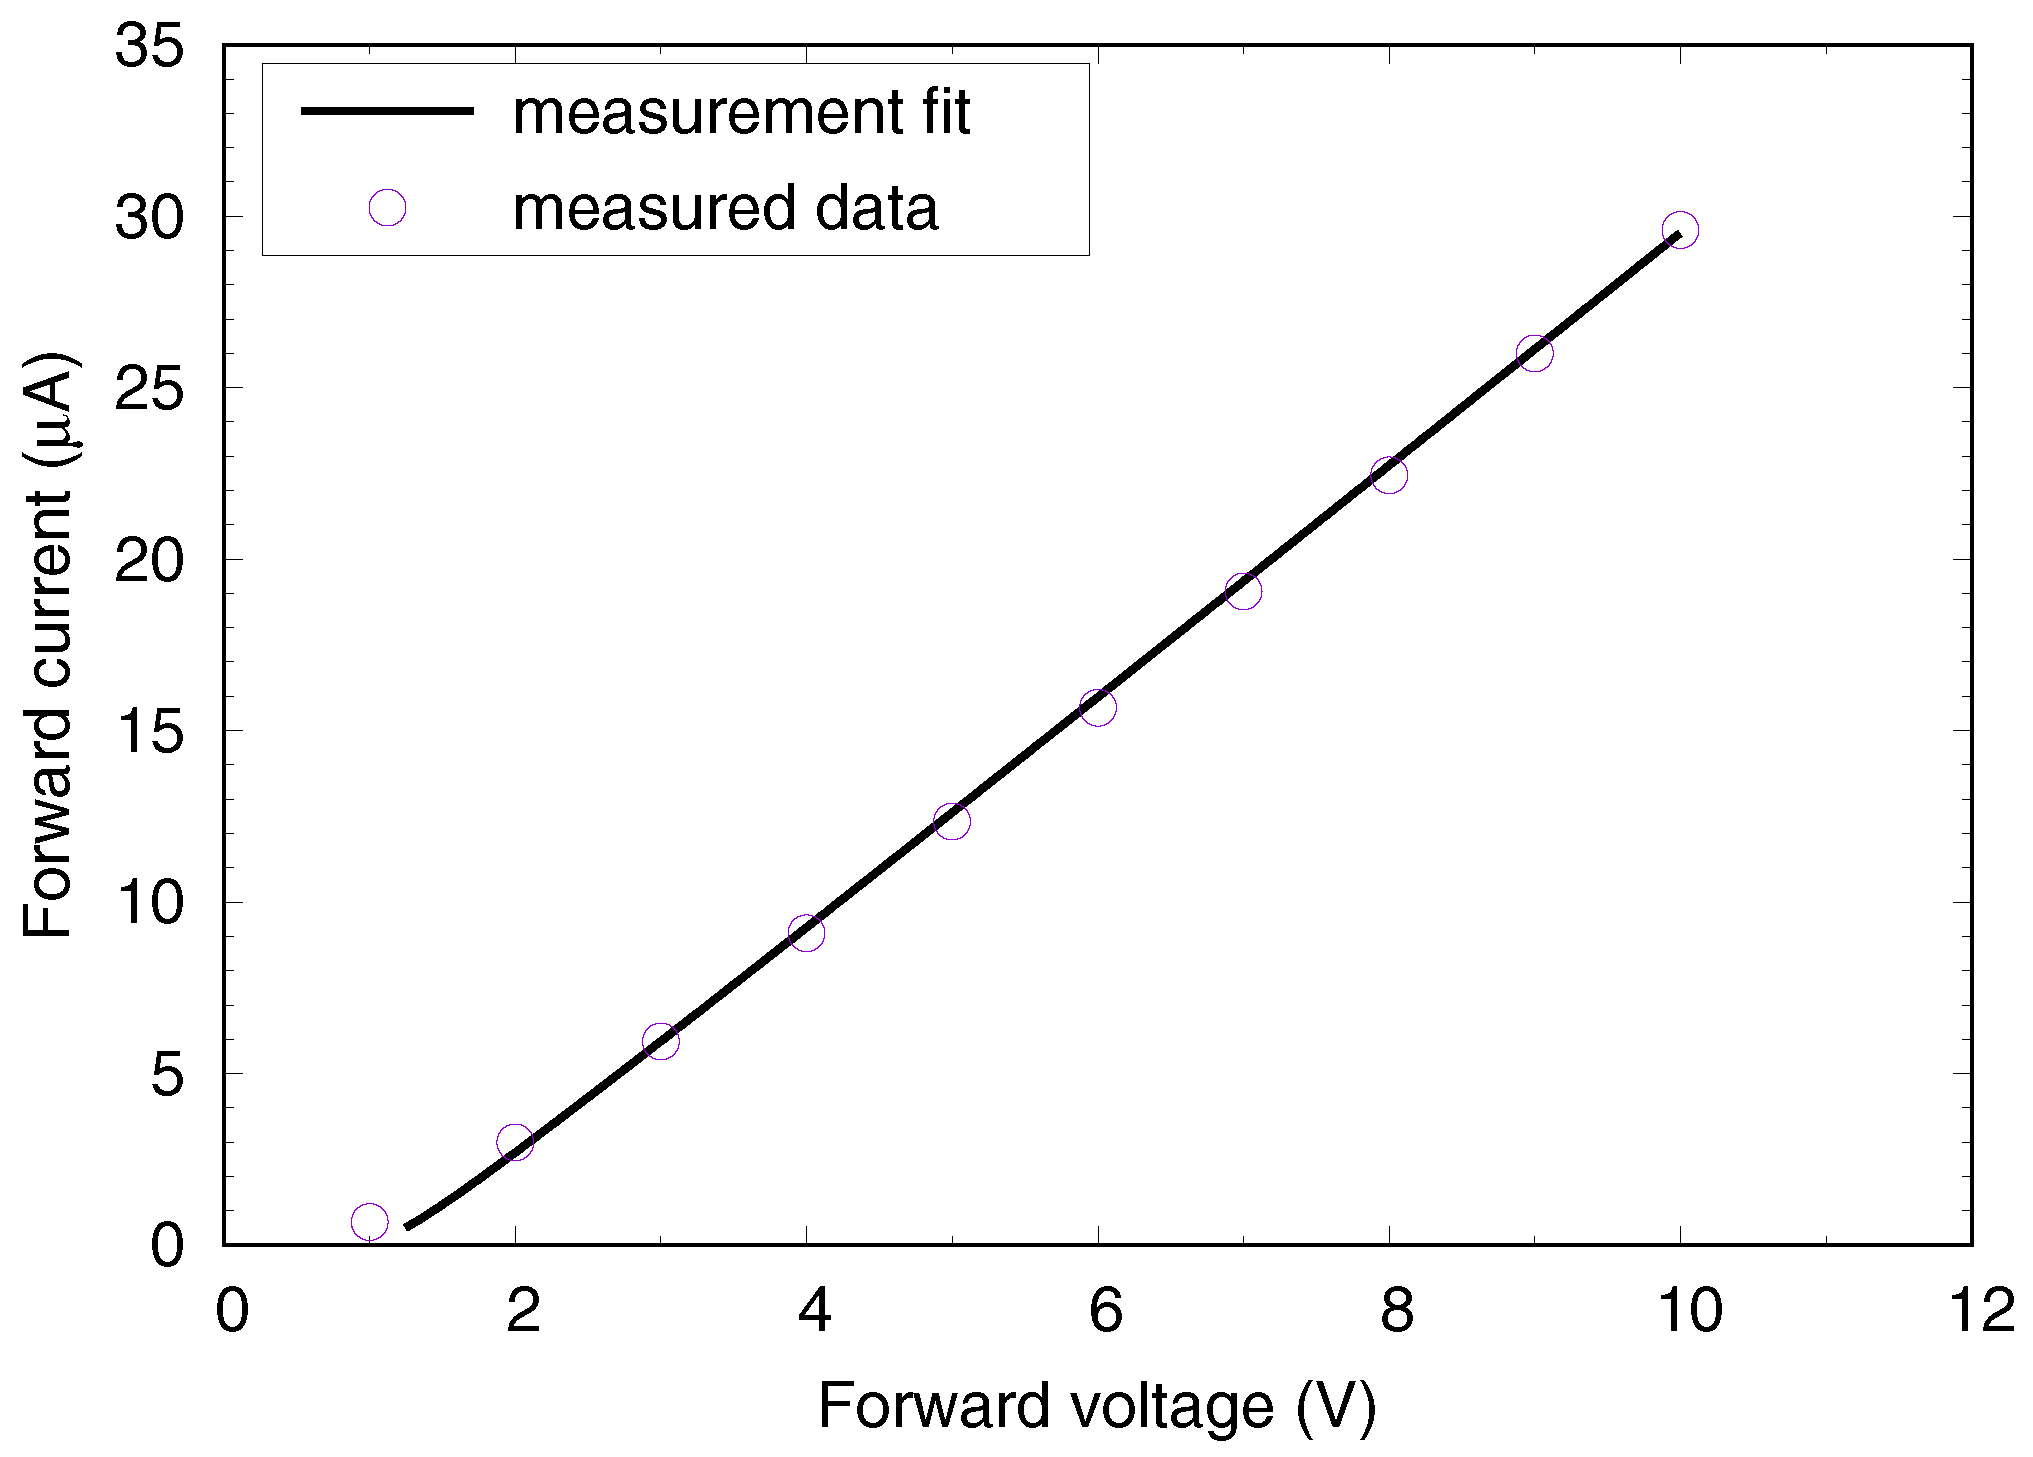
Figure 10. The value of the quenching resistor was determined with the procedure in
Section 5.1. The static I-V characteristic of the SiPM was fitted with (
24), as depicted in
Figure 11, thus obtaining
. The other electrical parameters were determined with the detector assembled as in
Figure 2 with
and
. The pre-amplifier exhibits a 46-dB gain and a 4-GHz high-frequency bandwidth. Voltage
was measured and recorded so to obtain a set of 500 curves. Following the procedure in
Section 5.1, the measured data
were fitted with the double-exponential function in (
9) and the parameters in
Table 1 were determined. Finally, the electrical parameters reported in
Table 2 were obtained.
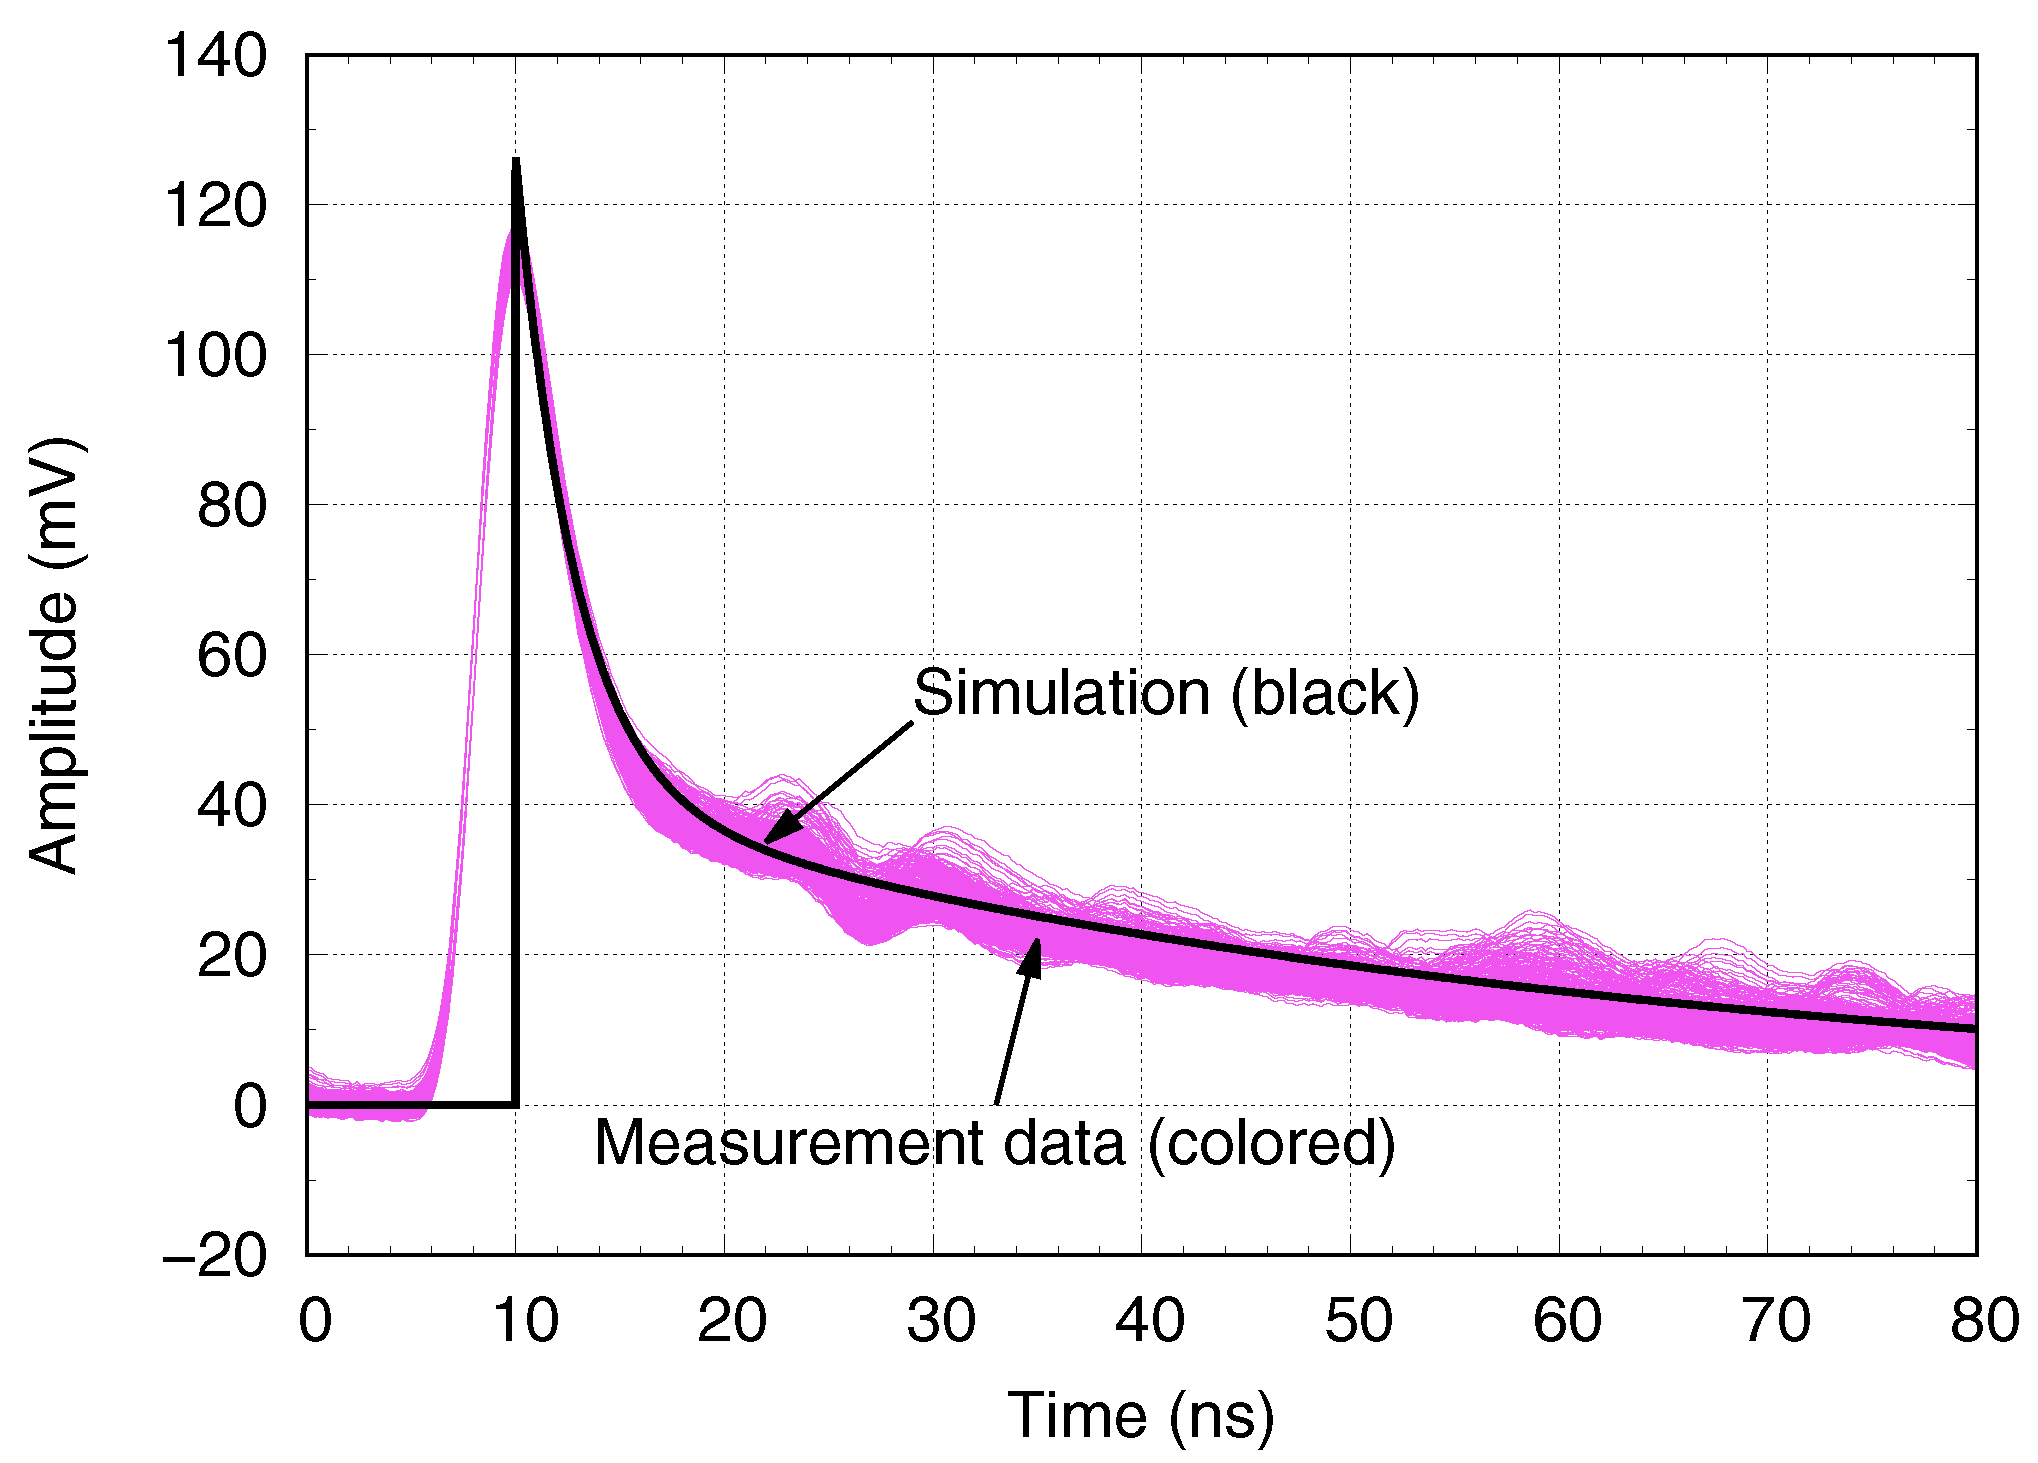
The SiPM-A model was implemented in Verilog-a using the code described in
Section 6. The avalanche current,
, was set as in (
30) using
. The SiPM-A device was simulated, and the time response was compared with a second set of measurement data (500 curves), as shown in
Figure 12. Apart from the gradual starting slope of the measured data, caused by the finite bandwidth of the oscilloscope, it is apparent that the simulated response matches very well with the measured results, thus validating both the model and the extraction procedure.
As far as the SiPM-B is concerned, following the same procedure used for the SiPM-A device, we set
,
and extracted the electrical parameters summarized in
Table 3.
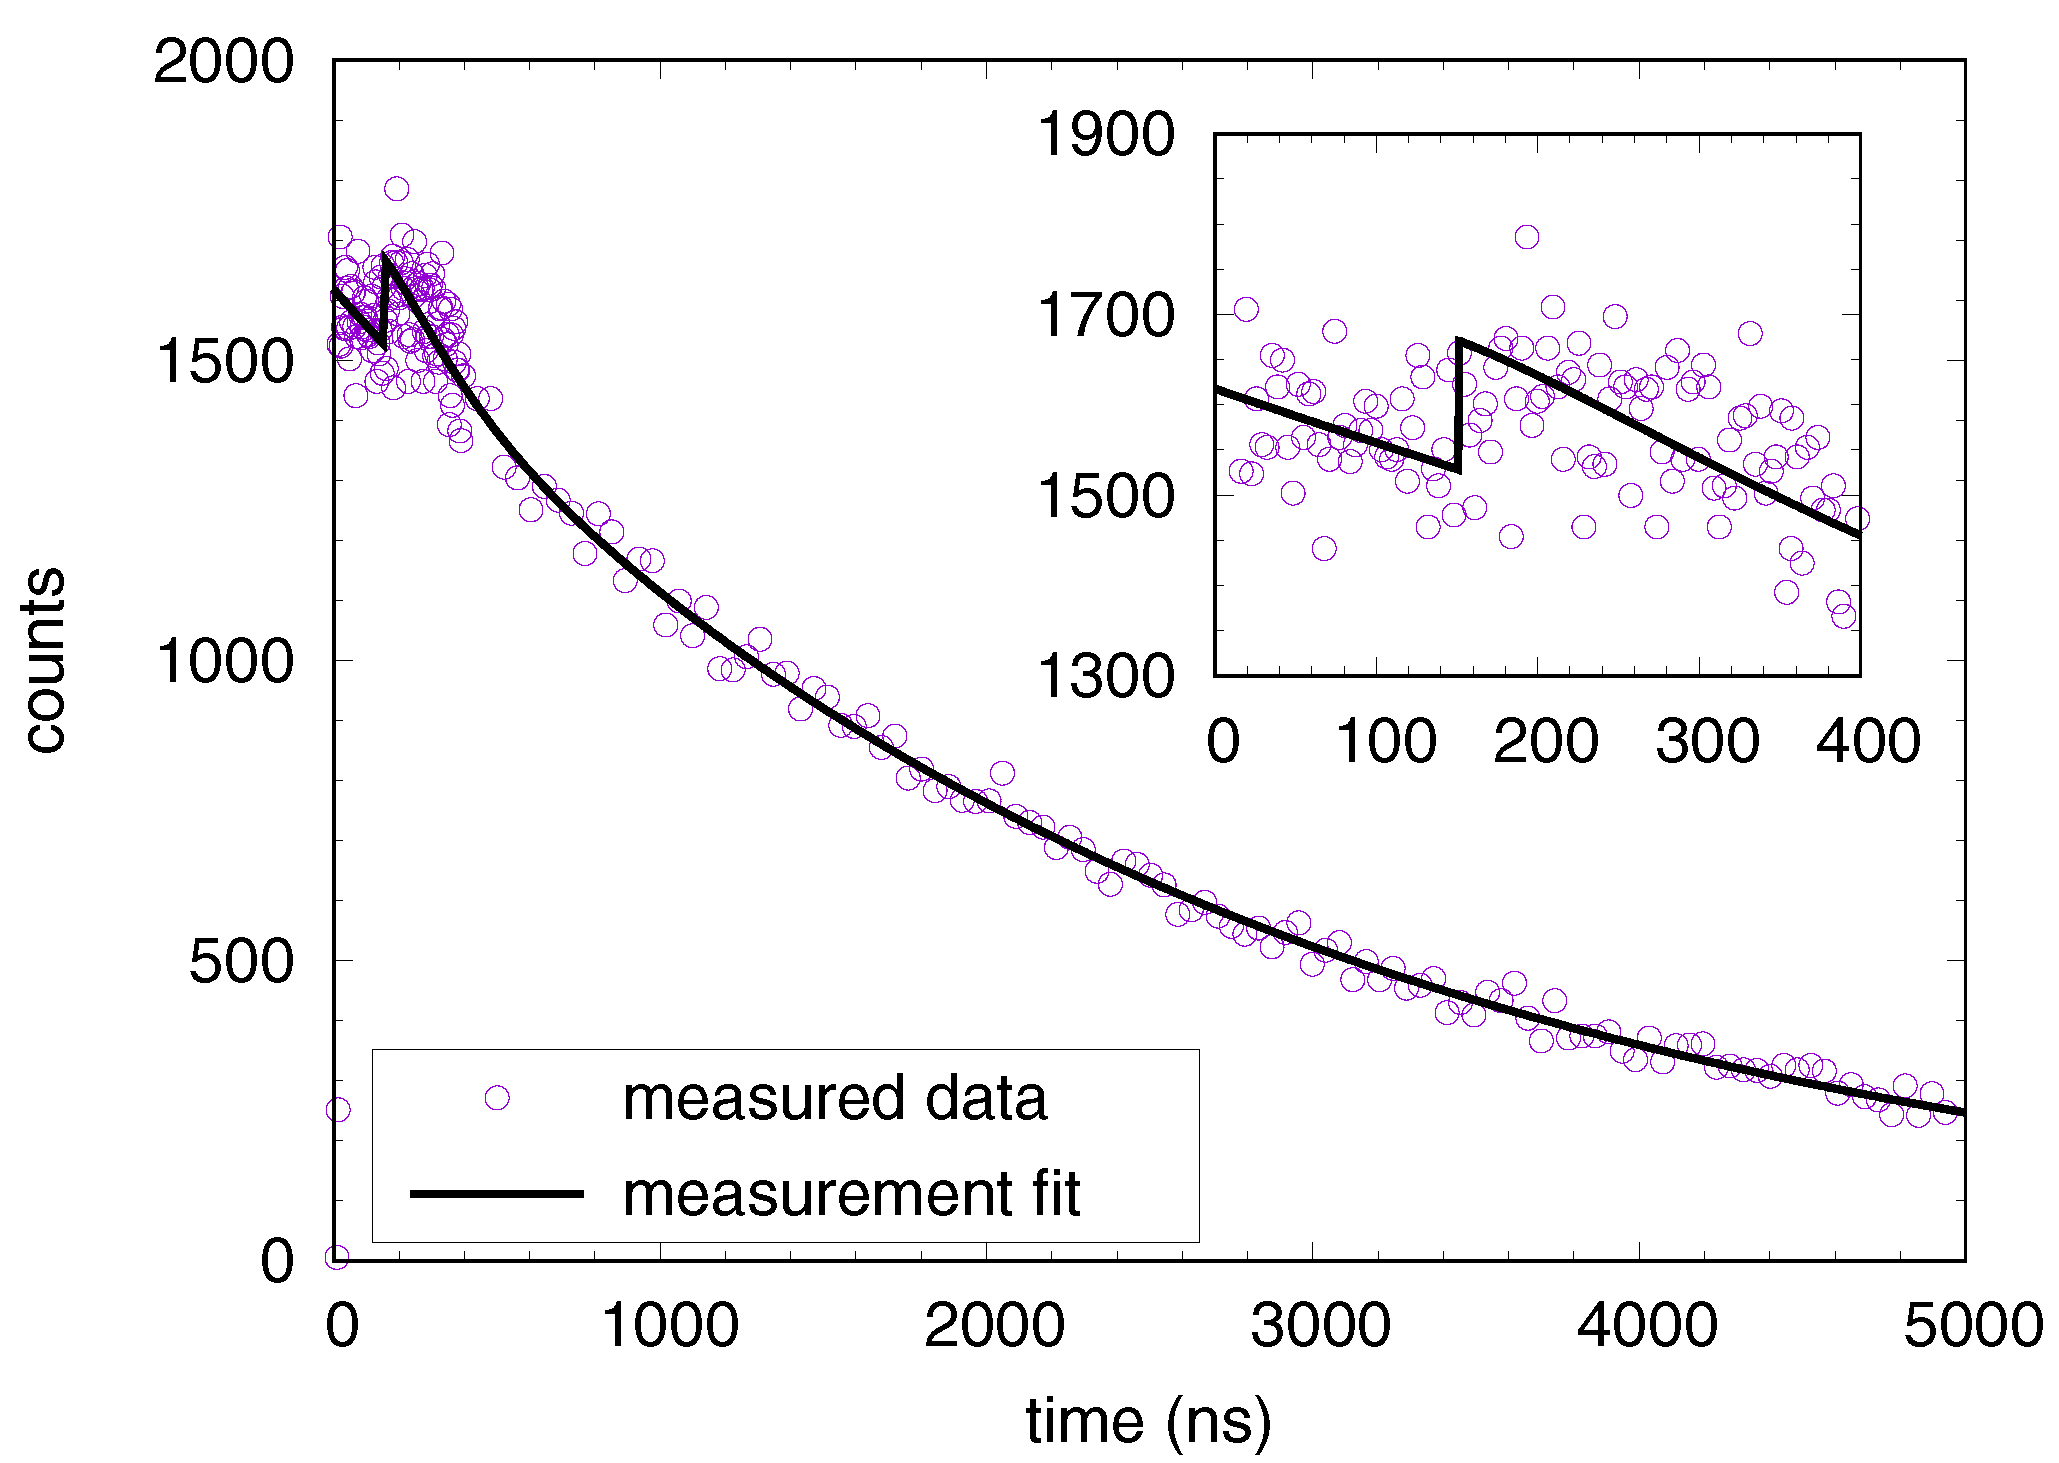
Then, maintaining the same excess voltage,
, and setting the threshold of the read-out circuit to 0.5-photon level (
), we recorded the time intervals between two consecutive shots and evaluated the corresponding distribution, reported in
Figure 13 (measured data).
Using the data in
Table 3, we computed
and
from (
10a) and (
21), respectively. Then, we fit the noise distribution in (
22) to the measured data and extracted the statistical parameters shown in
Table 4. The noise distribution obtained from the fitting procedure is plotted in
Figure 13 (measurement fit) and matches very well the measured data with a goodness of fit set by
.
We used the Verilog-a code described in
Section 6 to implement the simulation model for the SiPM-B device. In this model, we imposed
, when
, that is, when the SiPM is biased at its nominal excess voltage. To do so, we simply set
from (
18). We also obtained
from (
29).
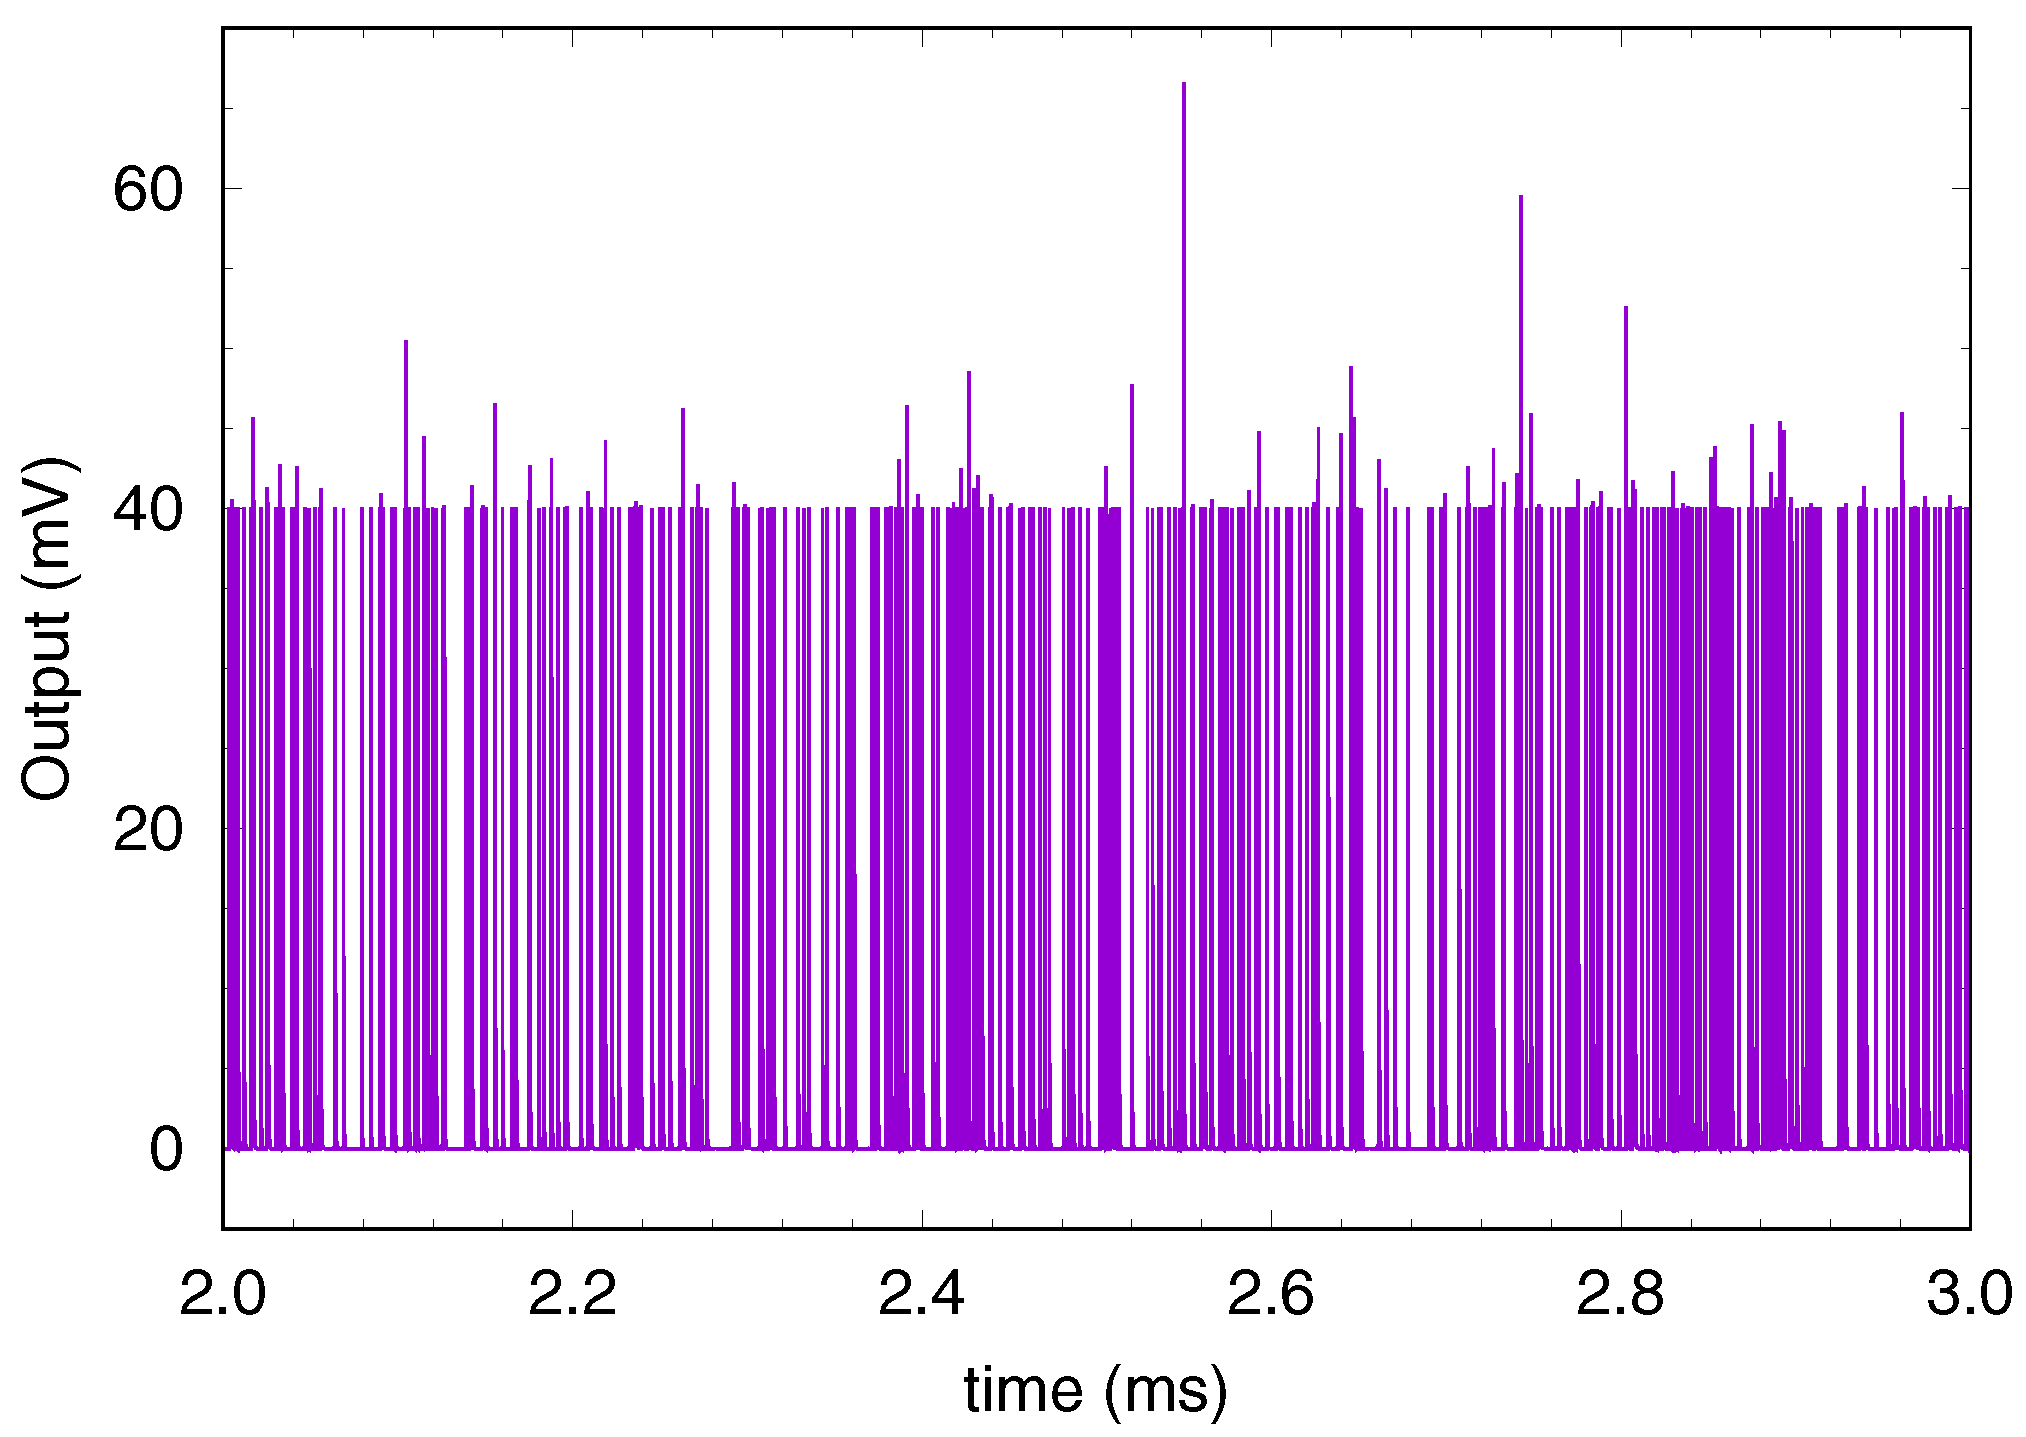
The statistical simulation model was validated as follows. We assembled the circuit as in
Figure 2 (
) and ran a transient simulation of 180 ms recording the time intervals between two consecutive shots that exceeded the 0.5-photon level. In the process, no photon arrival was emulated, so that the evolution remained characterized by the noise of the SiPM only (i.e., dark-count and after-pulsing events). A portion of the transient simulation is reported in
Figure 14, where the output voltage of the pre-amplifier in
Figure 2 is considered. The 1-photon level is about 40 mV so that we recorded all the signals that exceeded the 20-mV threshold.
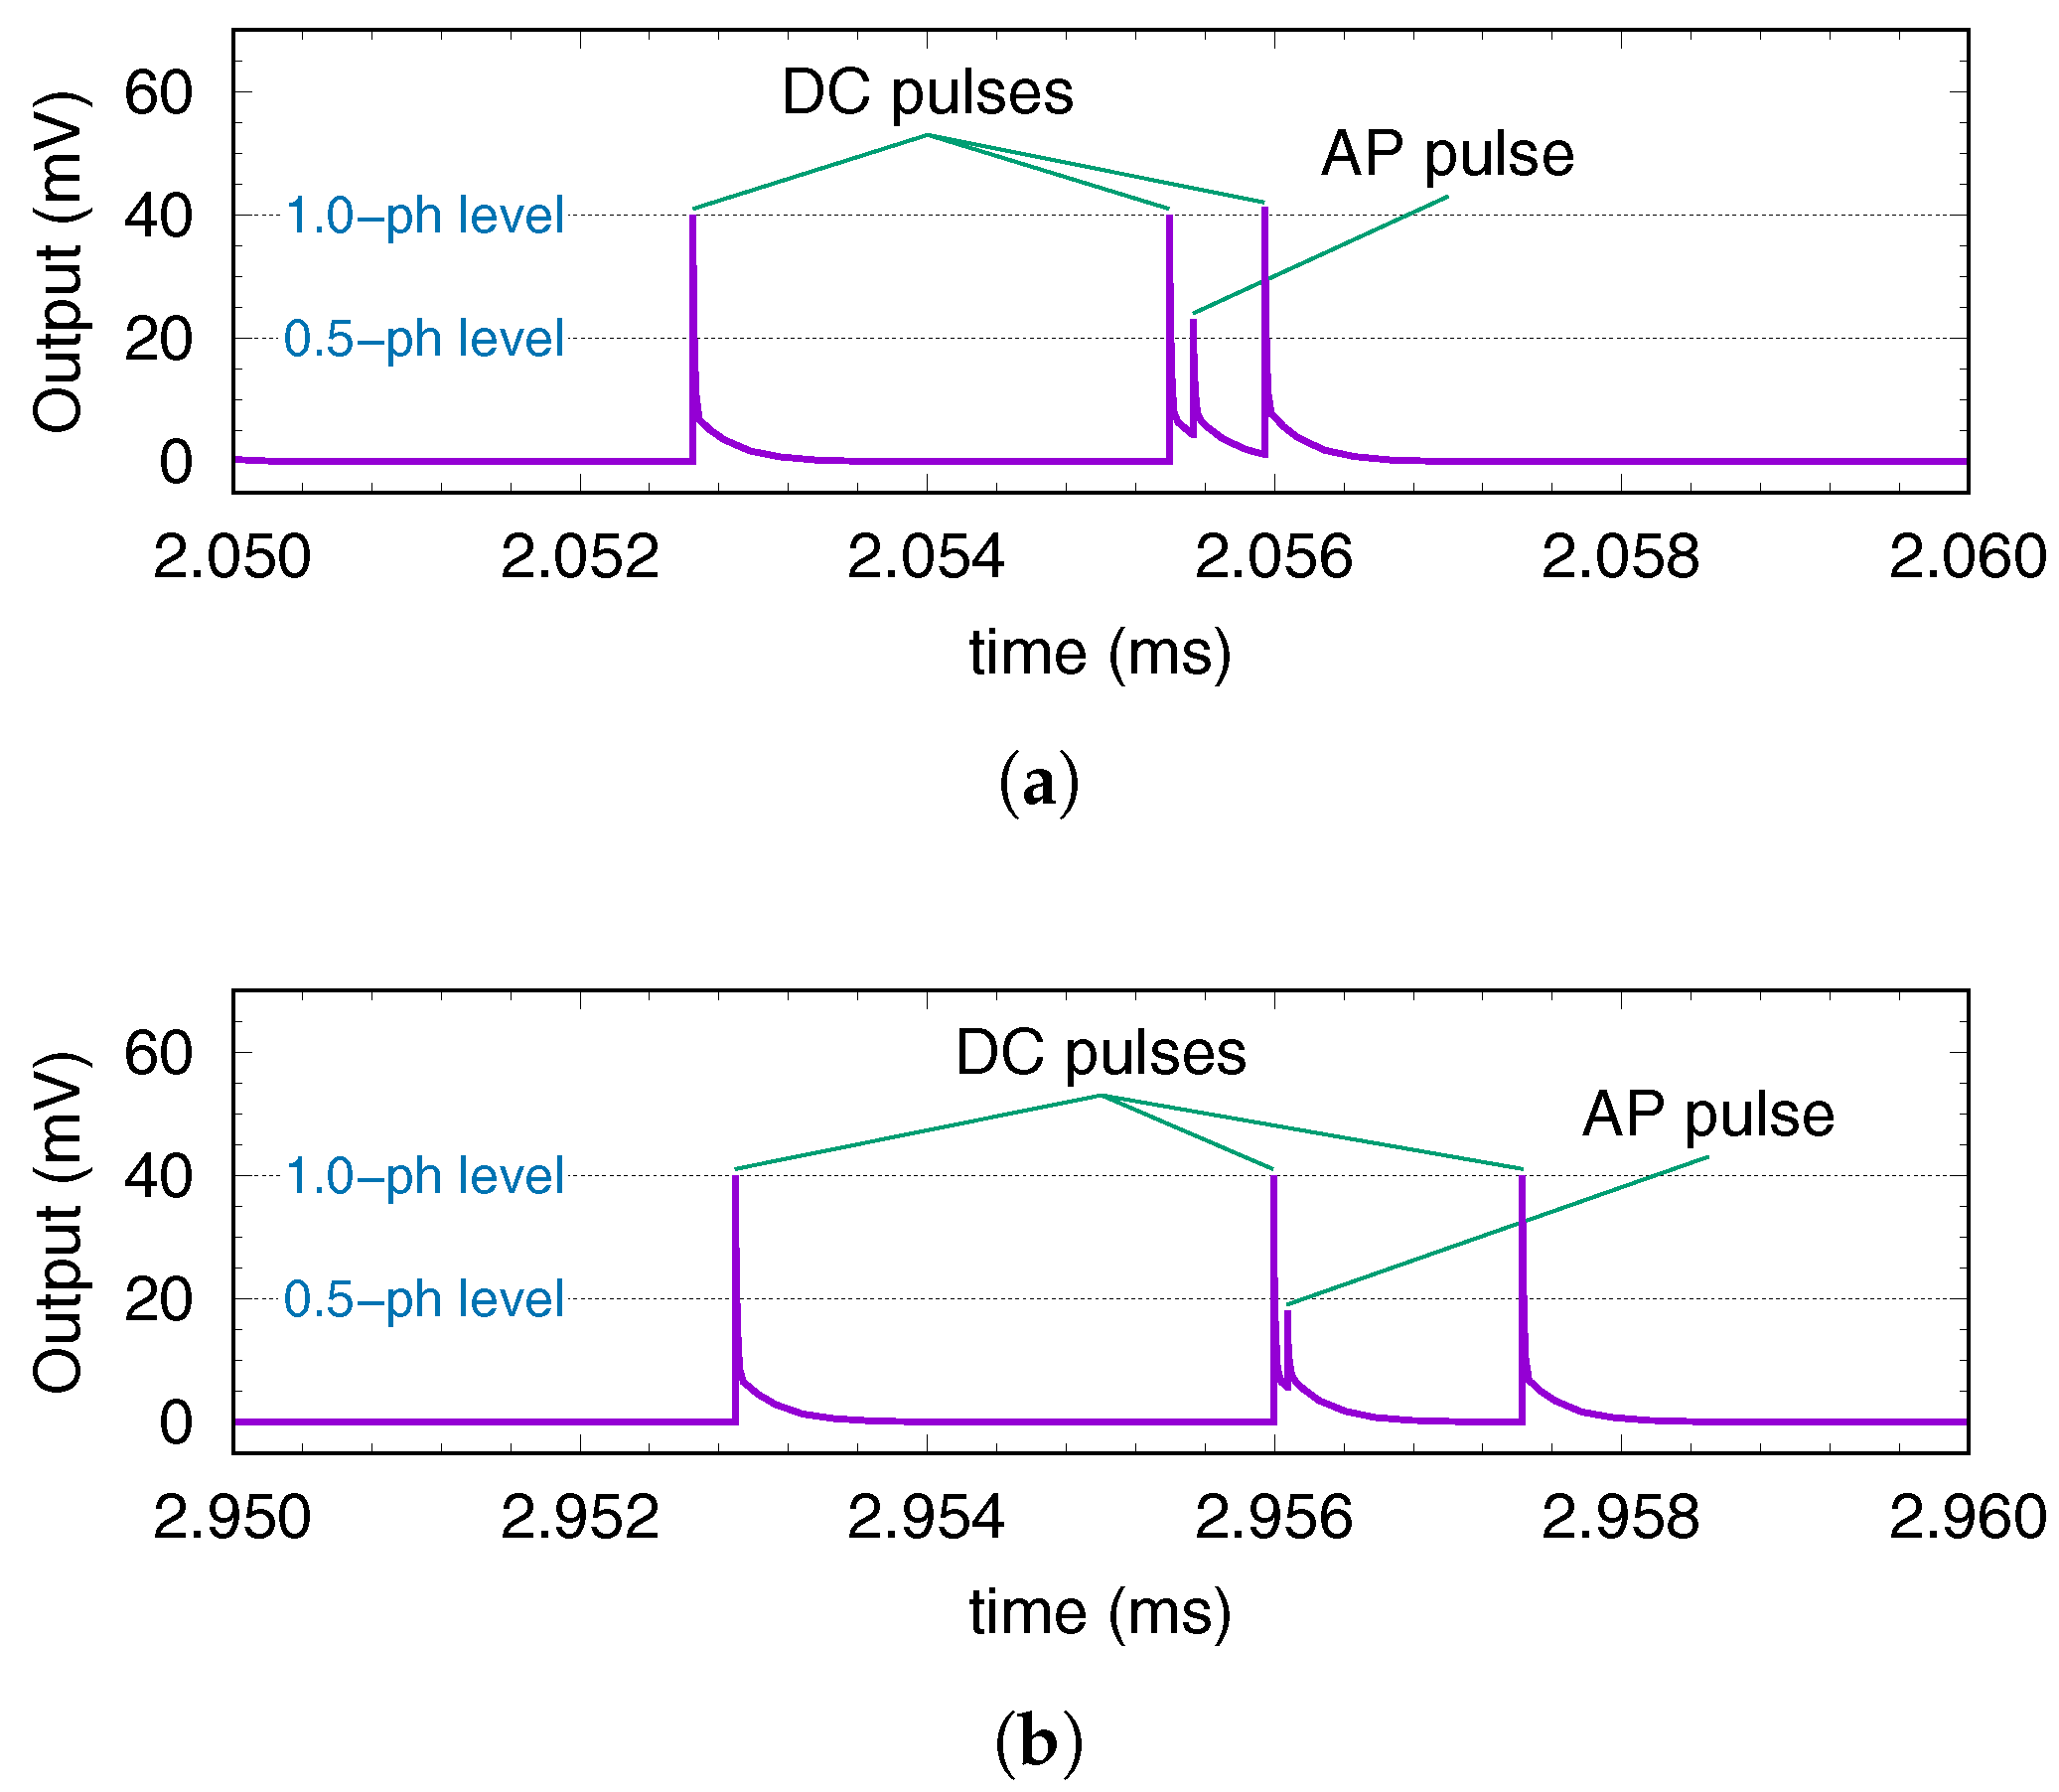
Figure 15 shows the different behaviors of two after-pulsing events both caused by antecedent dark-count pulses. In the case depicted in
Figure 15a, the AP event occurs after
seconds with respect to the antecedent DC pulse. Hence, as predicted from (
20), its maximum output voltage, although lower than the 1-photon level, is still able to overcome the 20-mV threshold and is regularly detected. Conversely, in
Figure 15b, with respect to the DC event, the AP pulse occurs before
seconds. The SiPM generates a maximum voltage lower than the 20-mV threshold, and the event is not recorded.
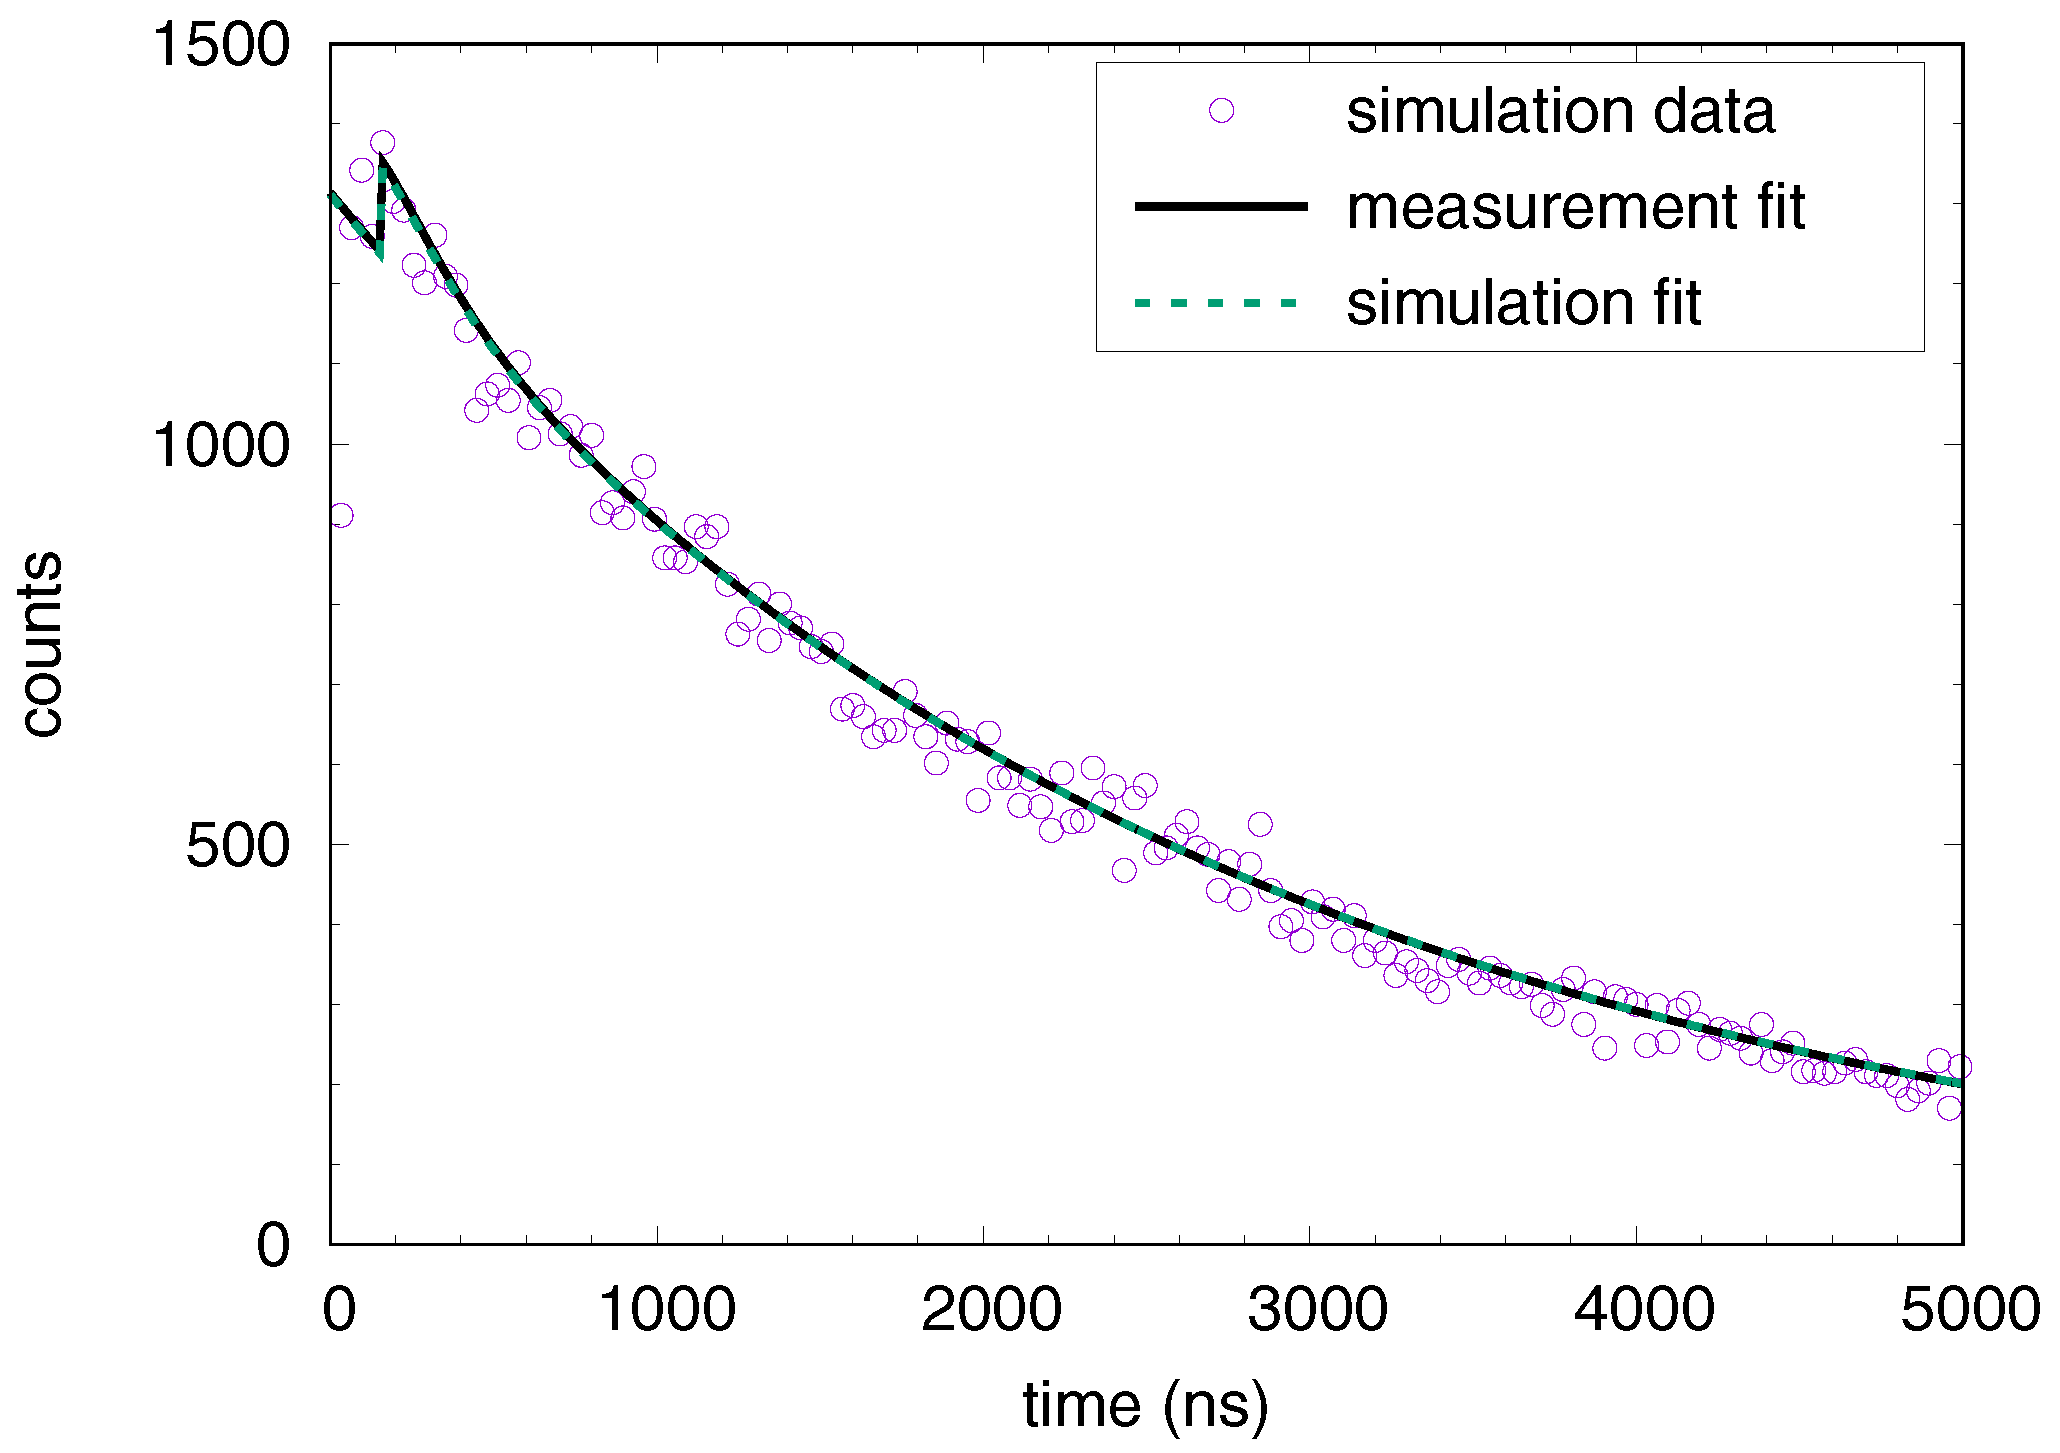
The overall simulation produced 68475 pulses that were organized in the discrete distribution reported in
Figure 16 (simulation data). Then, we fitted the noise distribution in (
22) to the simulation data and obtained the values in
Table 5, with a goodness of fit set by
.
Using the values in
Table 5, in
Figure 16 we plotted the noise distribution obtained from the fitting of the simulation results (simulation fit). In the same figure, we also plotted the noise distribution obtained using the values in
Table 4, that is, from the fitting of the measured data (measured fit). This latter figure required a proper scaling of
and
to have a fair comparison. The percentage error between the two noise distributions (measurement and simulation fit) maintains below 0.47%. The excellent matching between the simulation data and both the measurement and the simulation fits provided a complete validation of the statistical model as well as of its Verilog-a implementation and of the extraction procedure.


