2.1. Filter Bank Canonical Correlation Analysis and Extend Canonical Correlation Analysis
Standard CCA makes the projection results of two multivariate variables
,
have the largest correlation coefficient by selecting the best projection direction [
12]. CCA maximizes the correlation of
and
by calculating the optimal projection direction
and
. The optimization problem can be written as follows.
Let
and
and the result of Equation (
1) make the Pearson’s correlation
maximization. Let
and
be the multi-channel EEG signals and SSVEP reference signal; the maximum correlation between EEG signals and reference signals can be calculated via Equation (
1). The reference signal
matching with stimulation frequency
can be expressed as:
where
denotes the stimulus frequency,
is the sampling rate and
is the number of harmonics of the SSVEP component.
Let
denote the average of multiple trials in the training set, the feature of the test data can be defined as the correlation coefficients among the test data, the training data and reference signals under several spatial filters calculated by the CCA algorithm. Toward this end, the feature can be expressed as follows:
where
and
represent the spatial filter of
X and
Y, respectively, which can be calculated by the CCA algorithm, and
denote the correlation coefficient of
X and
Y. In practice, the following weighted correlation coefficient
is usually used as the final feature of the detection.
where sign() is used for discriminative information from negative correlation coefficients between test data
and training data
. The detector recognizes the visual stimulus frequency corresponding to the received data by selecting the largest
.
To overcome the effects of non-Gaussian background noise and the SSVEP harmonies, FBCCA decomposes the EEG into several sub-bands and employs standard CCA to process the sub-band data. In this paper, the lower and upper cut-off frequencies of the
m-th sub-band are set to
Hz and 90 Hz, respectively. Both the number of sub-bands and the harmonic number of the reference signals (
) are set as 5. Then, using the weighted correlation coefficient in (3) and (4), a weighted sum of squares of the correlation coefficients of all sub-bands can be expressed as:
where
is the canonical correlation coefficient between
in the
m-th sub-band and
calculated by CCA in the
m-th sub-band. In this paper, both the FBCCA algorithm and the eCCA algorithm use the filter bank design method described above, where both the number of filter banks and harmonic number are set to 5.
2.2. Turbo Detector
In the existing SSVEP signal detection methods, for both the supervised and the unsupervised methods, the received data will be abandoned instead of extending the training dataset. If the detector can fully exploit those received data to extract the subject-specific information, the performance will be improved. However, if the received data are set as training data, we note that the detector needs a large amount of data to achieve the complete training dataset (each stimulus frequency has at least 1 trial data for training) since the received data are random. Furthermore, the size of the training dataset is determined by the stimulus frequency with a minimum number of trials. It takes a long time to obtain a small complete training dataset, and most of the received data are discarded. In this work, a novel turbo detector is proposed, which recycles the received data to train the detector through the second-stage detector. The turbo detector is a two-stage detector composed of a first-stage FBCCA detector and a second-stage supervised detector (e.g., eCCA and eTRCA).
We assume that the correlation coefficients determined by FBCCA can be expressed as:
For the traditional algorithm, the detector identifies the target by the maximum value of
. However, there is a lot of information about the data contained in
for the traditional algorithm, which is expected to reach the maximum value, and it gives up a lot of information about the data, which is called the hard decision in the field of communication. In most cases, the hard decision is not the best decision for the detector [
25].
By sorting vector
from largest to smallest as
We can note that the order of the sorts can reflect the probability of the target.
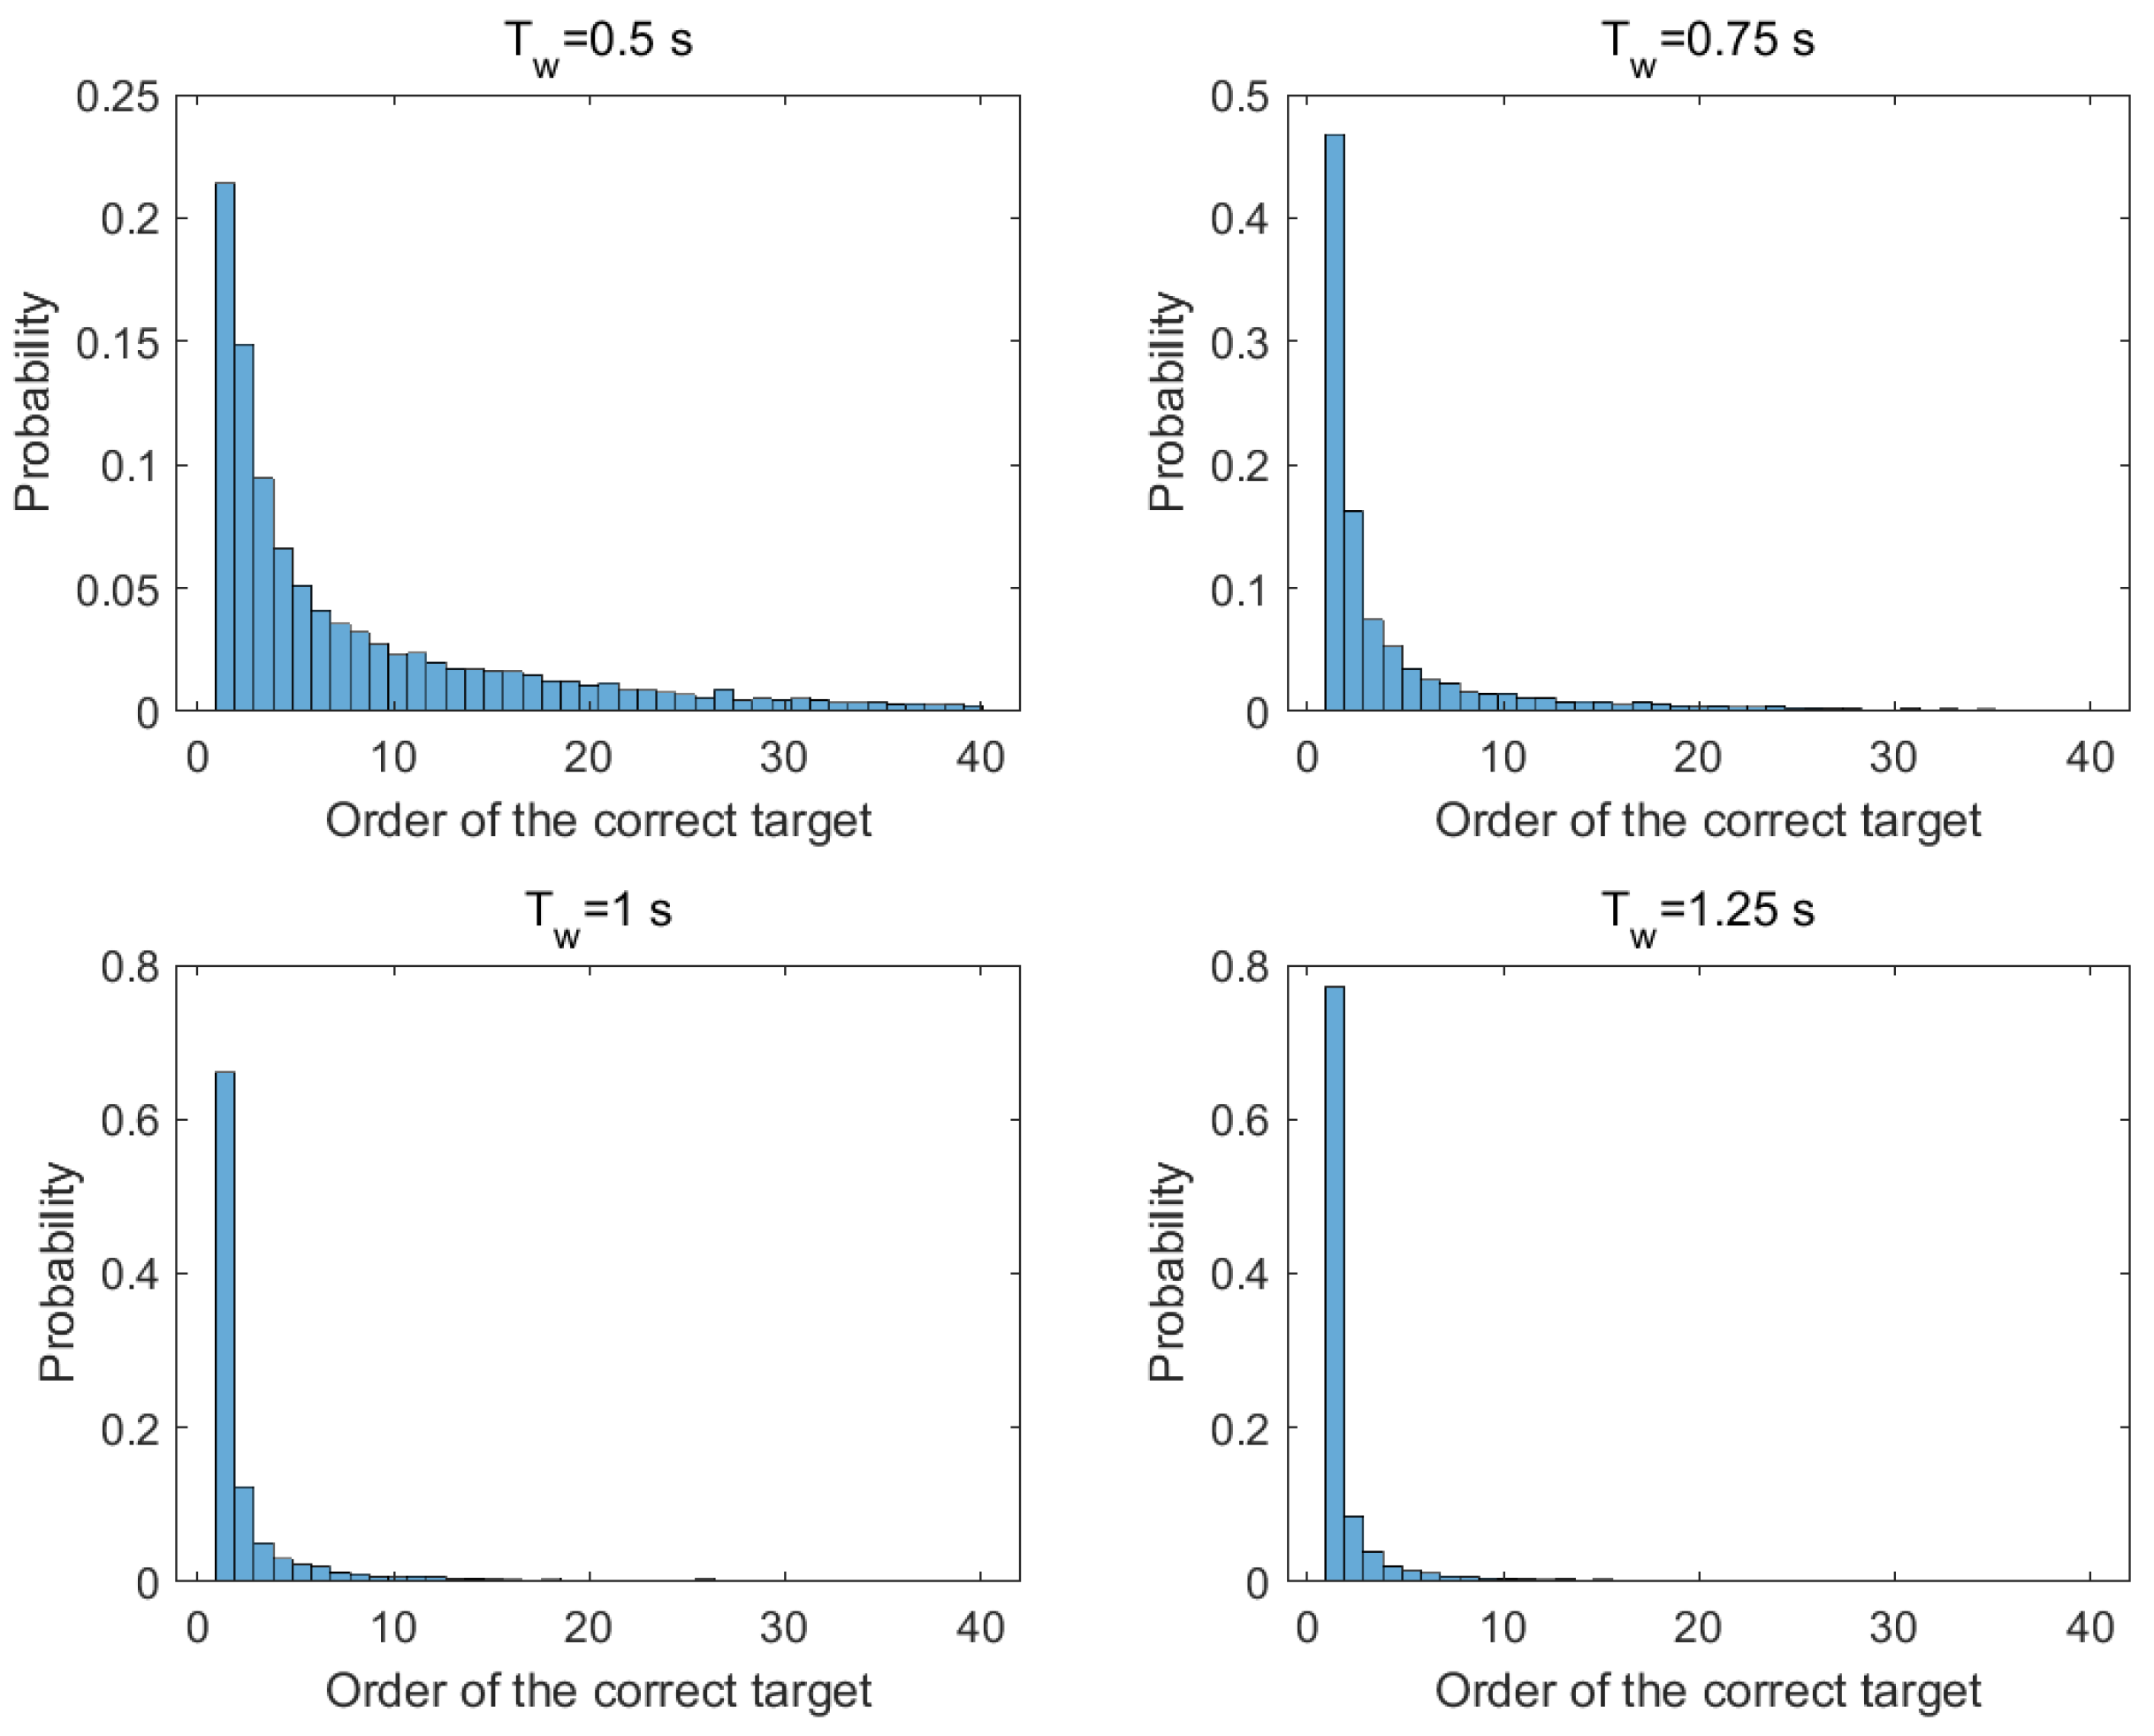
Figure 1 illustrates the statistical probability of the correct target’s order under different data lengths in the SSVEP benchmark dataset. From the figure, it can be easily found that the order of the correct target is concentrated in the first few places, especially the first and second. Meanwhile, aggregation degrees increase with data length. If the received data are used as the training data, the detector only needs the first
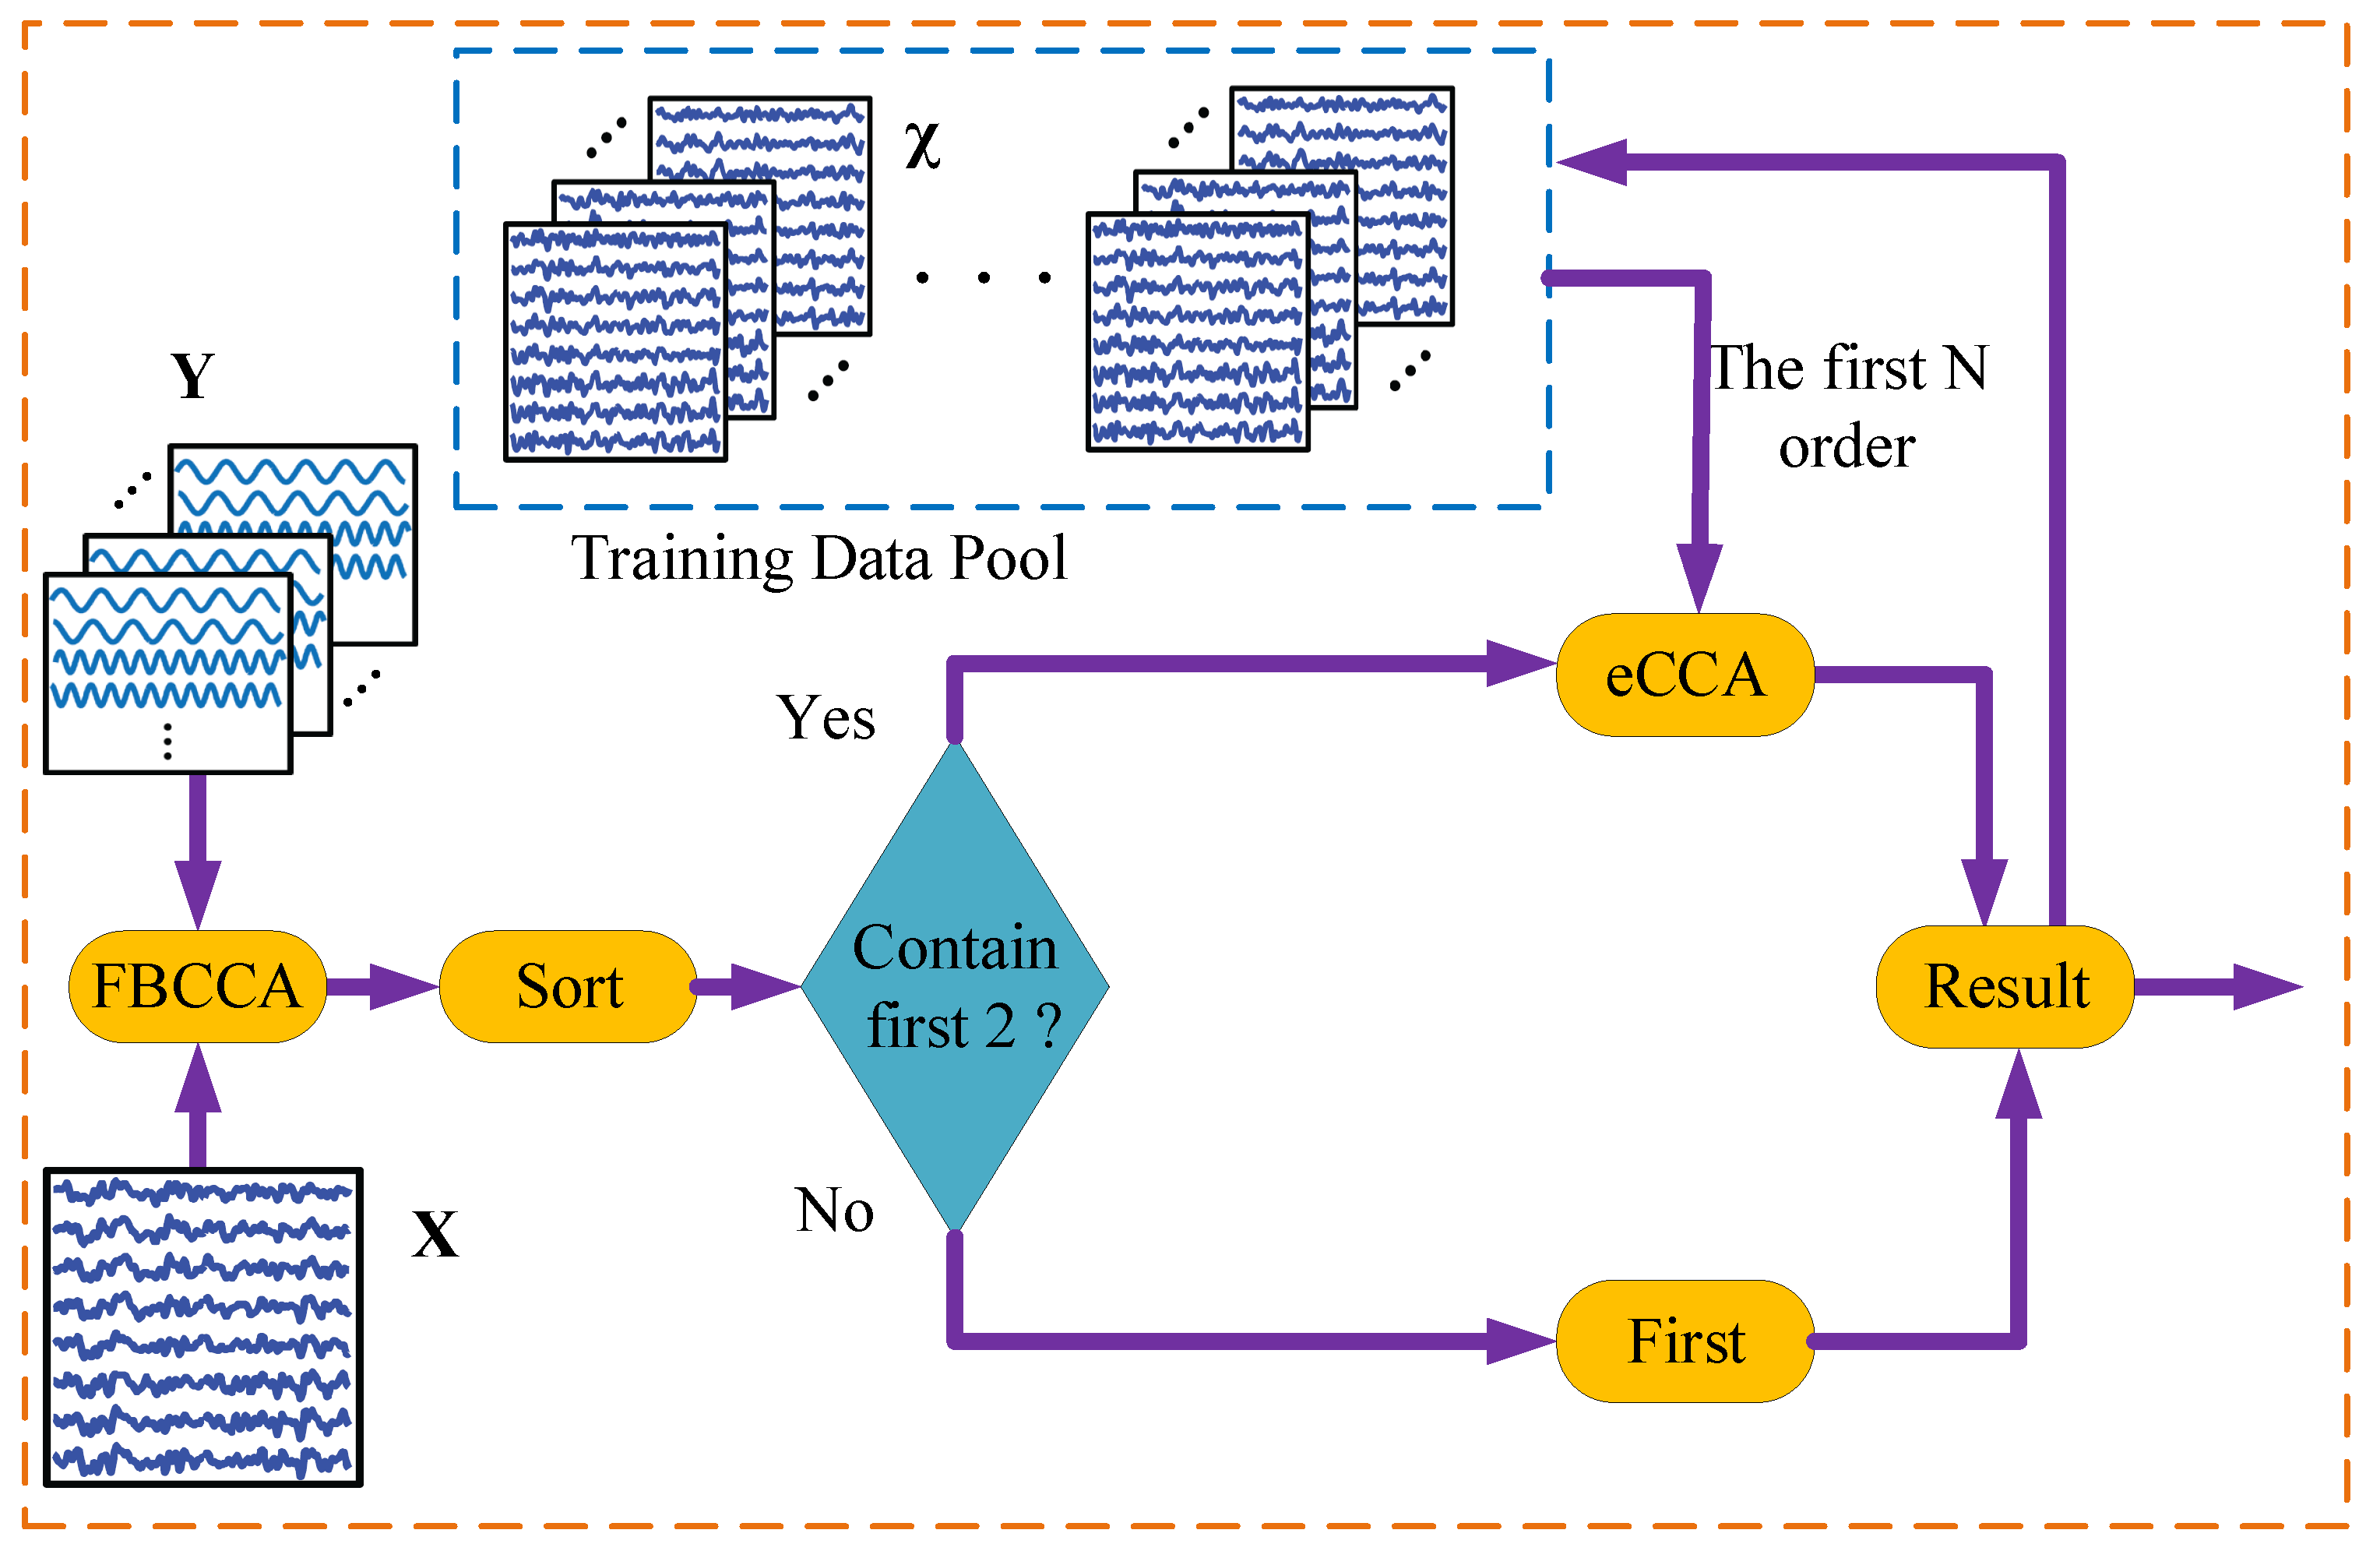
N data rather than the complete training dataset to achieve supervision detection. Inspired by the turbo engine boosting power by exhaust gas, the turbo detector for SSVEP-based BCIs is proposed in this paper. The flowchart is shown in
Figure 2. The main step of the strategy is specified formally in Algorithm 1. The turbo detector first recognizes the received signal by FBCCA and then finds the first candidates. Then, if the data pool contains the candidates’ training data, it reidentifies them by eCCA. Otherwise, the result of FBCCA is considered the final result. Finally, the received signal is saved into the data pool as training data.
| Algorithm 1 Turbo strategy for SSVEP-based BCIs. |
- 1:
initialize ; - 2:
for do - 3:
- 4:
% from largest to smallest - 5:
if contains 2 targets in the training data; then ; % reidentifies the top N order Results - 6:
else Results - 7:
end if - 8:
end for
|
To analyze the performance, two assumptions are proposed.
Assumption 1: The accuracy of the supervision algorithm is higher than that of the unsupervised algorithm under the same condition [
11].
In the turbo detector, it means that the performance of the second-stage detector is superior to the first-stage detector via assumption 1.
Assumption 2: The order is positively sorted to the probability of the correct target.
Let
and
denote the accuracy of FBCCA and eCCA, respectively, and
denotes the correct identification. Supposing the probability of the target order in the sort determined by the FBCCA, it can be expressed as:
,
, ⋯,
. The essential aspects of assumption 2 can be described as follows
The recognition ability of FBCCA can be expressed as , and the recognition ability of eCCA can be expressed as , where N denotes the order of the sort that input the second-stage detector. Based on assumption 1, we have .
Furthermore, according to Bayes’ theorem, the accuracy of the turbo strategy can be calculated as follows:
Let
denote the probability that the training data pool contains the required data. Along with the user’s continuous input of characters, the training data pool is continuously expanding [
26]. Therefore, the value of
increases with use time until it reaches one; the data pool contains at least one experiment of each candidate’s goal and forms a complete dataset. Before the data pool collects at least one complete training set, the value of
N is another factor affecting
. When
,
without complete training datasets. When
(the minimum value),
is at its maximum value under the same data pool. In addition to
, the value also has a certain influence on the performance of the second-stage detector. It is not easy to only qualitatively analyze the effect of the value of
N on the performance of the detector. Namely, the value of
N is approximately positively correlated with the second-stage detector’s performance.
Let
T denote the number of trials that complete the training data pool,
denote the number of the candidates of the target and each target has equal probabilities and
denote the number of trials that completes the
-th target to
i-th target. The expectation value of
T is
where
are statistically independent of each other and obey the geometric distribution
,
where
is a harmonic series [
27]. If the received data are used as training data, the detector needs to receive an average of
trials to complete the training dataset. It is inefficient for the detector, especially when the
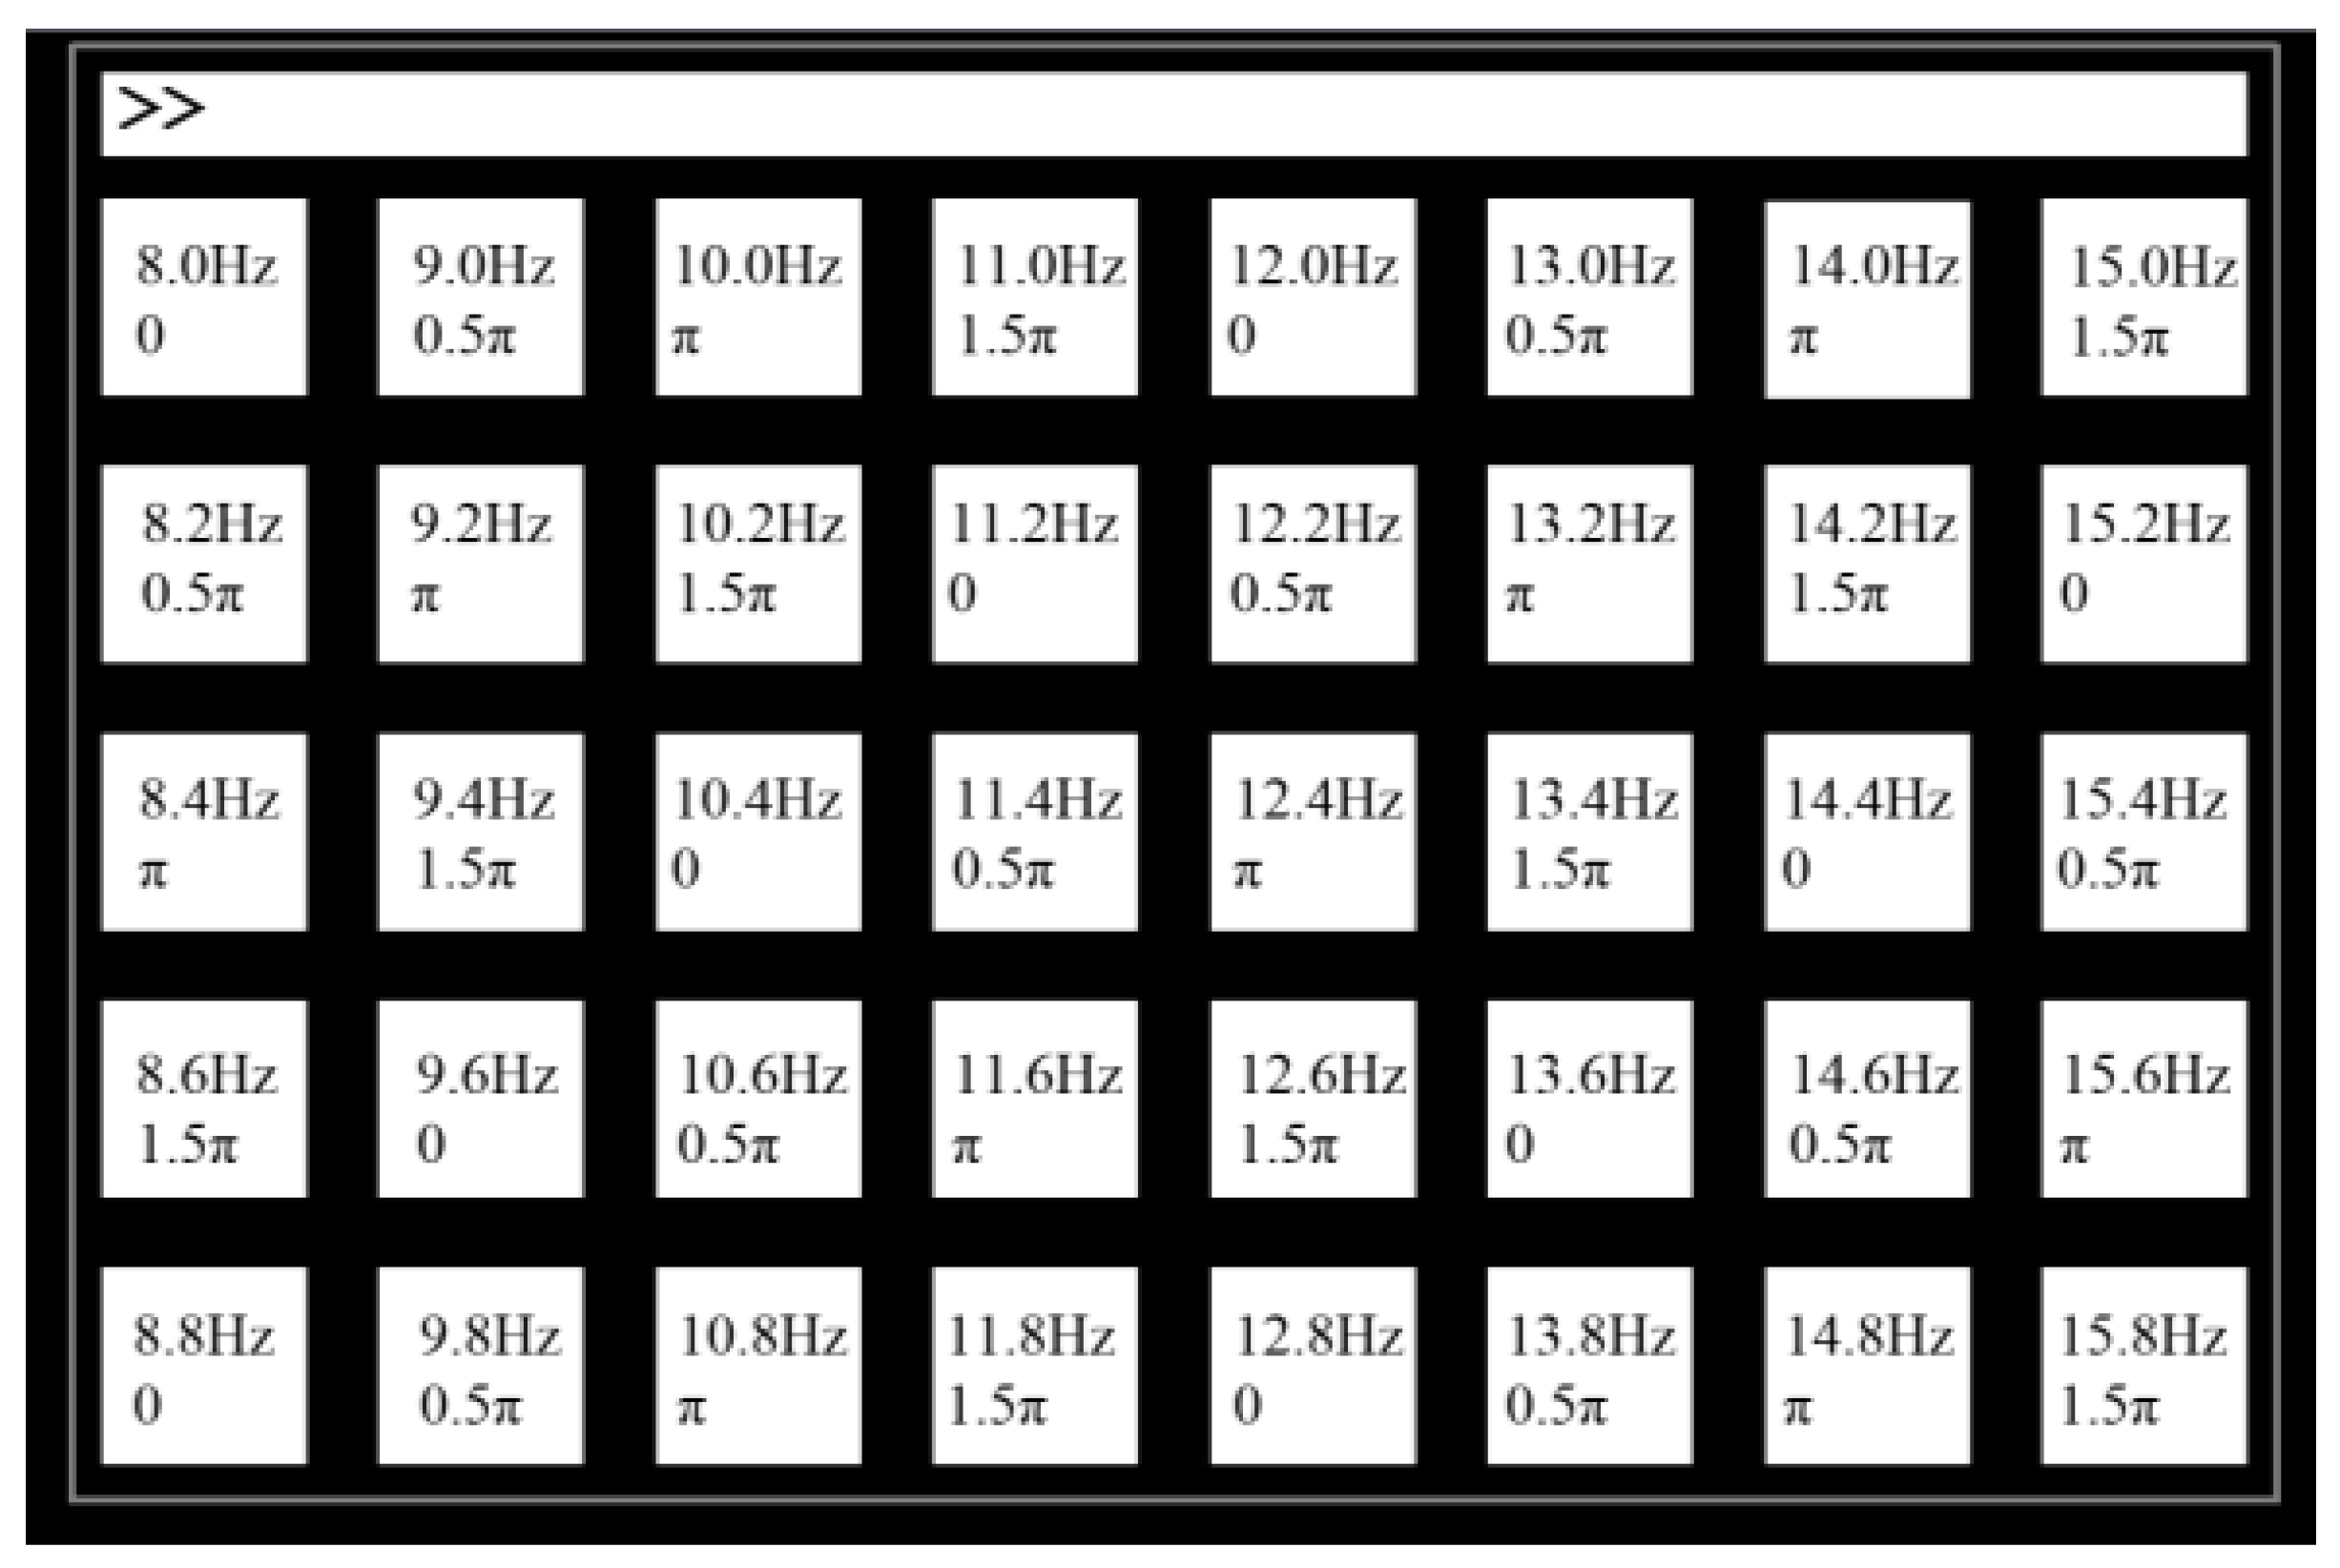
is large. Similar to the most popular 40 target SSVEP-speller, the detector needs to receive 171 trials to complete the training dataset. However, there are only 40 trials that can be used to train the detector, and 131 trials are wasted, which means each target has only one trial to train the detector. According to the flowchart of the turbo strategy and the results from
Figure 2, there only needs to be two largest probability candidates’ training data for the second-stage detector. Here, we set
as the number of trials that can realize the second detection during the
-th target to
i-th target, let
denote the average probability that the received data can be detected by the supervised algorithm through the training data pool. Similarly, we have
and
and
Furthermore, the number of trials can be calculated as follows:
,
,
According to Equations (12) and (13), it can be easily calculated for the 40 target speller that an average of 111 trials can employ the supervised method, and only 20 trials are wasted before the data pool collects a complete training dataset.
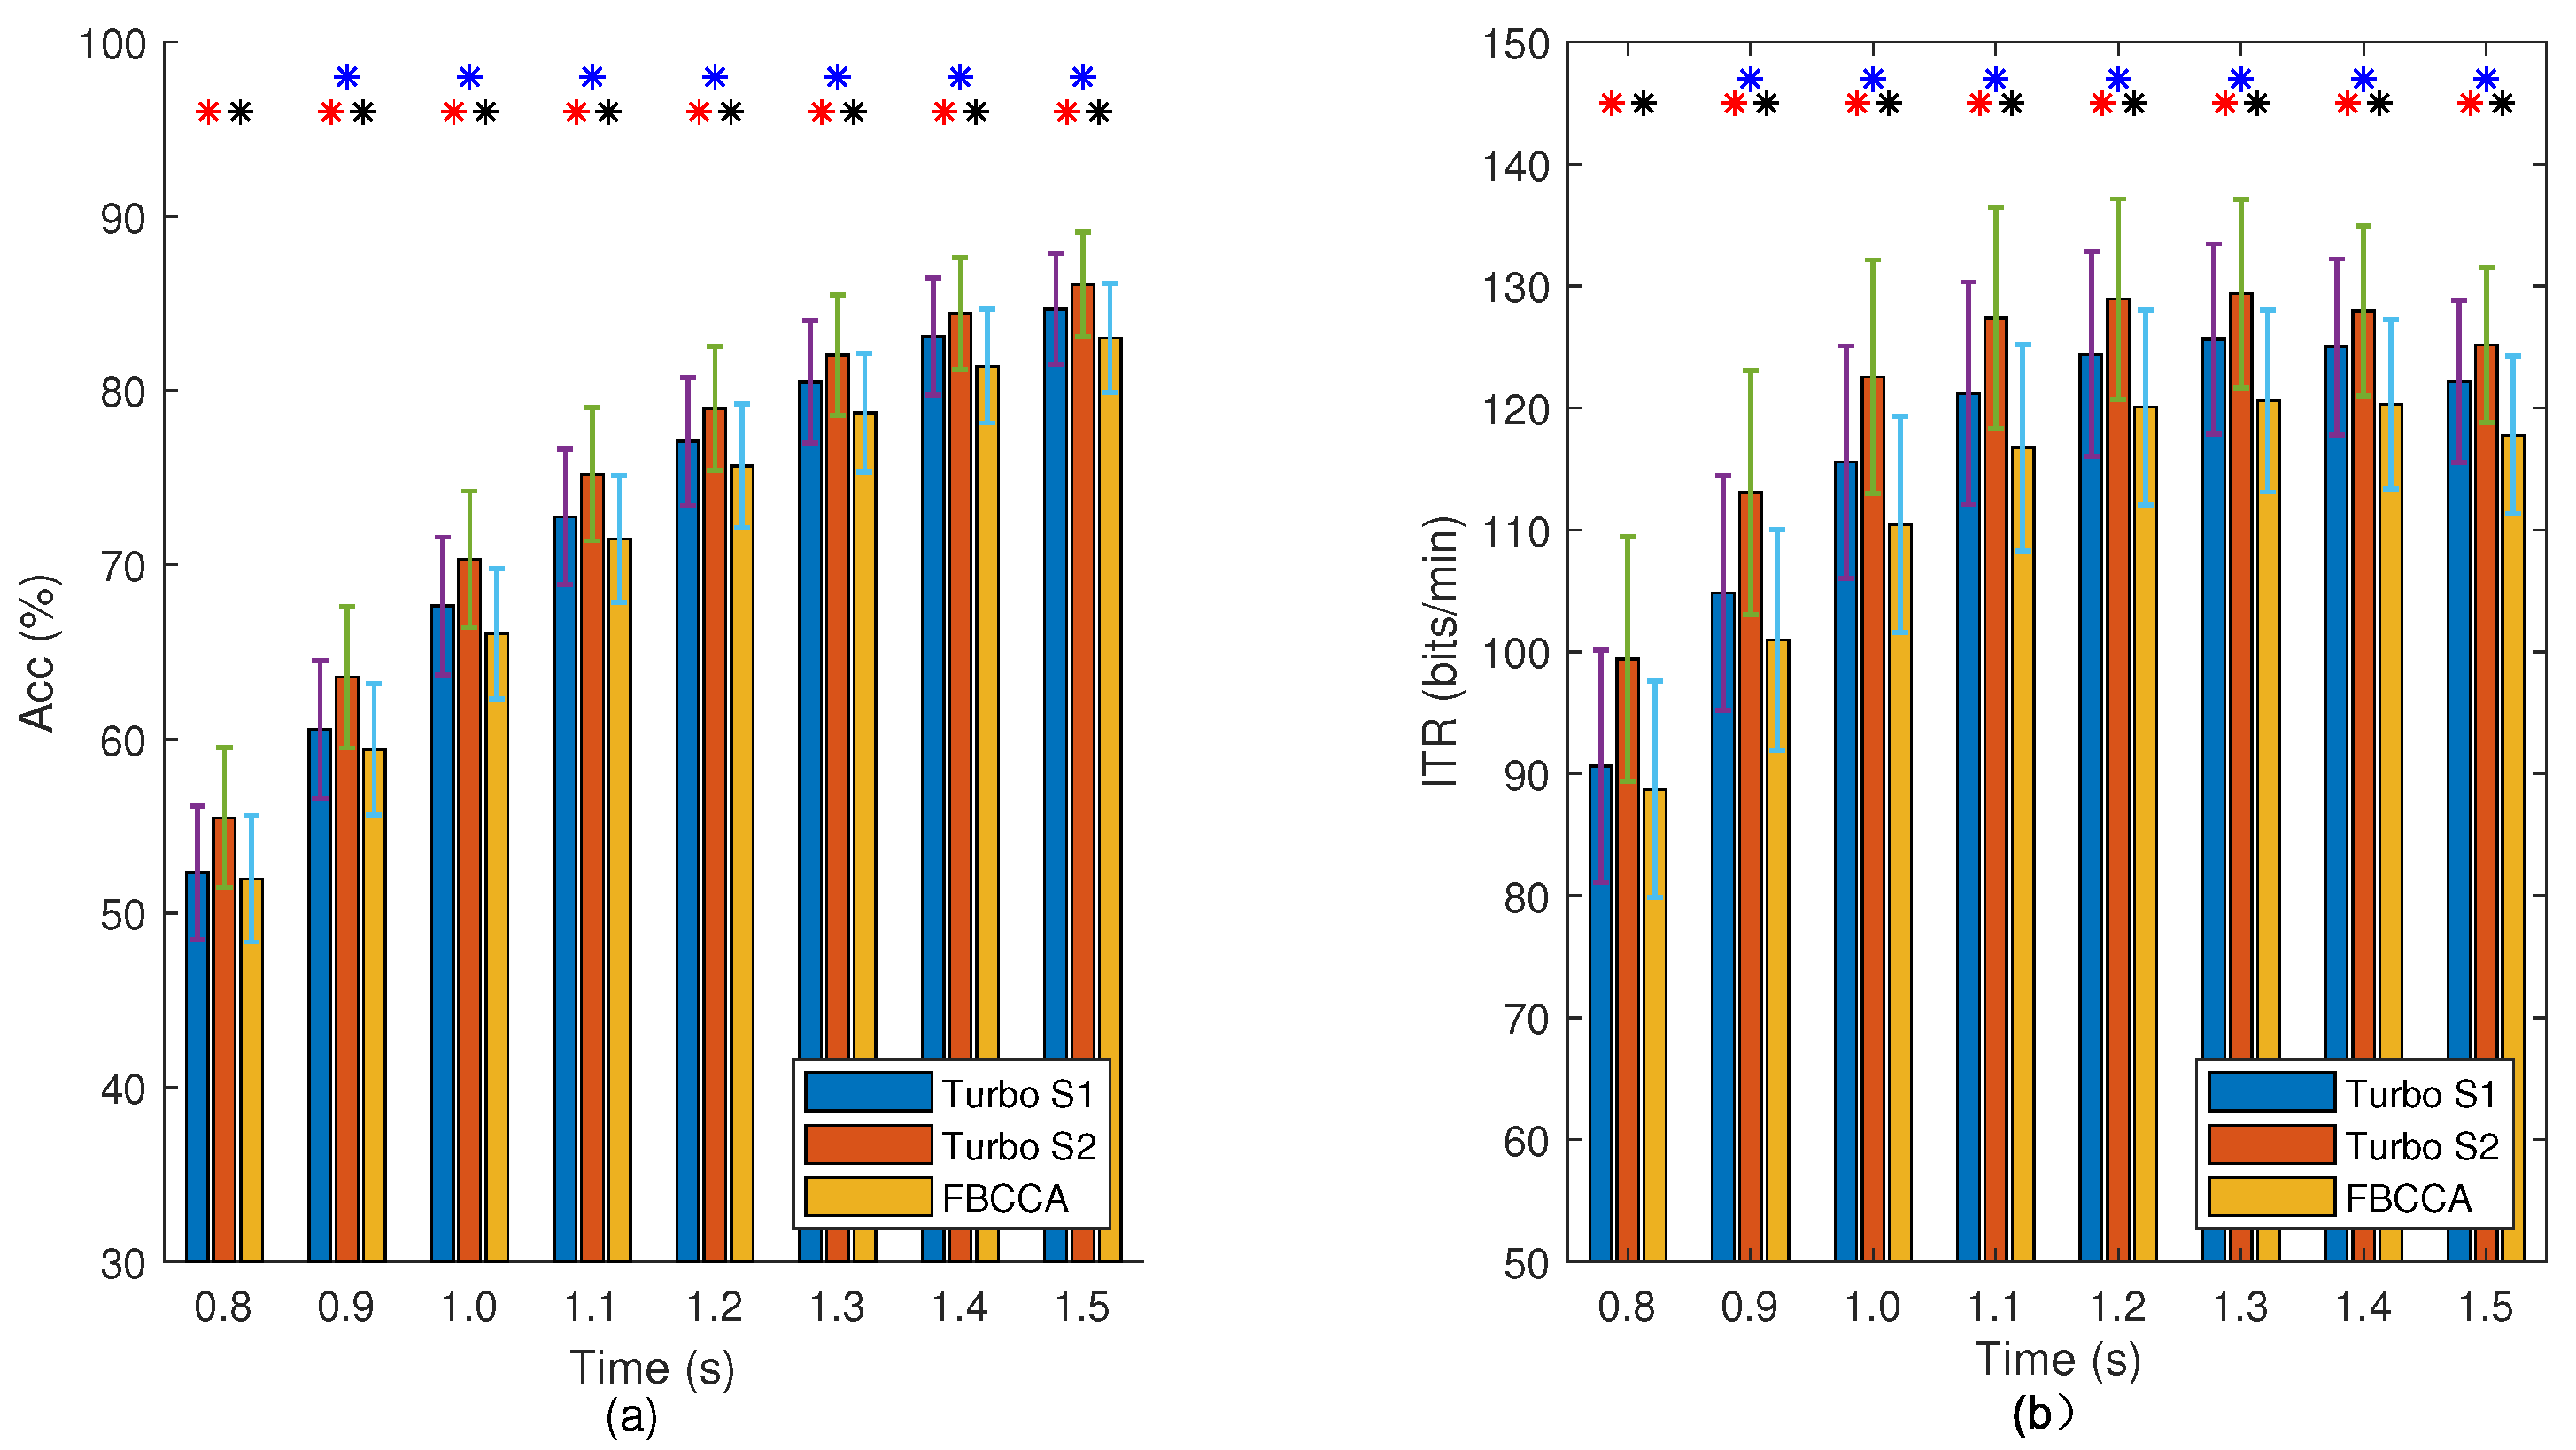
2.3. Training Data Selection
Different from traditional training datasets, the proposed training data pool is dynamic; its label may be wrong, the number of each stimulus is not equal and the training data of some stimuli may be missing. The selected training data directly affects the performance of the second-stage detector. Let the received data be
, where
denotes the identified result (it may be wrong) and
j denotes the
j-th trial identified as
stimulus. Let
denote the training data pool of
stimulus, where
denotes the number of trials of the
stimulus. The data pool can be denoted as
. Let
denote the training data selected from
. In this work, we propose two strategies for selecting the training data for the second-stage detector. Let
denote the data pool sorted corresponding to Equation (
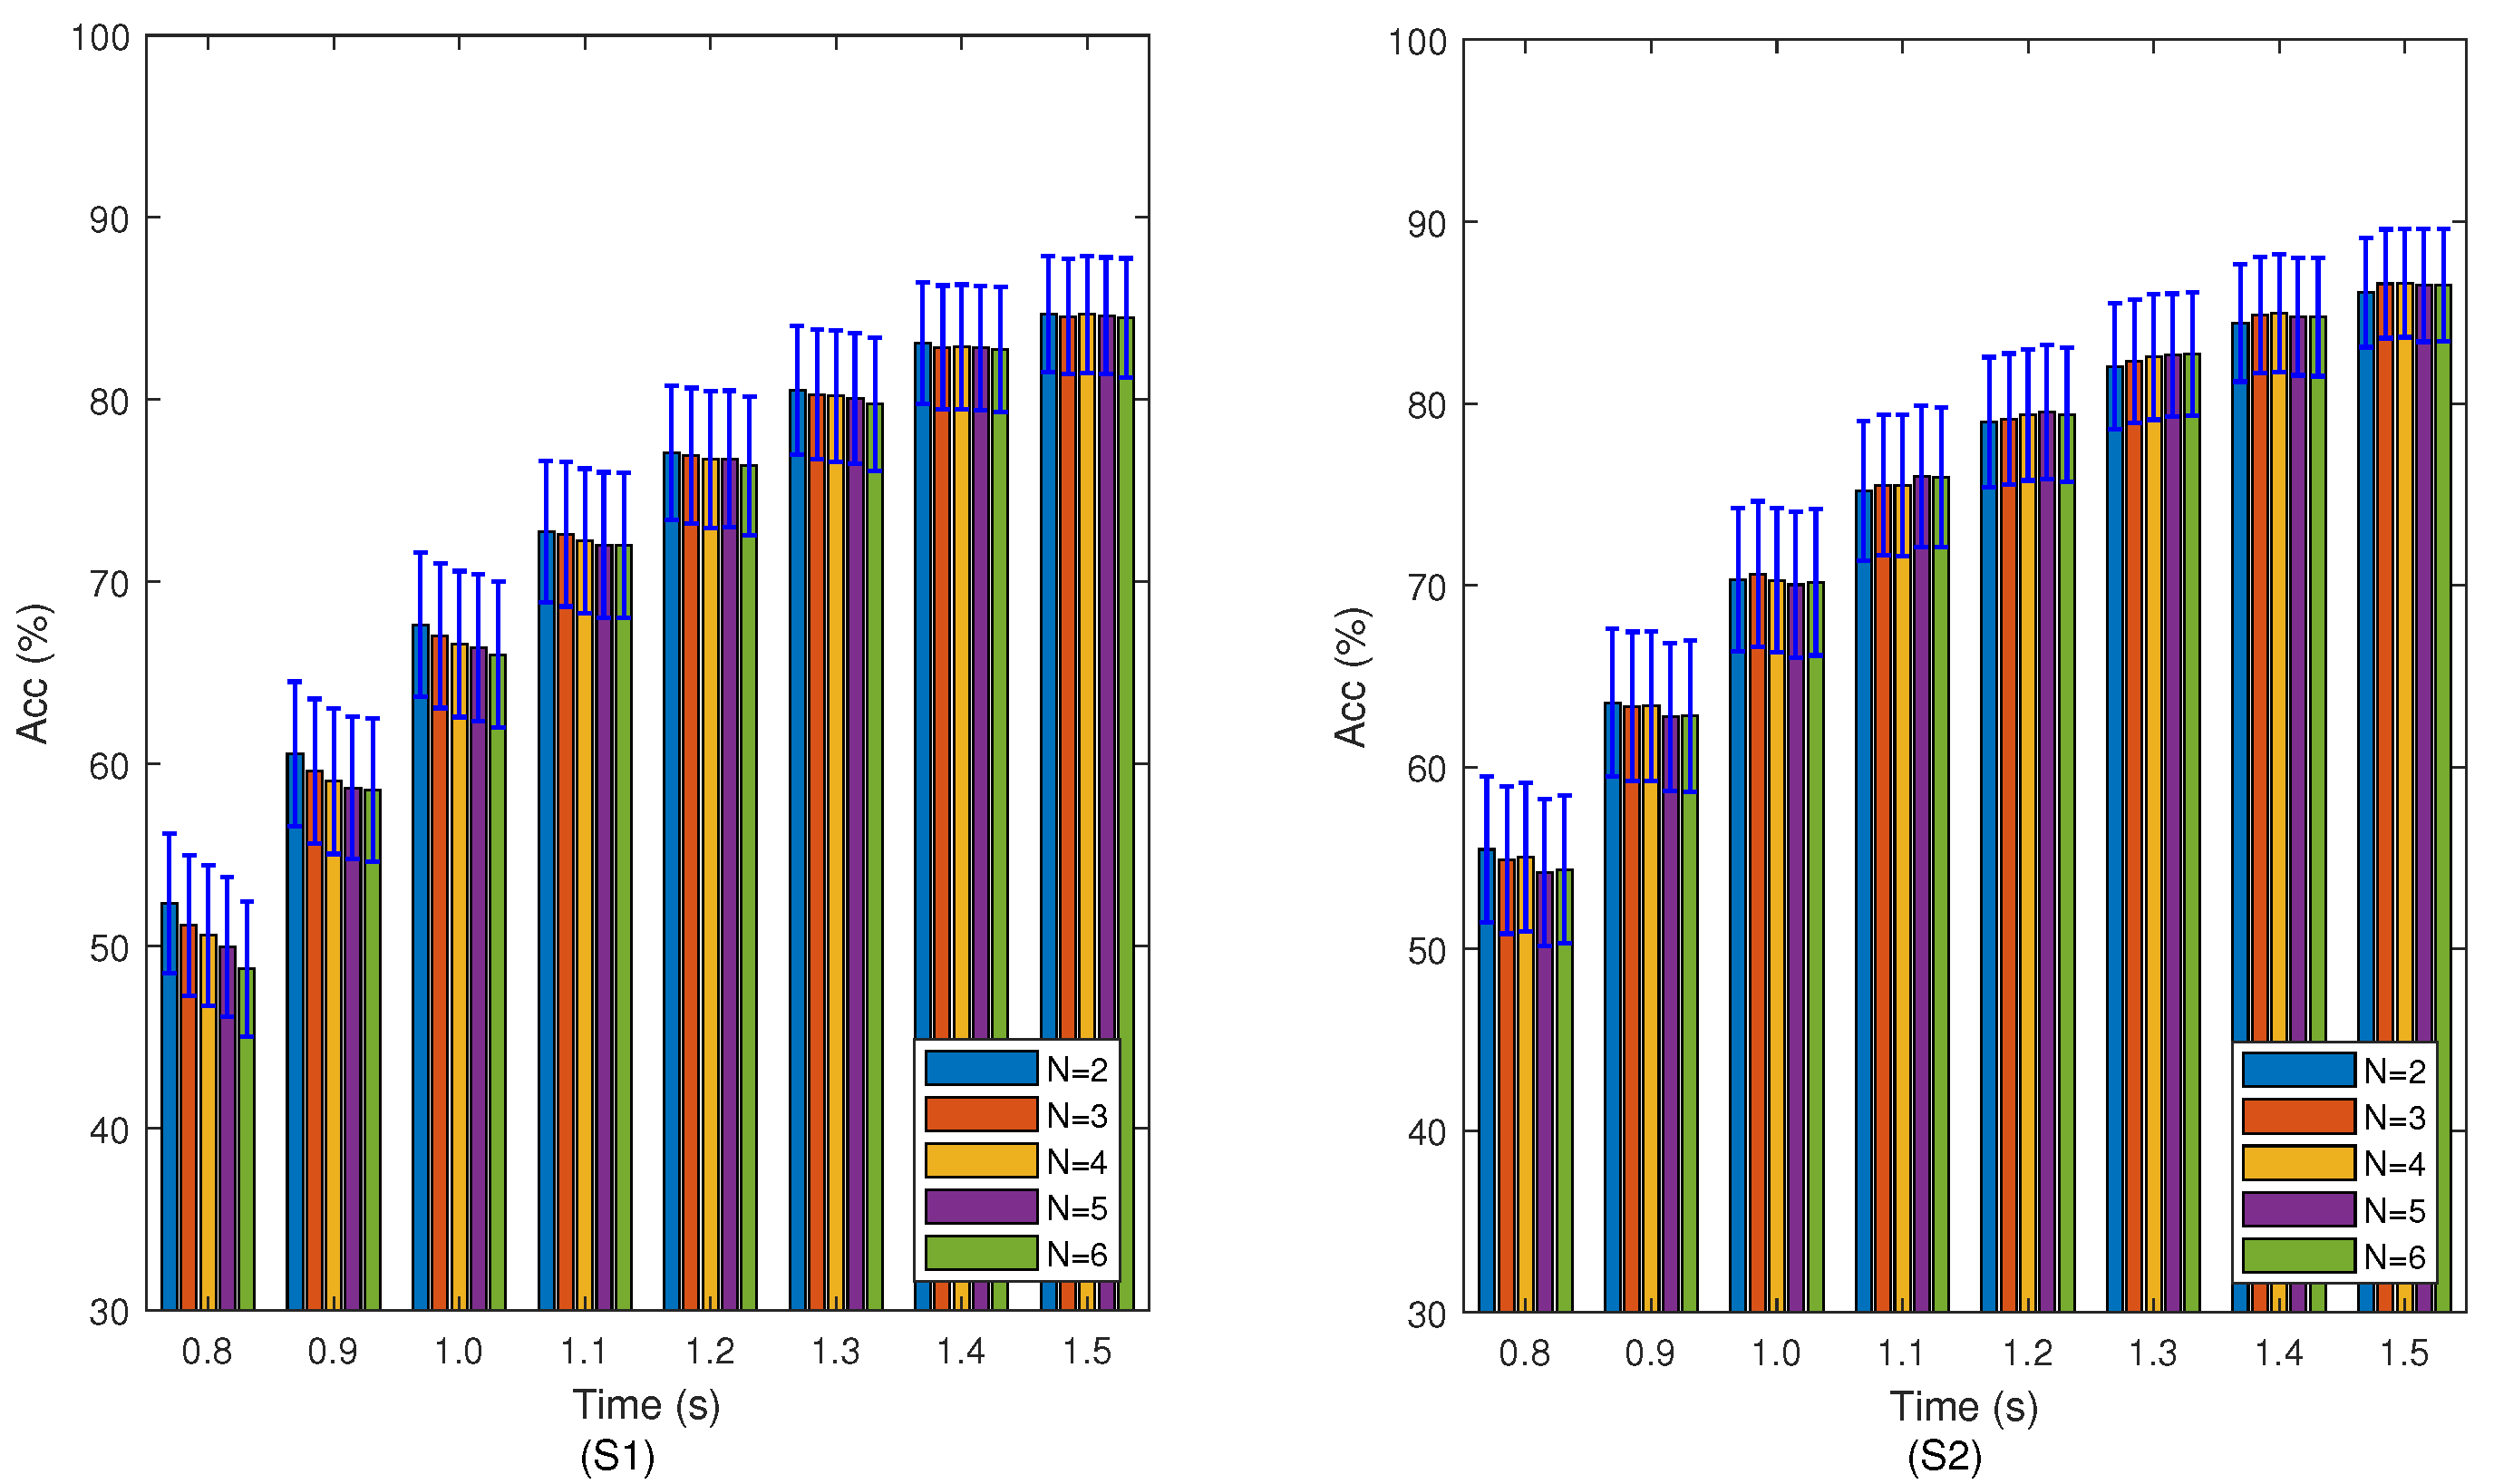
6). The first strategy (S1) selects the top
N candidate targets in the sort, and the latest trial for each stimulus is treated as training data. The training data selected from
is
, where the latest received data are
,
k denotes the order in
. The second strategy (S2) selects the top
N candidate targets in the sort, and the average of all the trials corresponding to each stimulus are treated as training data. The training data selected from the data pool are
, where
is a third-order tensor that contains all the received data from the
k-th stimulus.
The detector selects the training data from the data pool in Algorithm 2.
| Algorithm 2 Training data selection method. |
- 1:
initialize and ; - 2:
for do Identify - 3:
end for
|


