
Spatial Pattern and Formation Mechanism of Rural Tourism Resources in China: Evidence from 1470 National Leisure Villages


Abstract
:1. Introduction
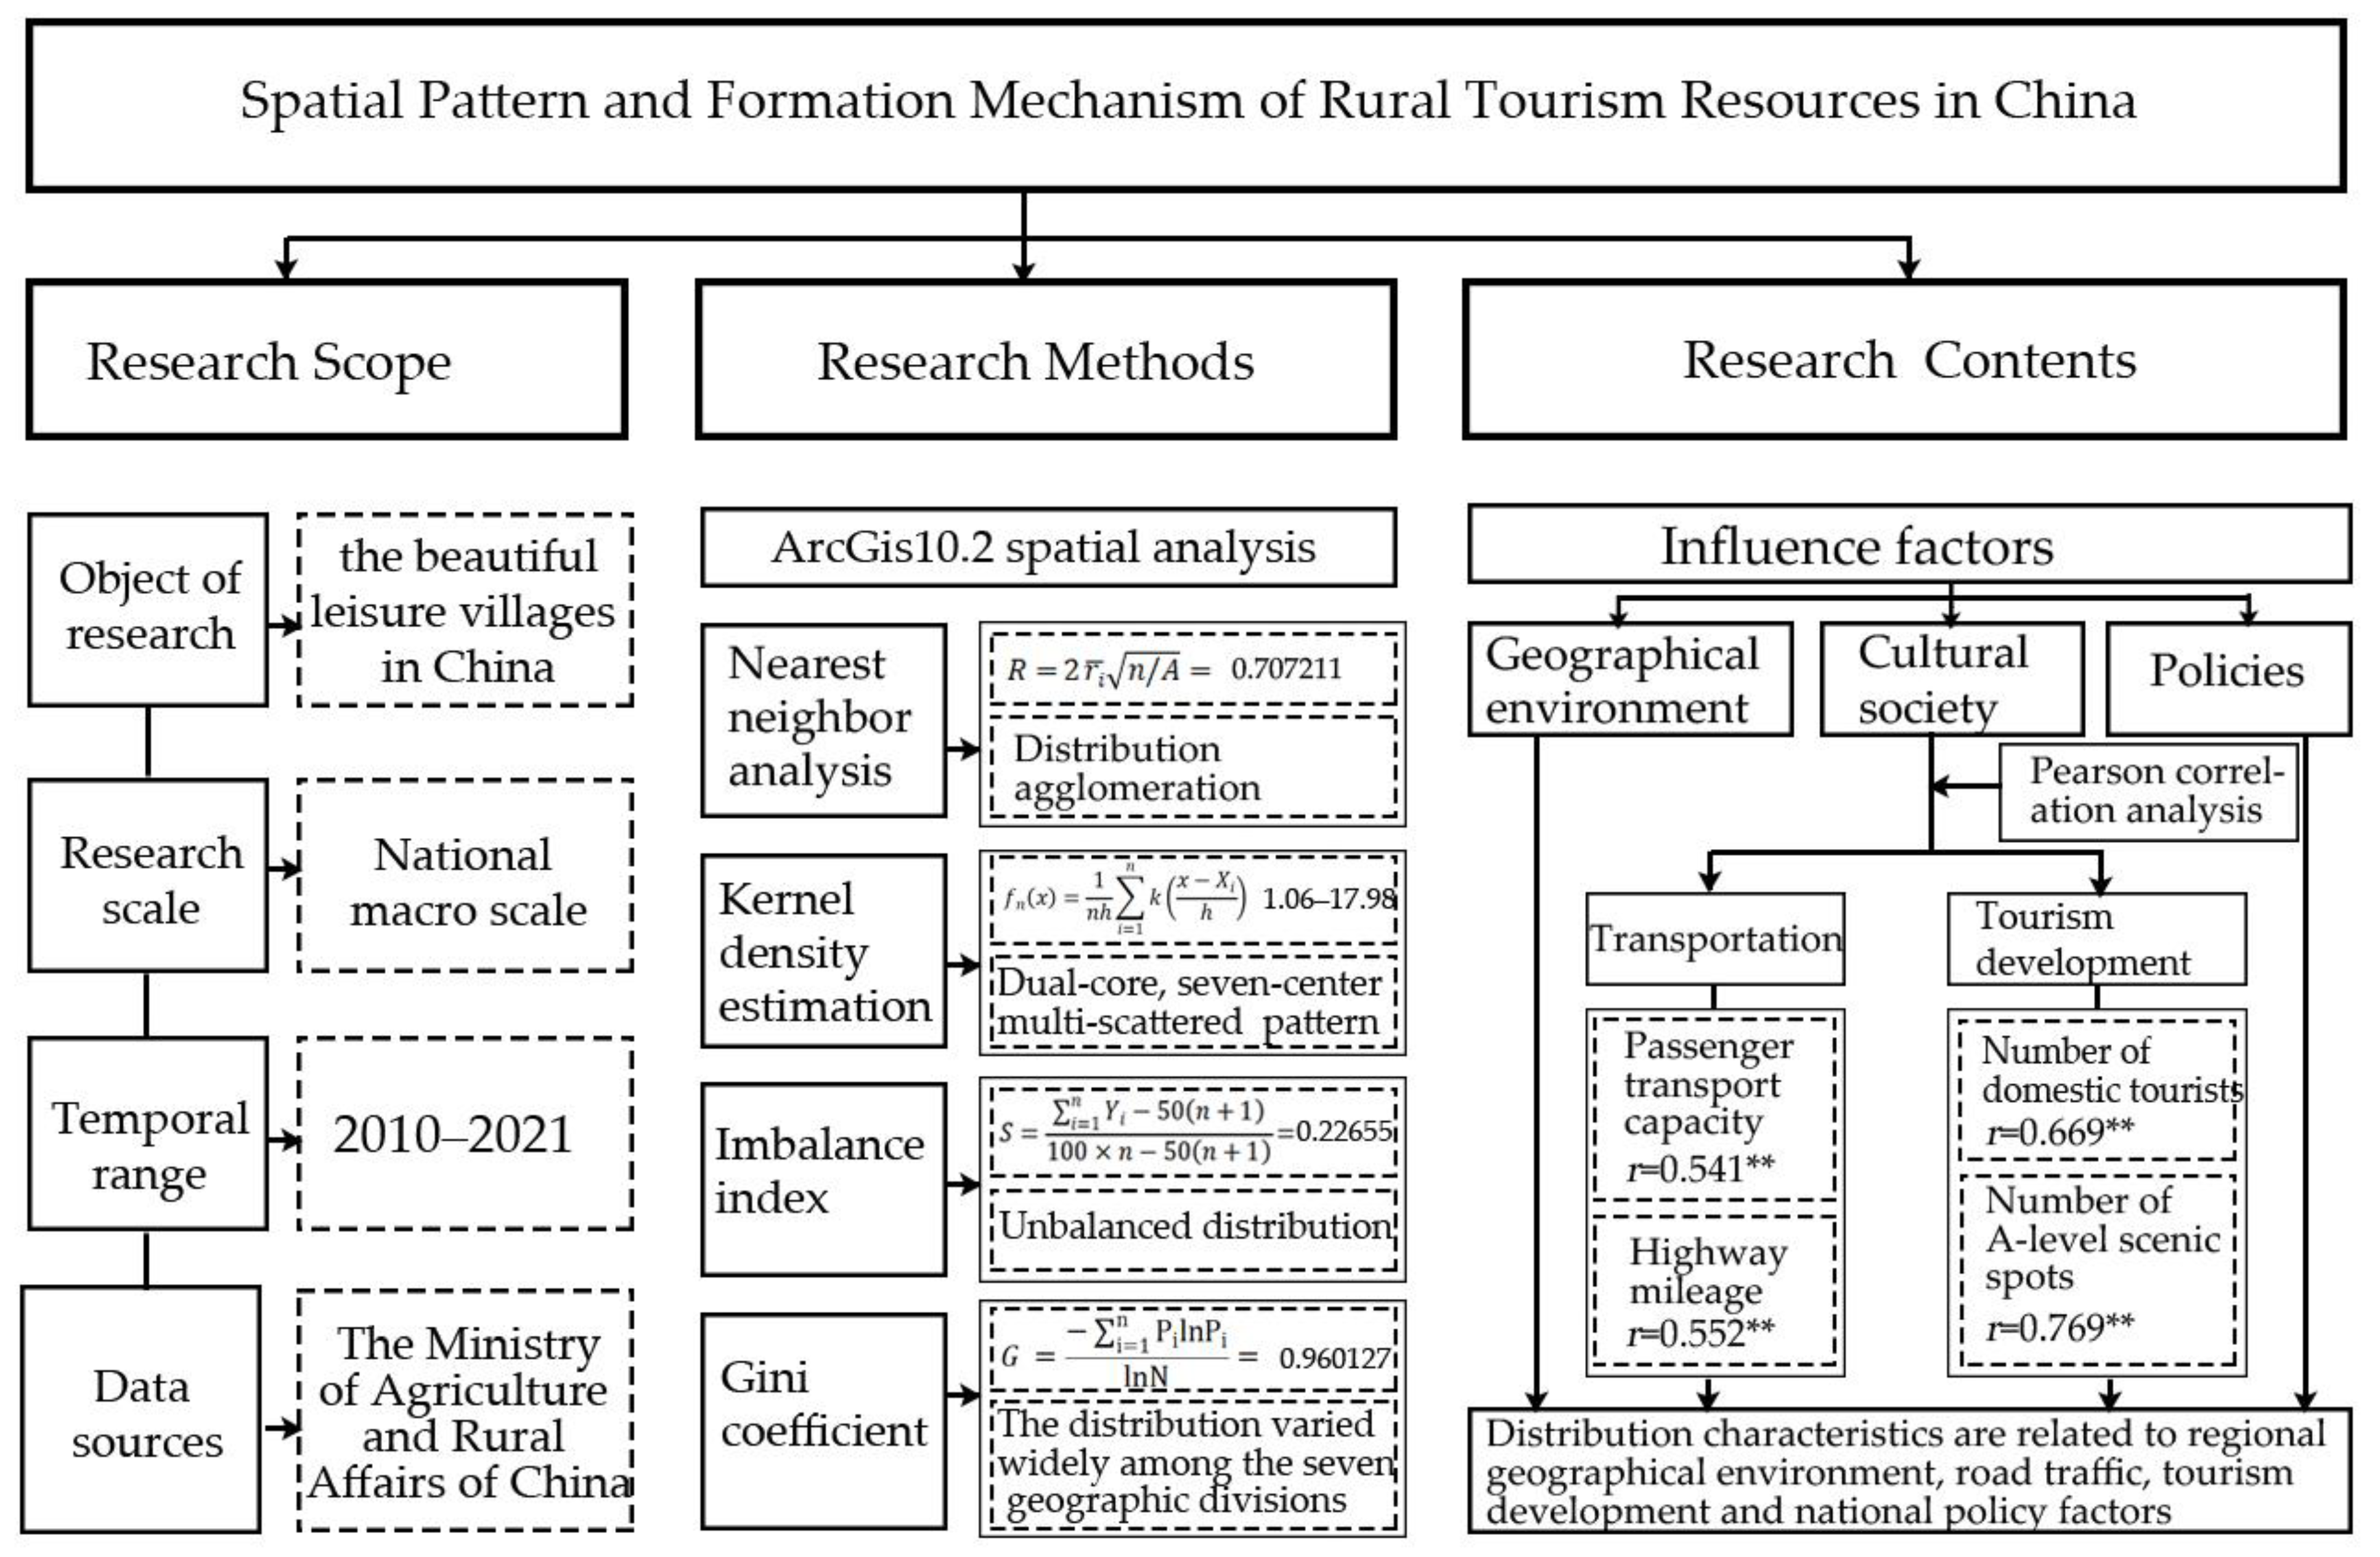
2. Materials and Methods
2.1. Material Sources
2.2. Study Methods
2.2.1. Nearest Neighbor Analysis
2.2.2. Kernel Density Estimation
2.2.3. Imbalance Index
2.2.4. Gini Coefficient
2.2.5. Pearson’s Correlation Coefficient
3. Results
3.1. Overview of the Study Subjects
- (1)
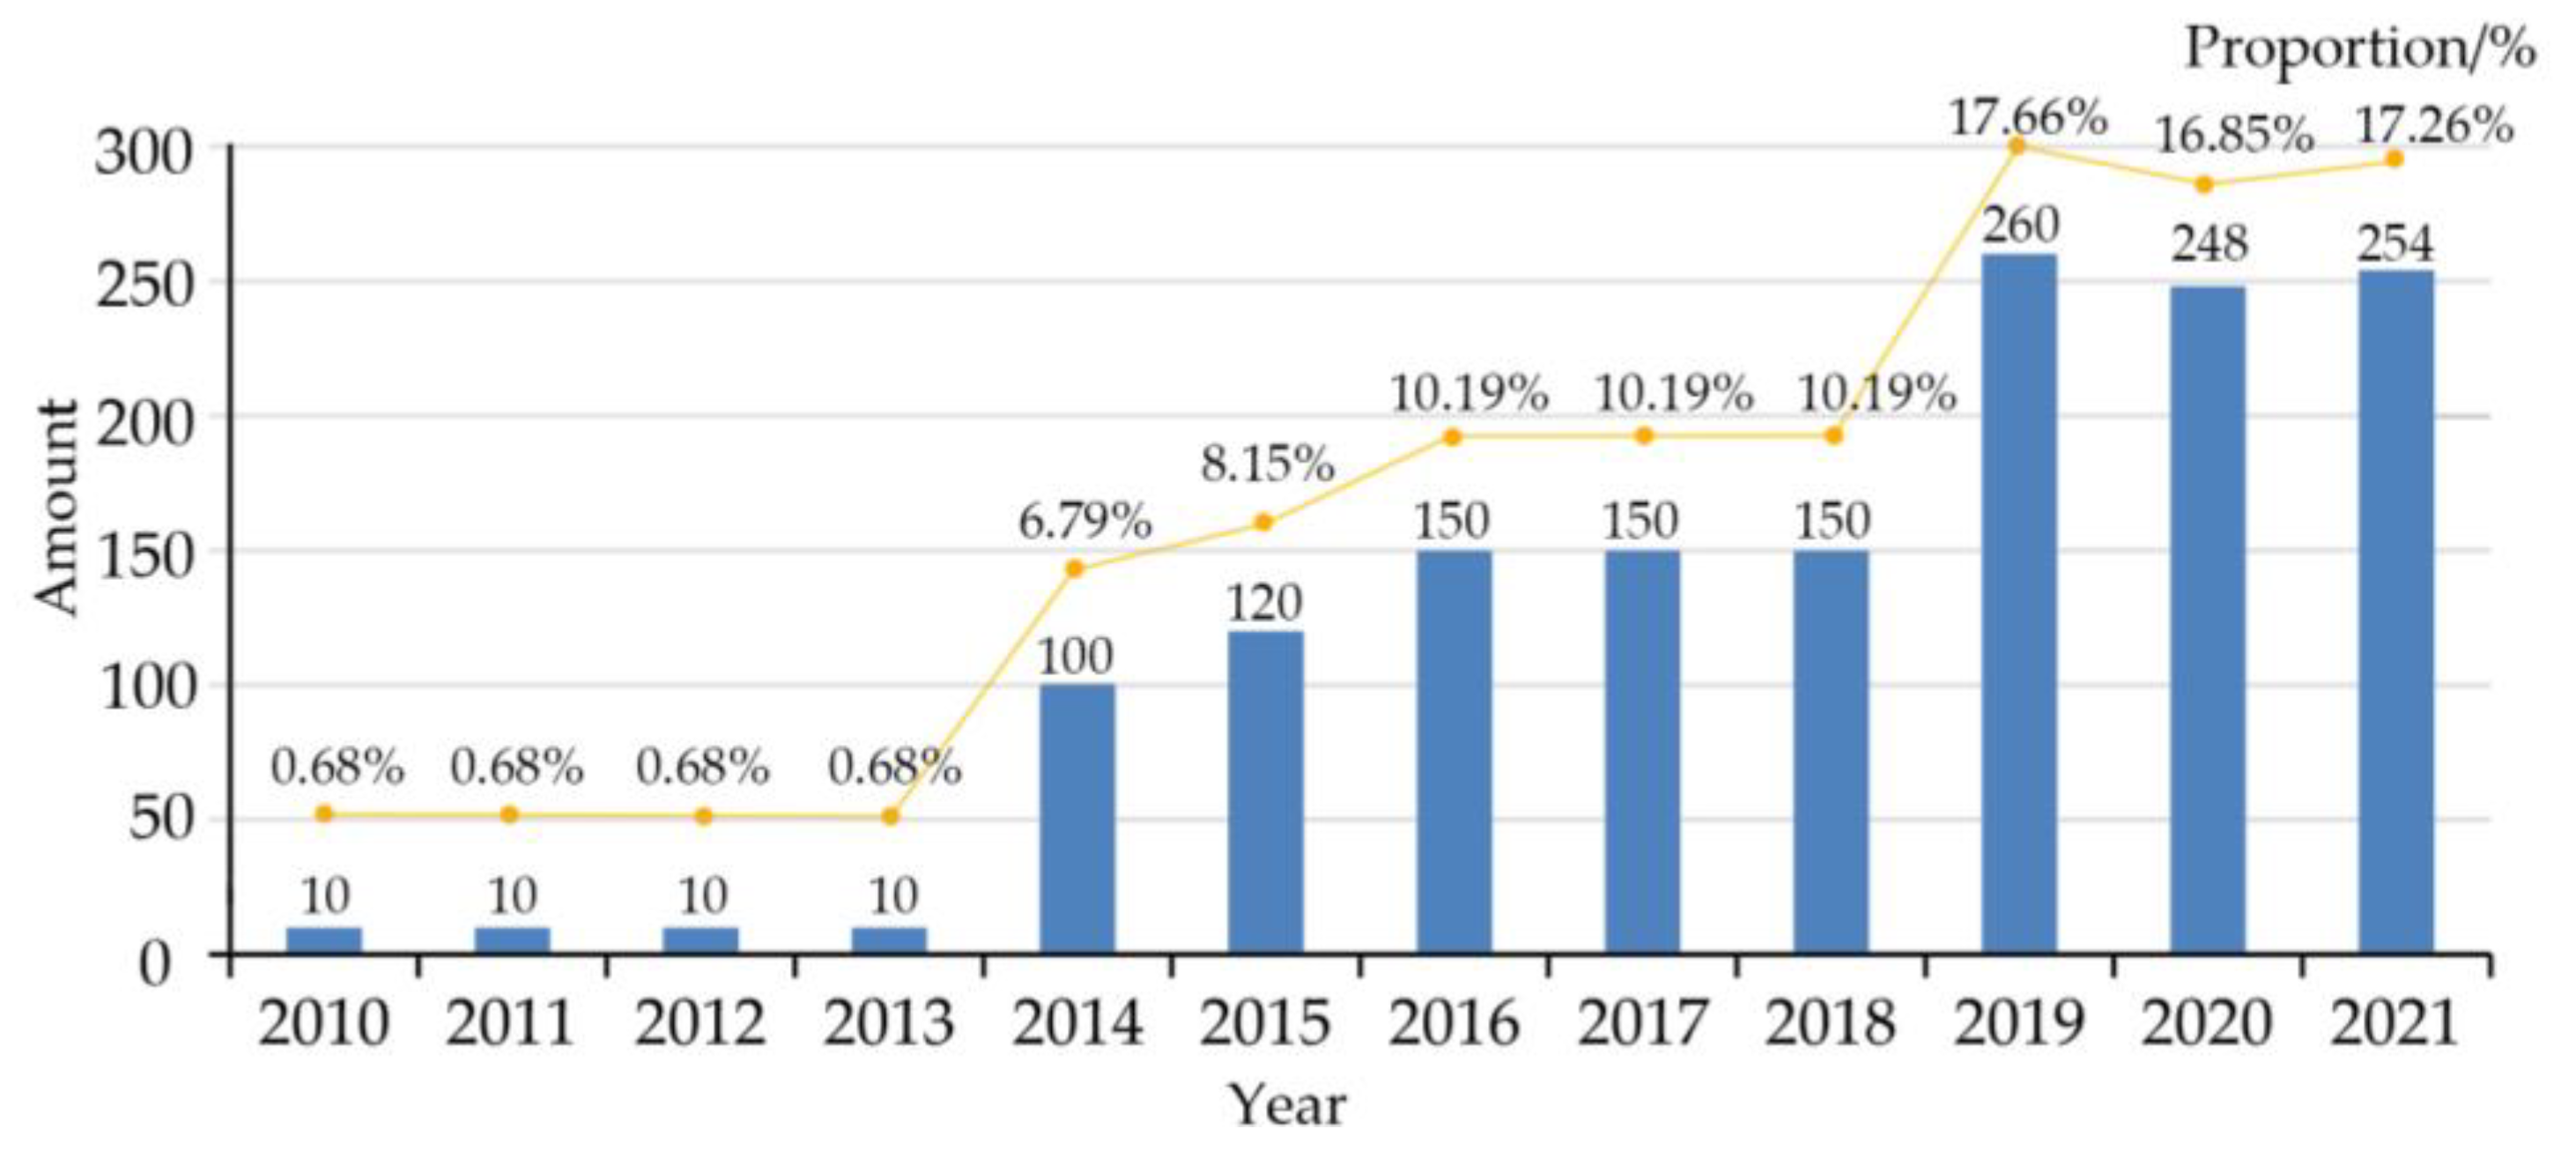
- From 2010 to 2013, in the early stage of development, 10 villages were selected every year, and the number of areas and villages involved in the list remained unchanged. Within 4 years, the selection involved 22 provinces and administrative regions. The initial criteria definition was less dimensional, mainly focusing on external conditions such as complete management and facilities. In 2007, the 17th National Congress of the Communist Party of China proposed to “coordinate urban and rural development and promote the construction of a new socialist countryside” [51]. In 2008, Anji County in Zhejiang province formally proposed the “Chinese Beautiful Village” plan, which promoted the development of rural construction in various areas [52].
- (2)
- In 2014–2018, the number of defined villages increased in uniform growth in the middle of development. In 2013, national policy documents first proposed the goal of the new rural construction of “beautiful villages”, promoting protection of the rural ecological environment and the village’s appearance and gradually enriching the types of BLVCs [53]. After 2014, the defined number of BLVCs increased significantly compared with the initial stage and then gradually stabilized at 150 villages every year. In 2018, the 19th National Congress of the Communist Party of China proposed the rural revitalization strategy, which became the guide for rural development in the new era [54].
- (3)
- From 2019 to 2021, the development of BLVCs also entered a new growth stage. Compared with 2018, the defined number increased by 110, nearly three times the growth rate of the second stage. The definition standard tended to improve, and more attention was paid to displaying the villages’ advantages and characteristics.
3.2. Spatial Distribution Characteristics
3.2.1. Spatial Distribution Pattern
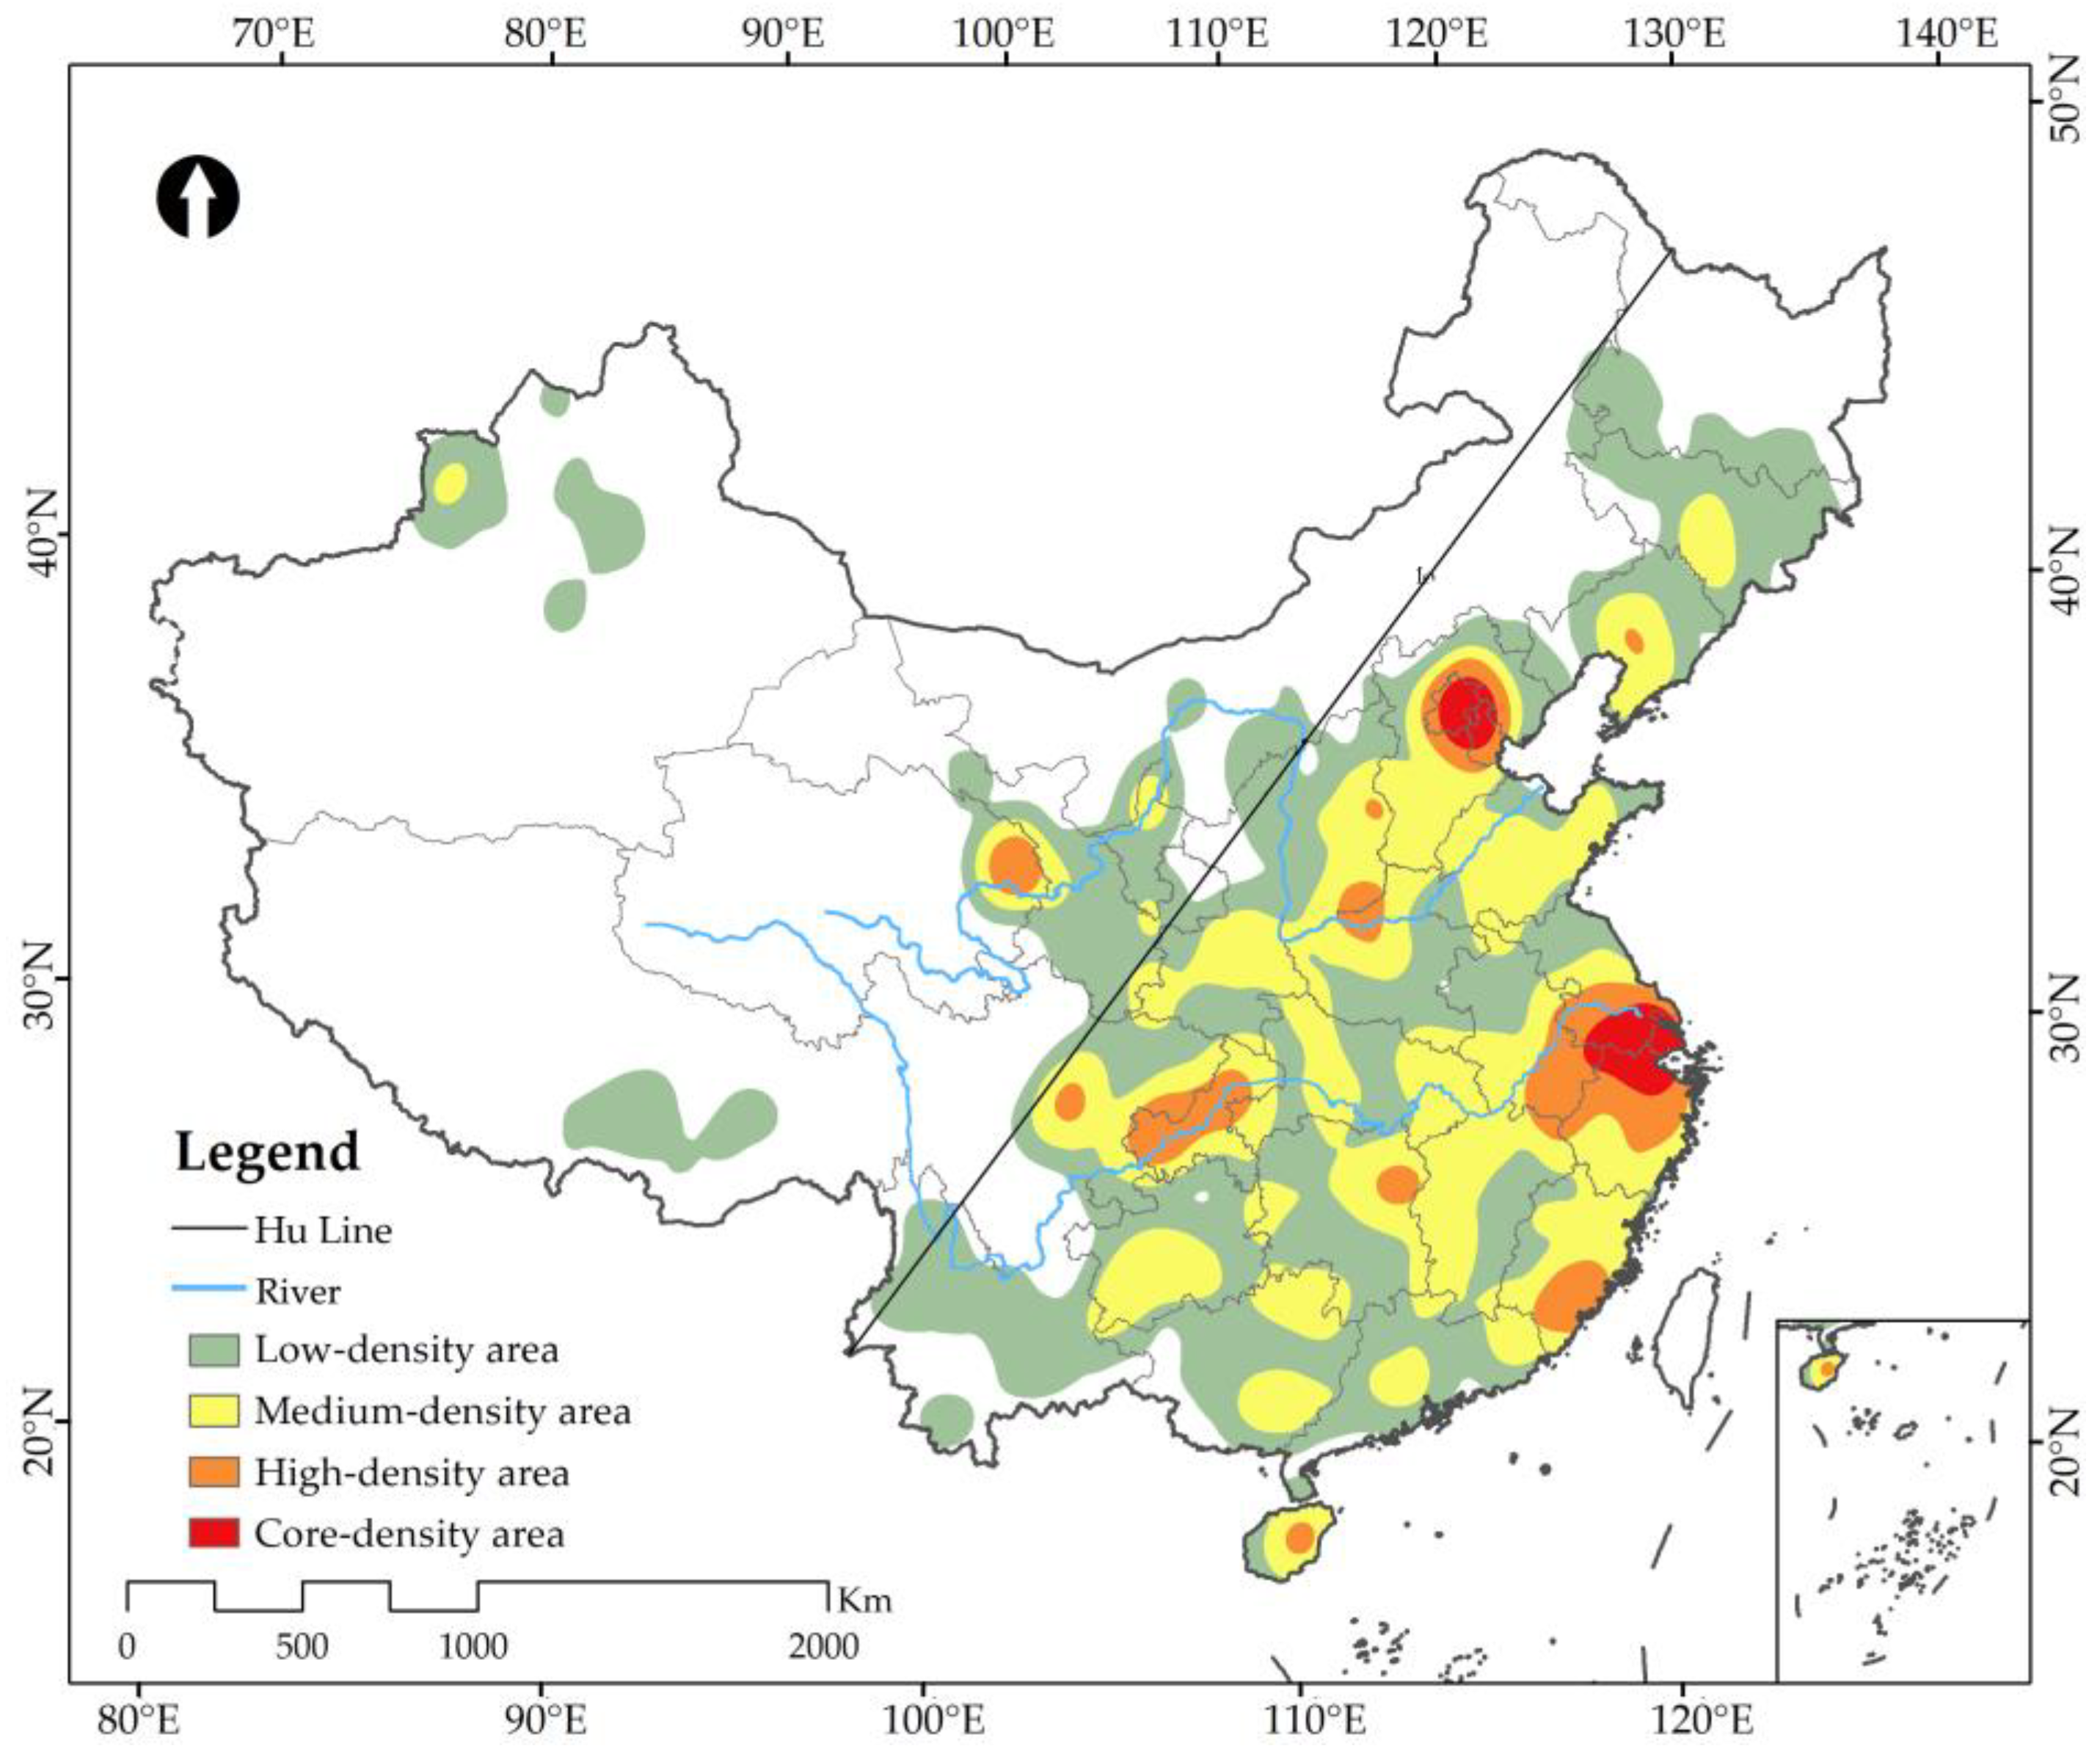
3.2.2. Spatial Distribution Density
- (1)
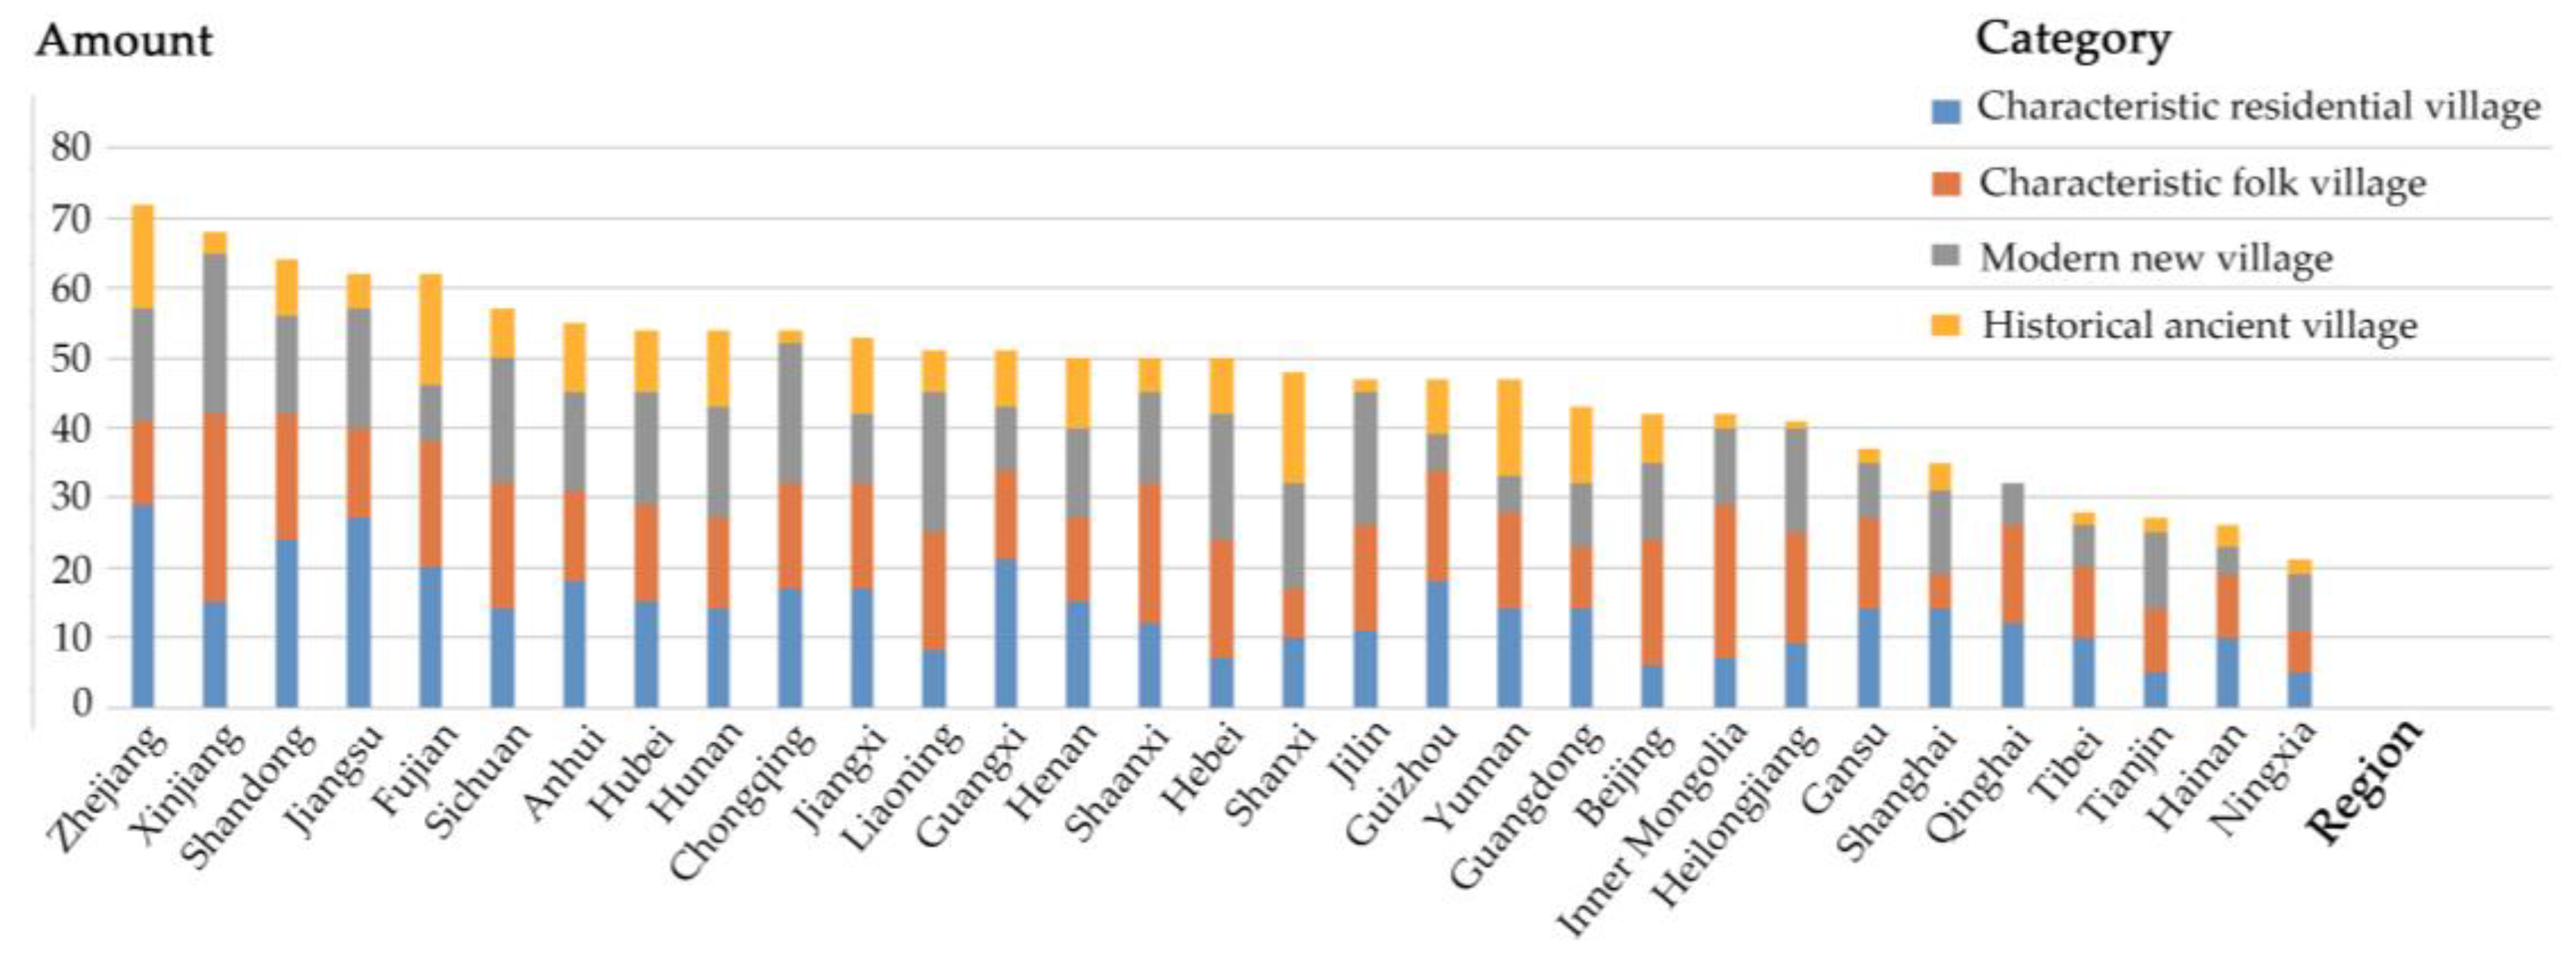
- “Dual core“ refers to two core density areas: the Yangtze River Delta region bordering Shanghai (35), Zhejiang (72) and Jiangsu (62) as the core, radiating to Anhui (55), and Bei**g (42) and Tian** (27) as the core, which then radiates to Hebei (48). The kernel density index of the core density was between 5.36 and 17.98.
- (2)
- “Seven centers” refers to seven high-density core regions: Chongqing (54) as the center radiating to Sichuan (57), Henan (50) as the center radiating to Shanxi (48), Hunan (54) as the center radiating to Jiangxi (53) and Hubei (54), Qinghai (54) as the center radiating to Gansu (53) and Fujian (63) as the center radiating to Guangdong (43), with the remaining locations of Liaoning (52) and Hainan (26) being two single-center areas. The kernel density index in the high-density region was between 1.06 and 10.09.
- (3)
- “Multiple scattered points” refers to the 11 scattered points distributed in other parts of China, including Shandong (64), Shaanxi (50), Jilin (47), Heilongjiang (41), Guangxi (51), Ningxia (22), **njiang (68), Inner Mongolia (42) and Tibet (28). The kernel density indexes of the medium and low densities were between 1.06 and 5.36.
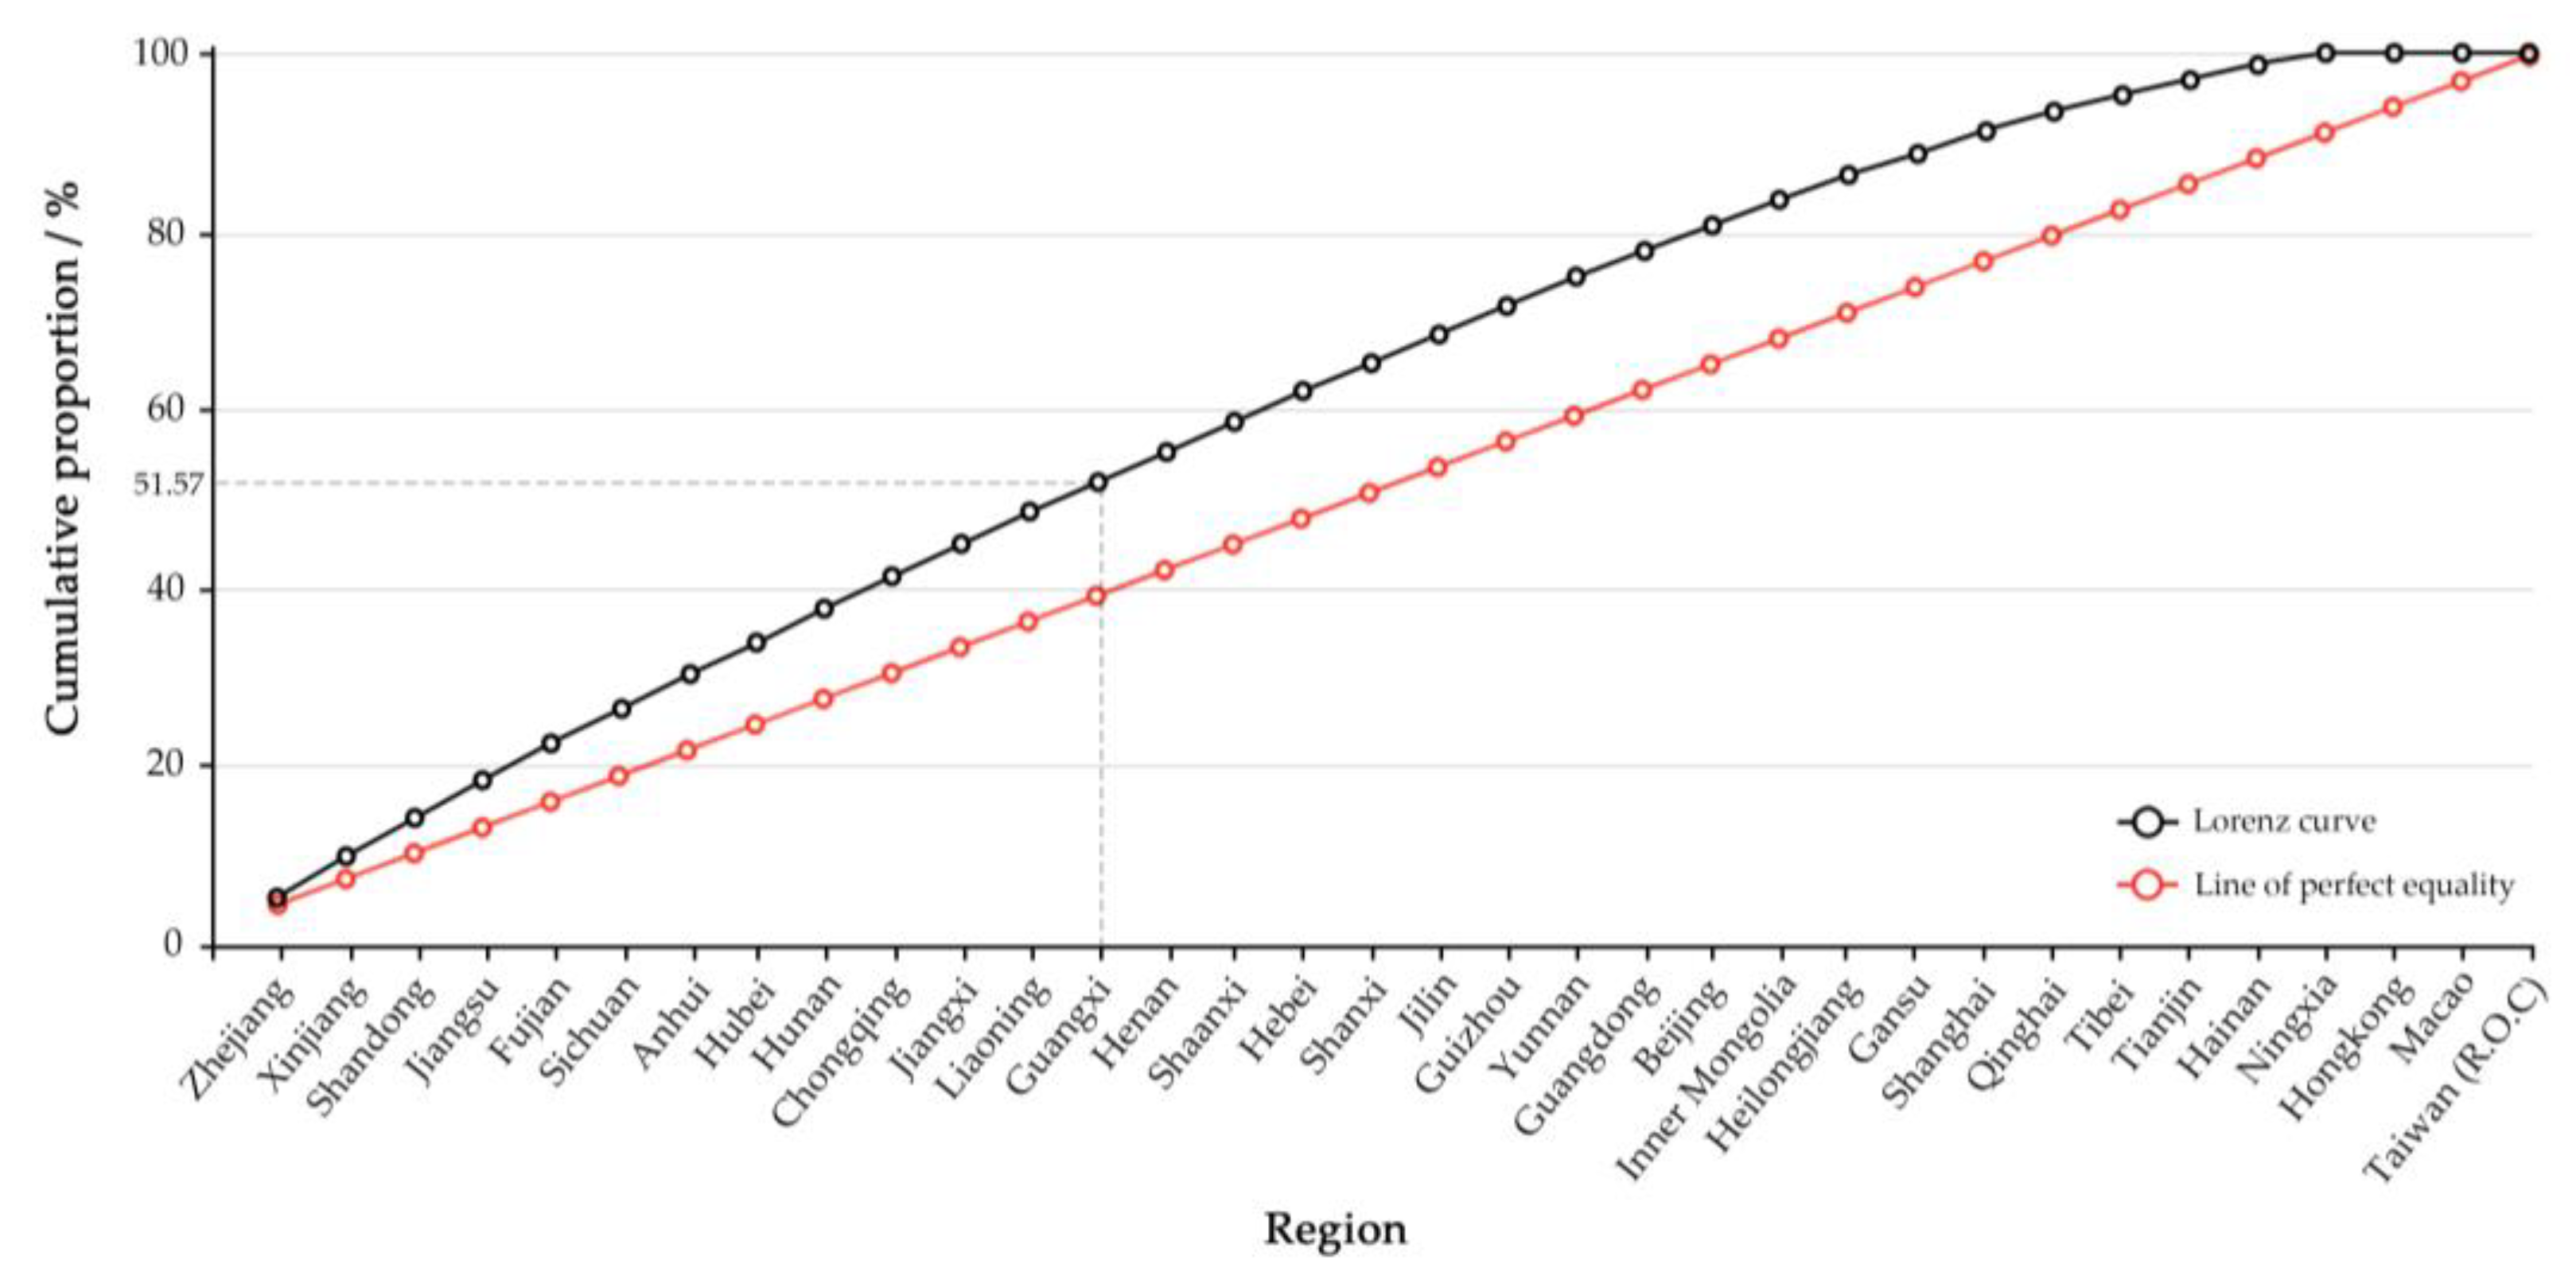
3.2.3. Spatial Distribution Discrepancies
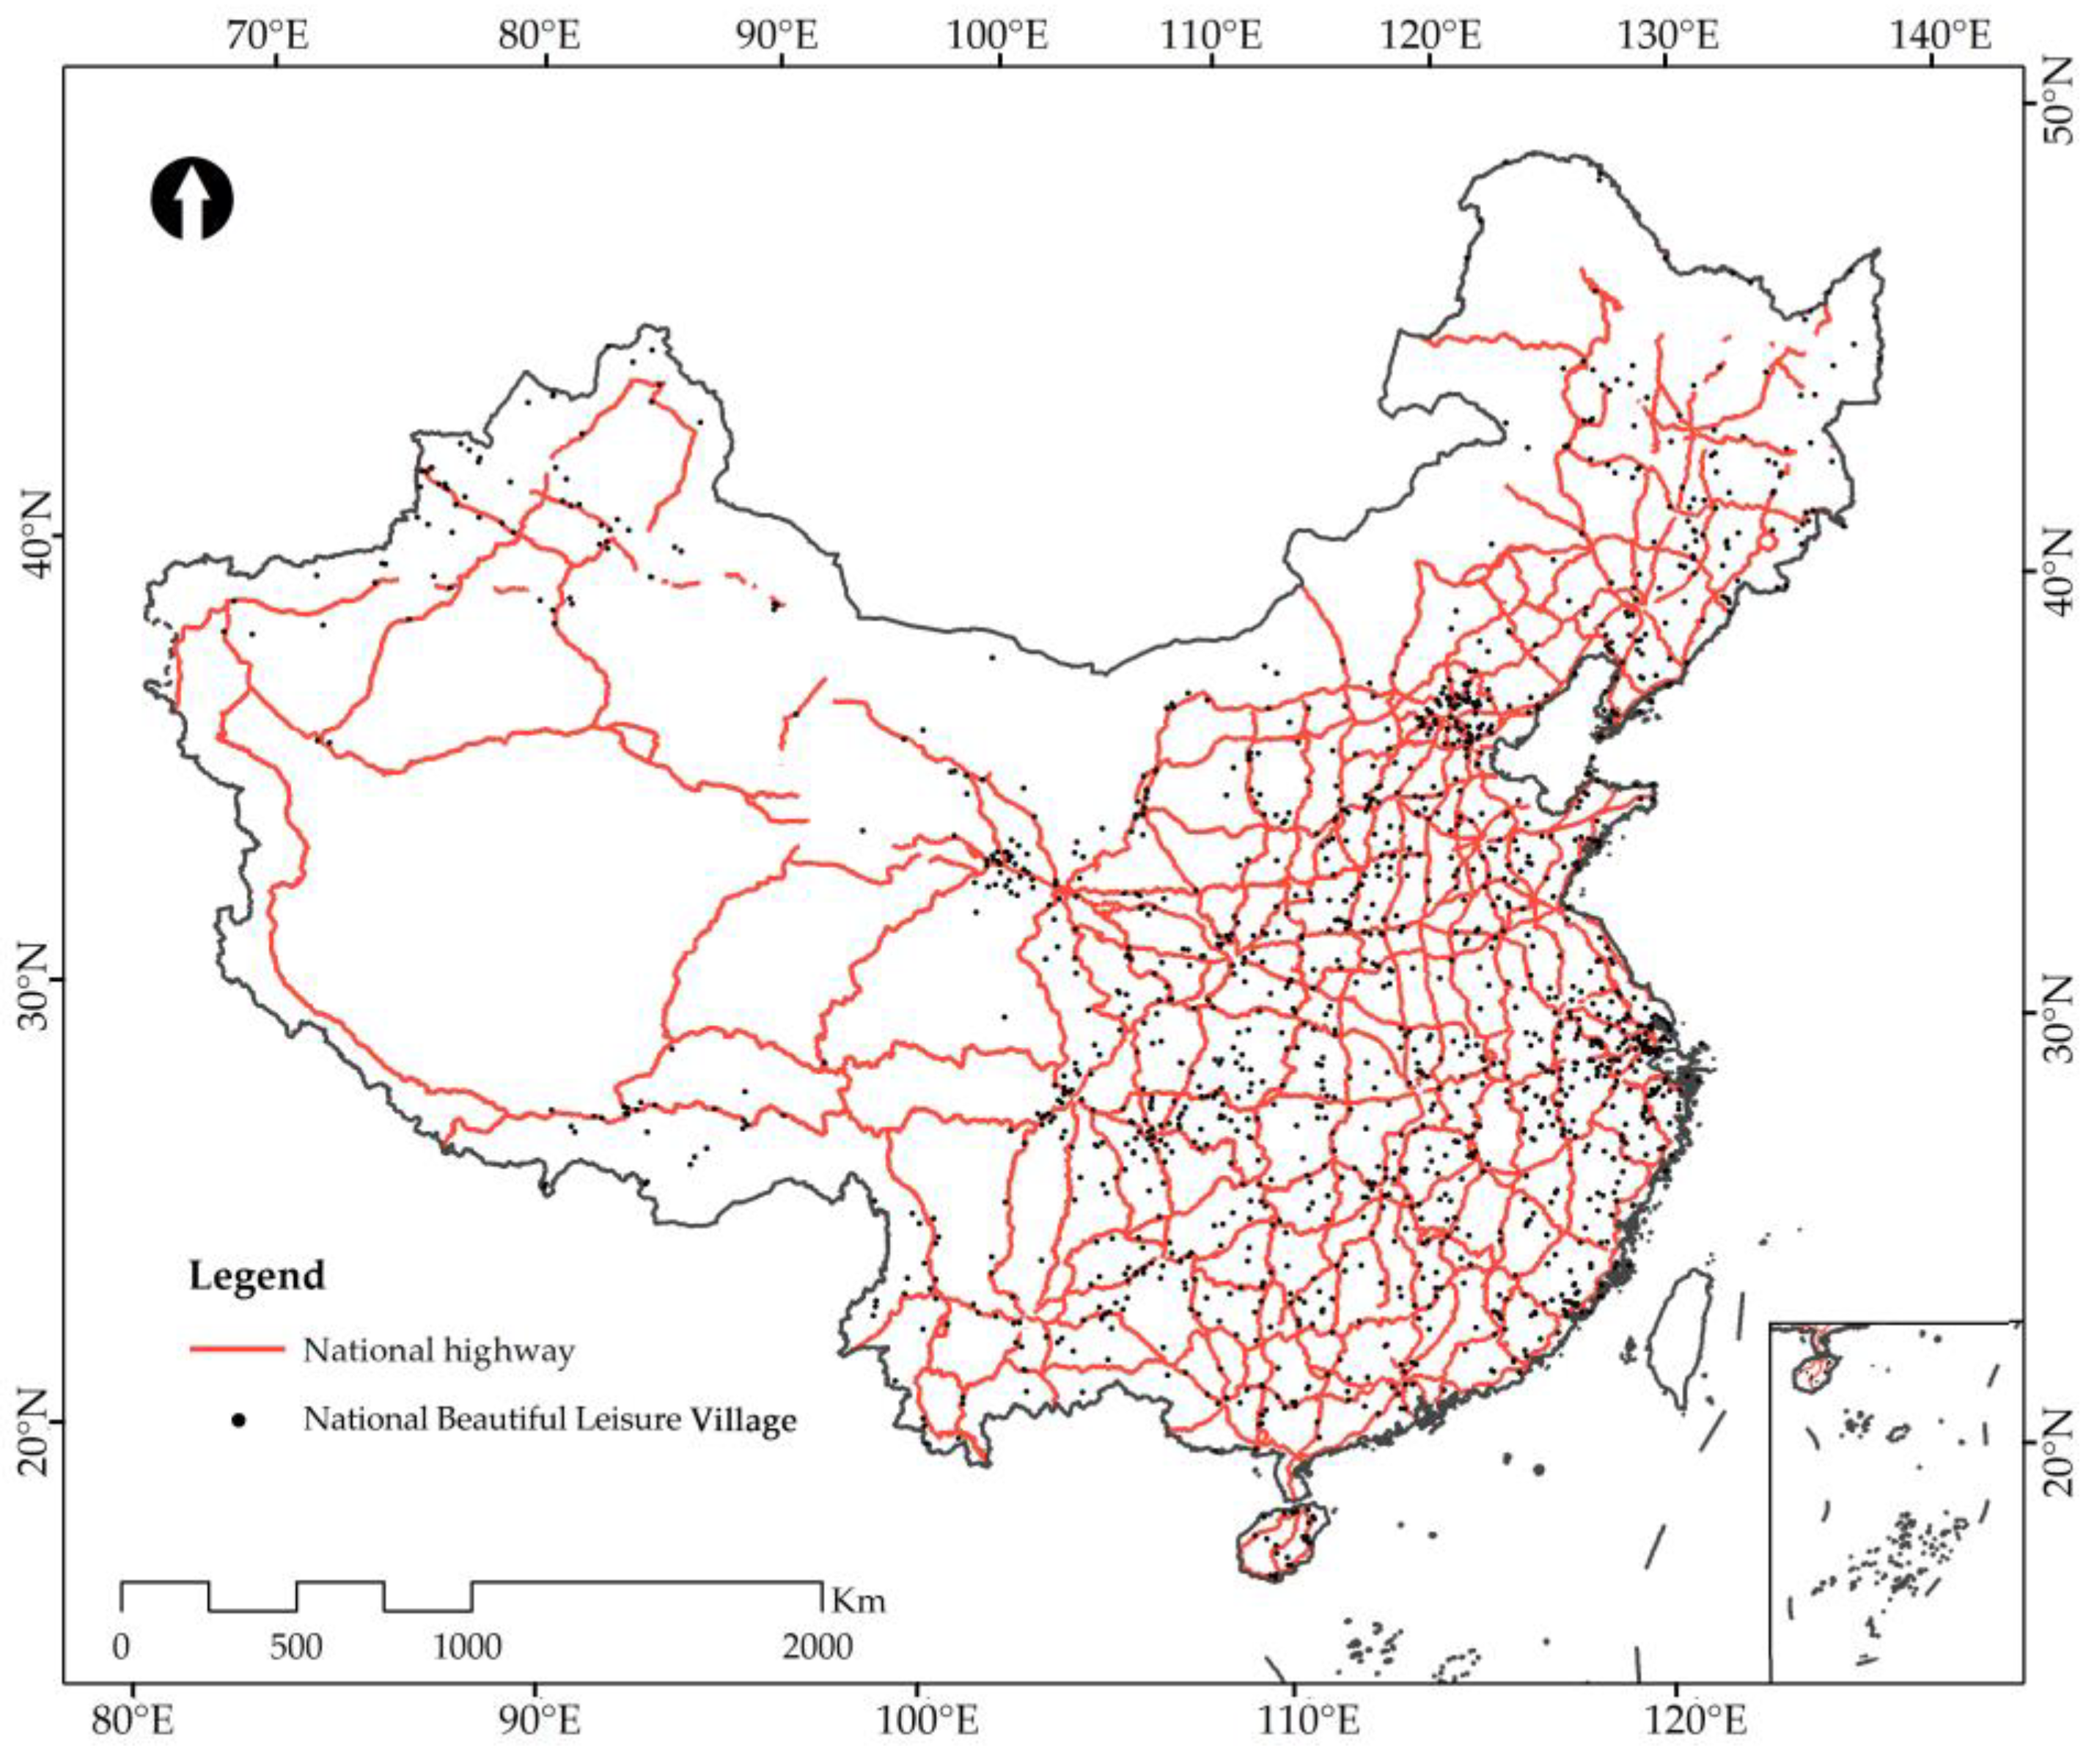
4.2. Transportation Factors
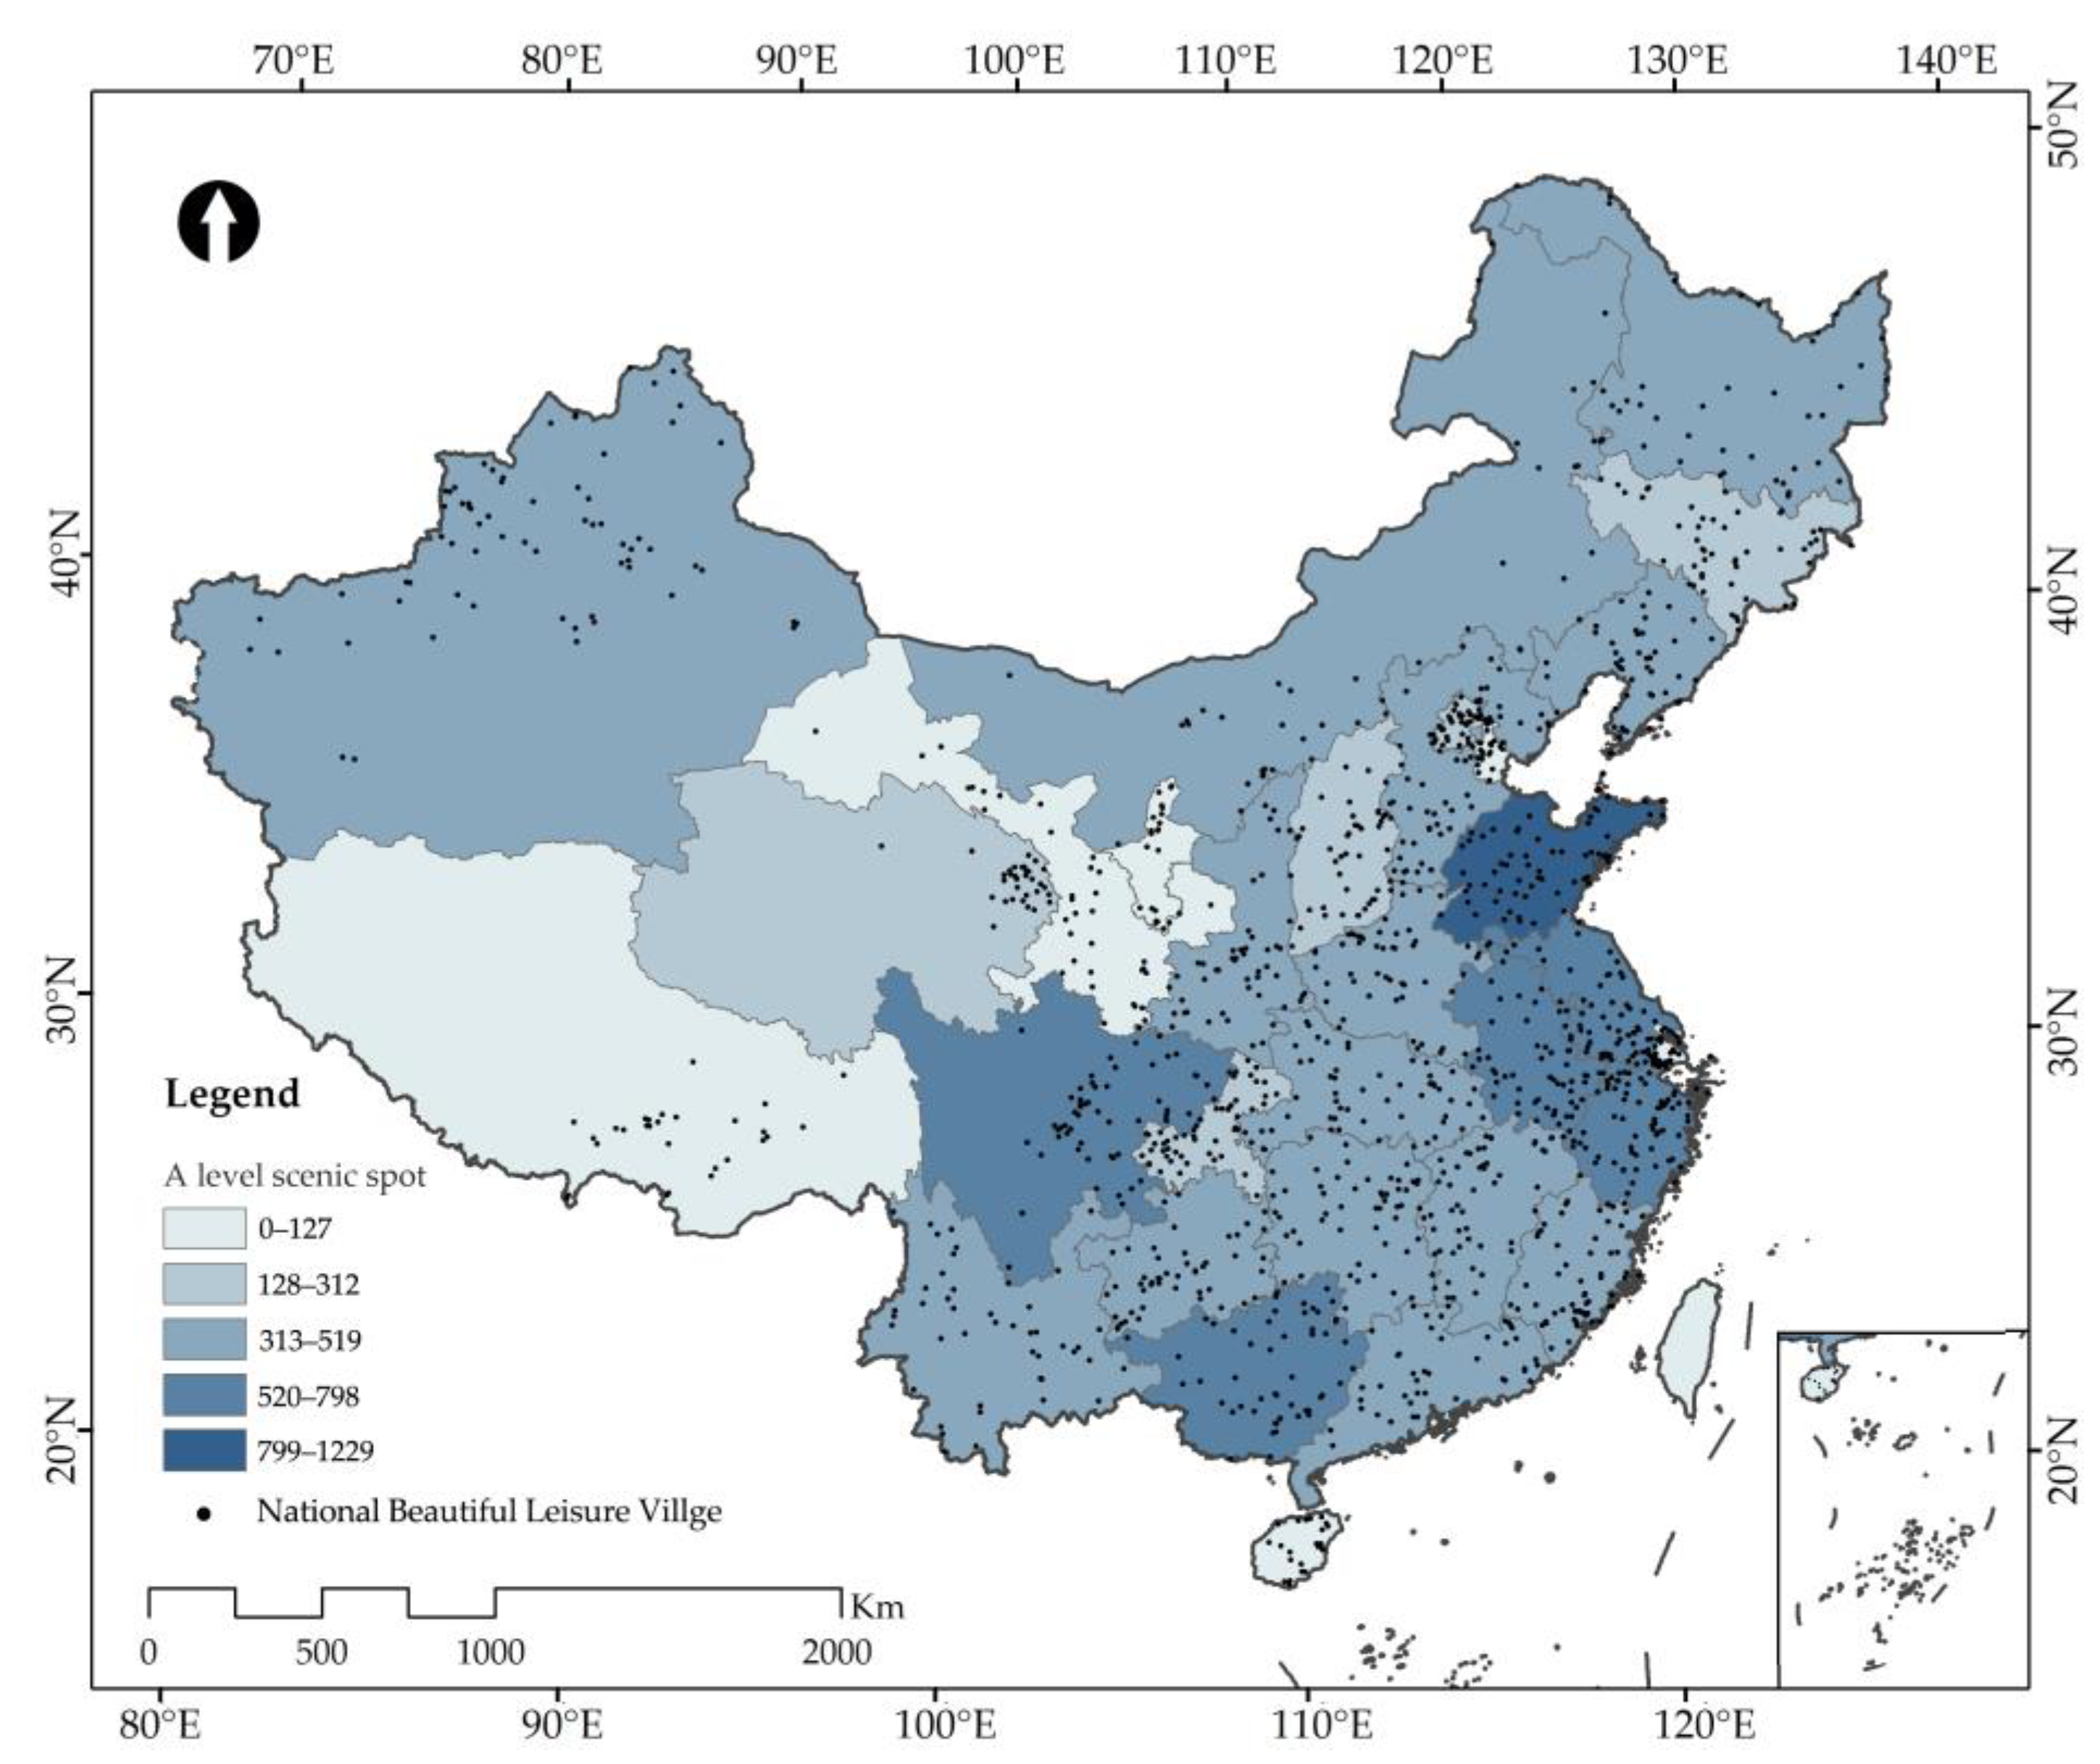
4.3. Tourism Development Factors
5. Discussion
- (1)
- This study microanalyzed the distribution characteristics of BLVCs at the national scale but lacked the relevant direct analysis at the provincial and regional scales.
- (2)
- This study mainly adopted the basic research methods of spatial analysis in the distribution characteristics, limiting the selection of relevant calculation formulas and methods. An in-depth mining of the data and a strengthening of the research methods are the suggested directions for future research.
- (3)
- The characteristics of the rural distribution factors are complex and diverse. Due to the availability of the data, this study only carried out correlation analysis on the social and cultural factors, and the factor selection was not comprehensive. The intersection of factors needs further improvement in later research.
6. Conclusions
- (1)
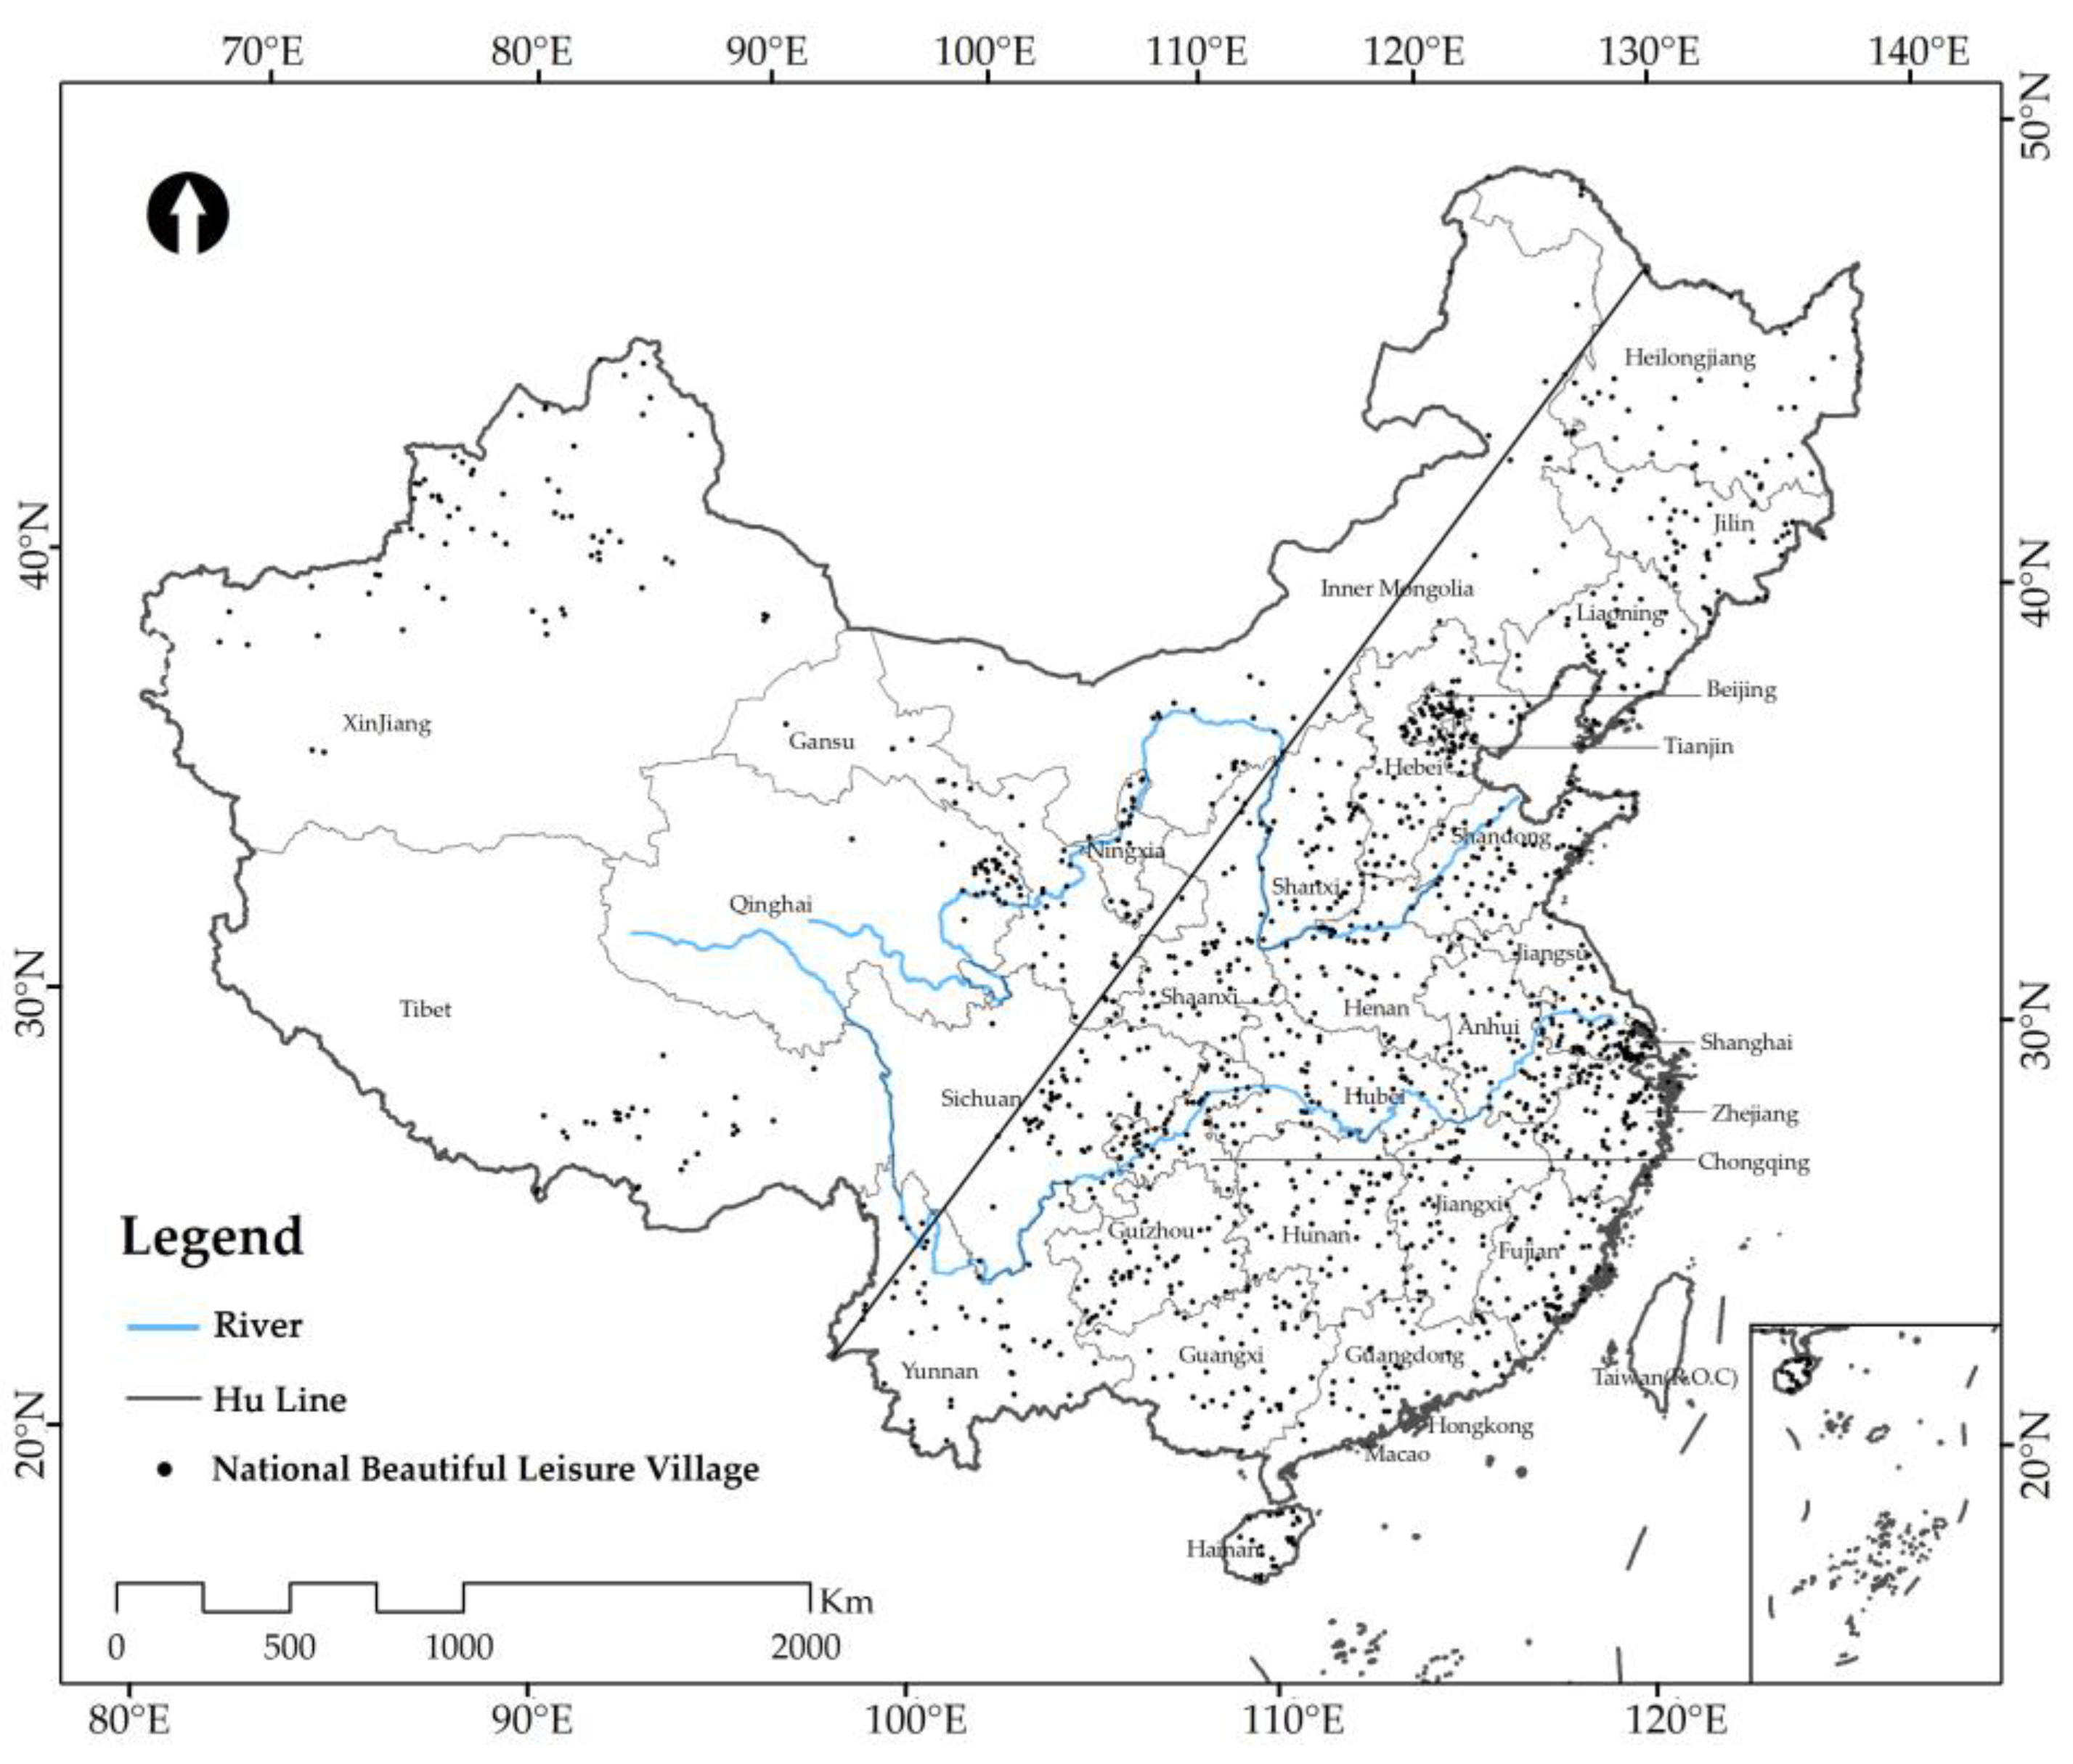
- By 2021, 1470 BLVCs had been selected in the 31 administrative regions of China. The distribution in each region is uneven, presenting a state of aggregation.
- (2)
- The distribution of BLVCs presents a double-core, seven-center, multiple scattered distribution pattern.
- (3)
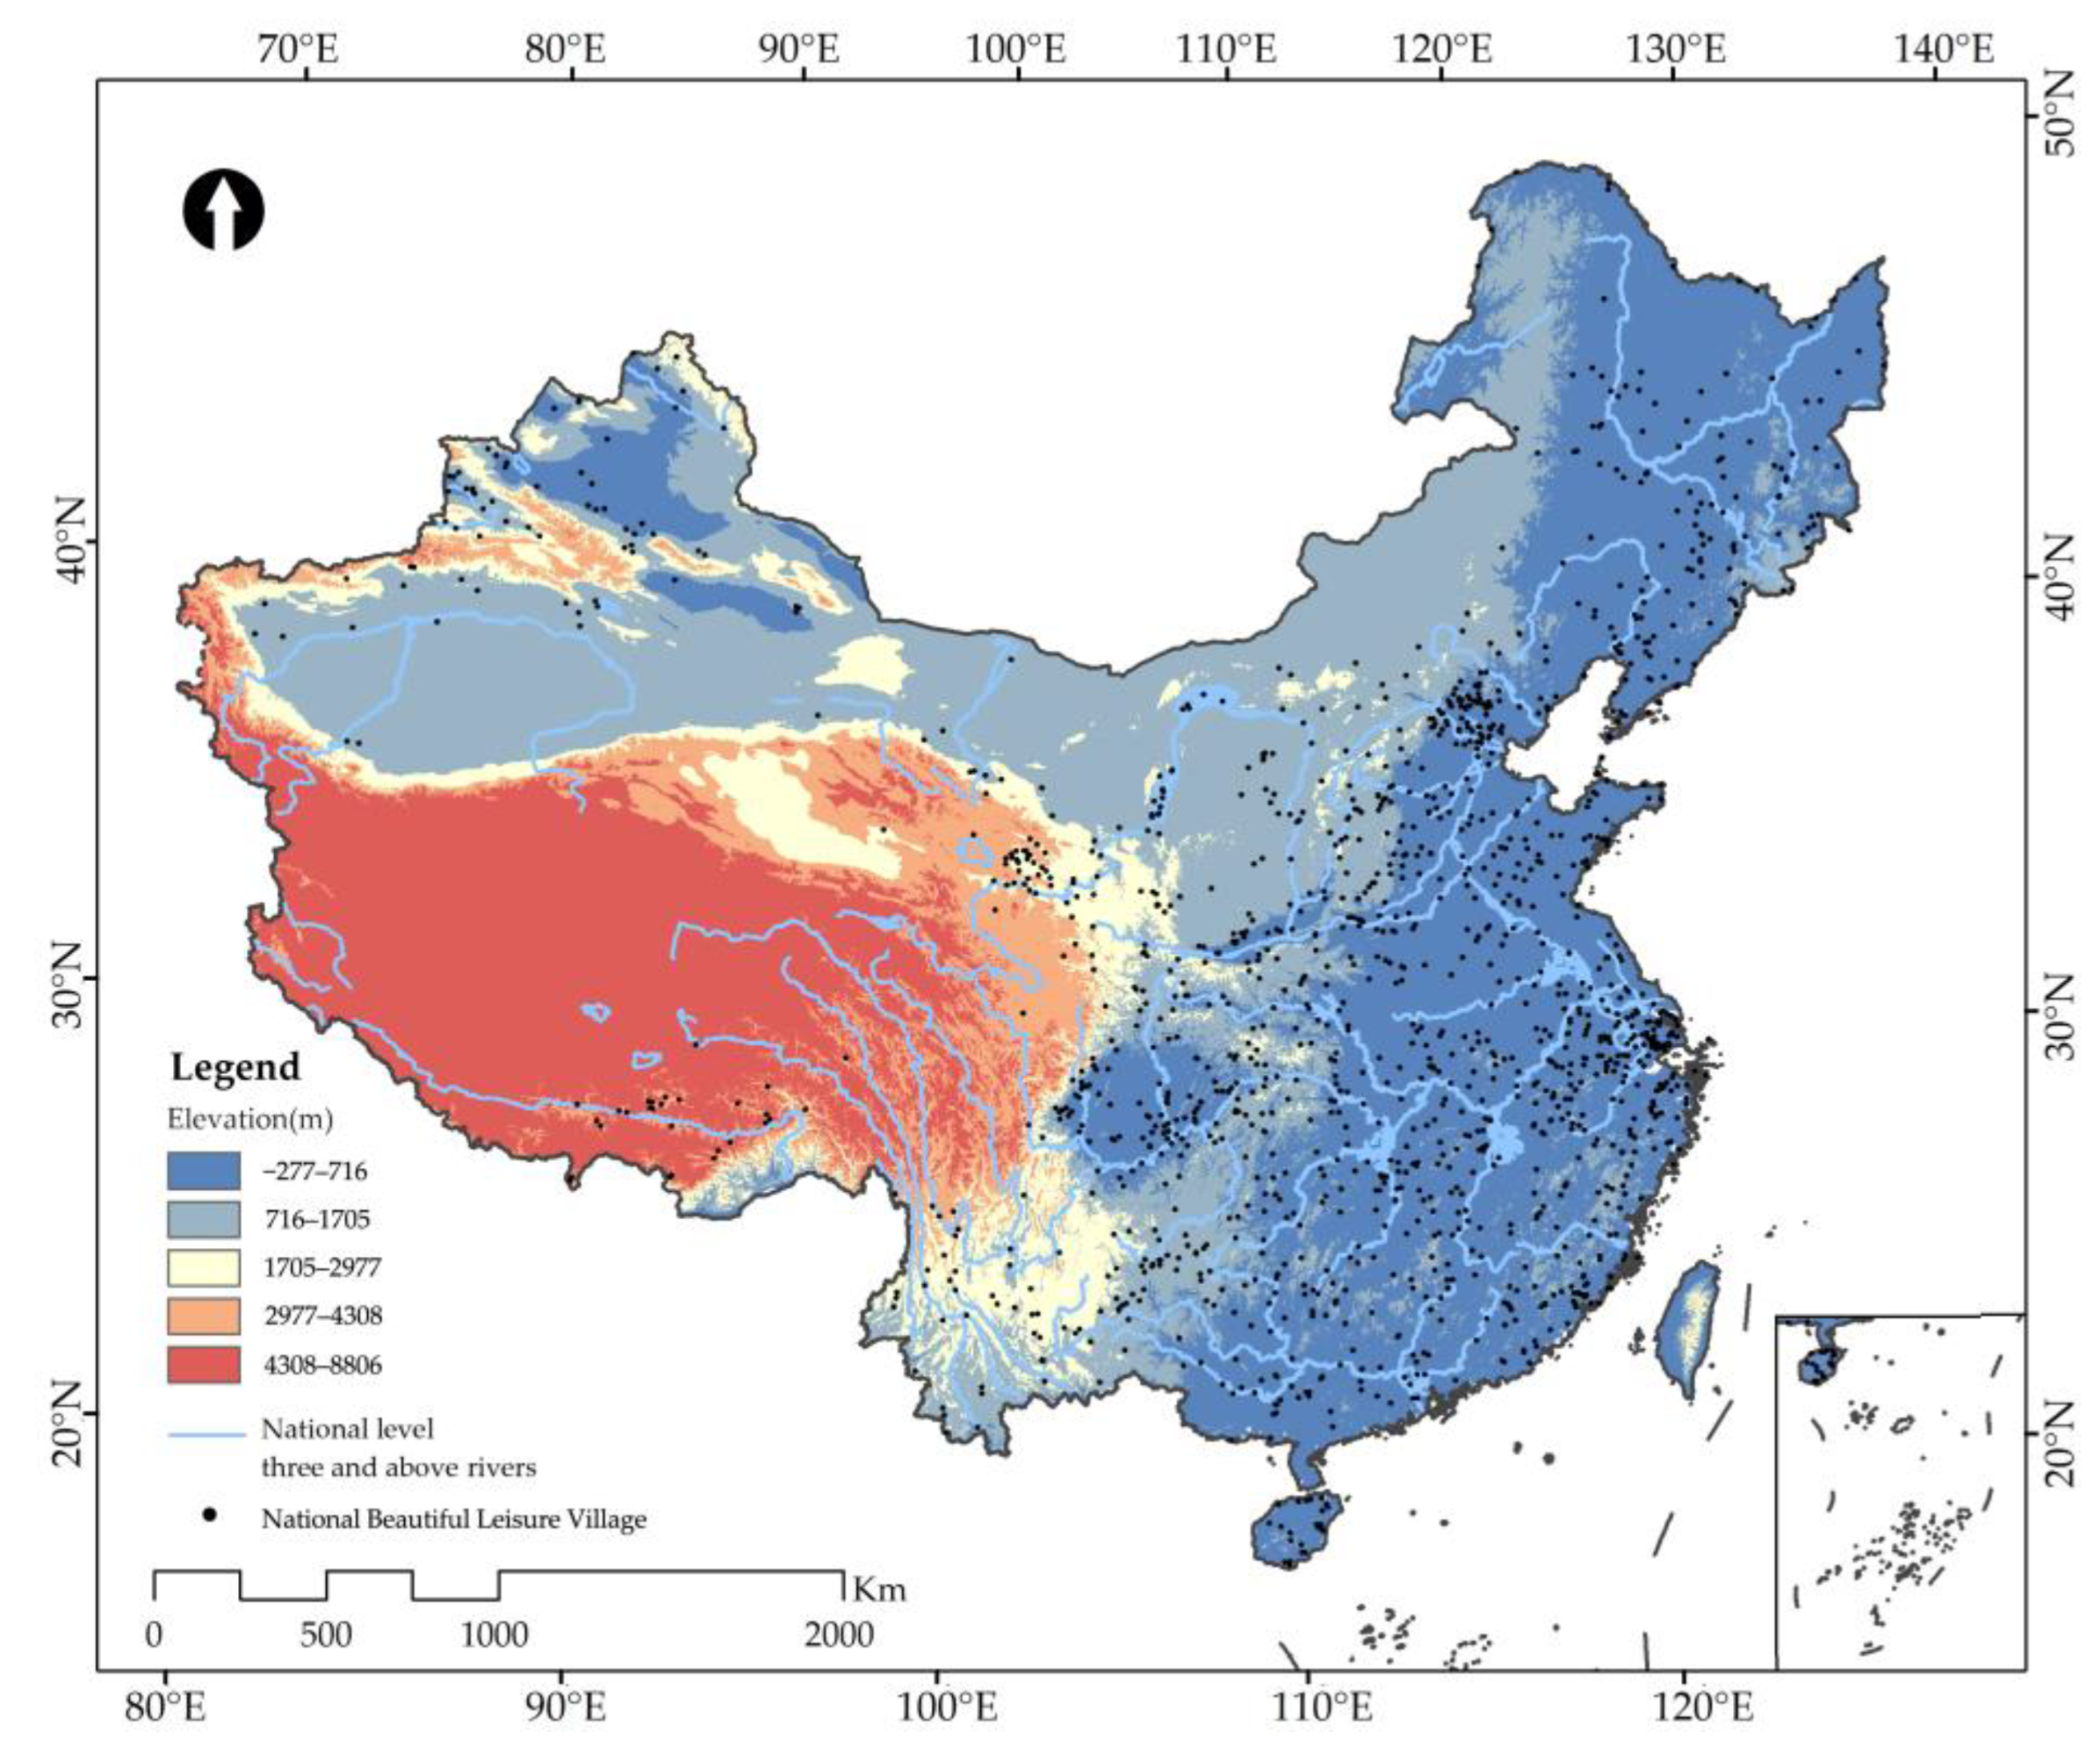
- Most BLVCs are located in the southeast, with a clear difference in distribution between the two sides of the Hu line.
- (4)
- From the perspective of the seven geographical divisions, the distribution of BLVCs is the highest in the east and the lowest in the south, with a difference of 19.25%.
- (1)
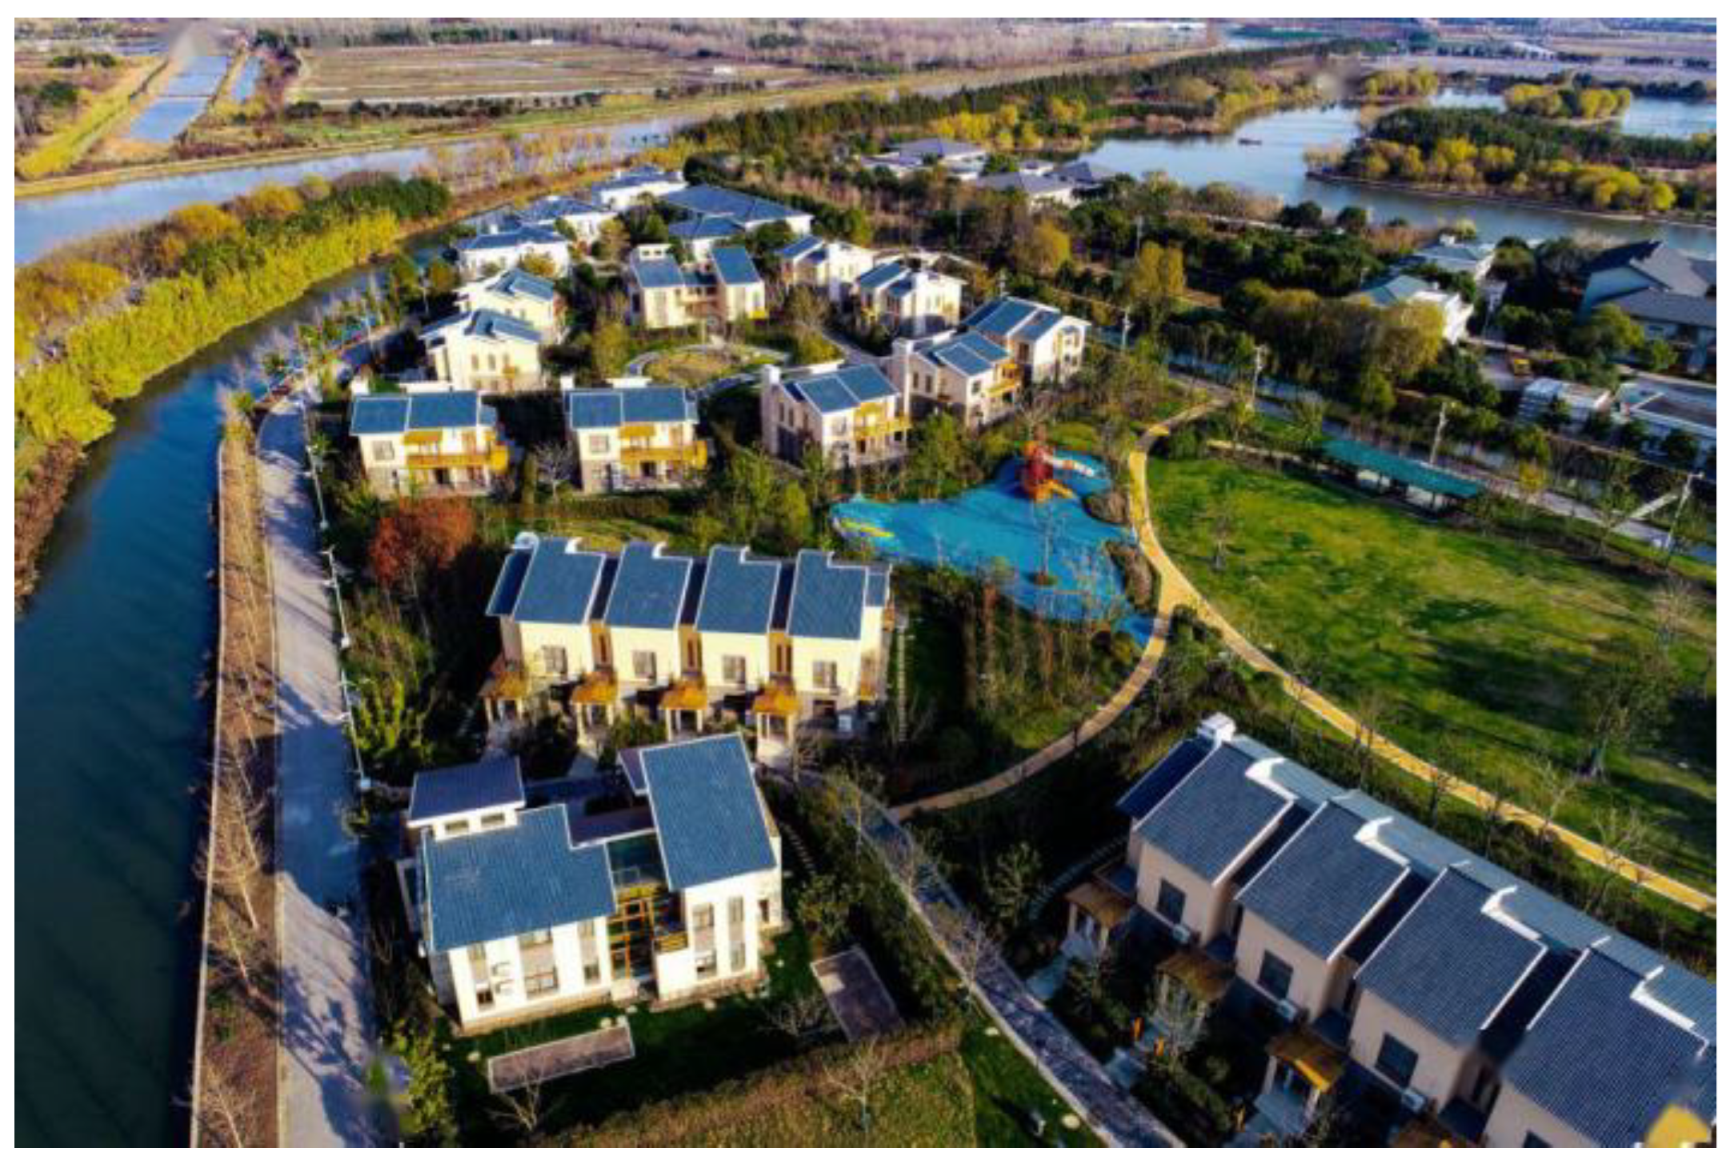
- From the perspective of the geographical environment, BLVCs are mainly concentrated in areas with flat terrain, a suitable climate and sufficient water resources, such as the eastern region.
- (2)
- From the perspective of road traffic, approximately half of the BLVCs are close to convenient road transportation. Accessibility affects the impact of rural development and the attraction of leisure tourism.
- (3)
- From the perspective of tourism development, the development of rich tourism resources and the construction of facilities and service systems have promoted the distribution and development of BLVCs.
- (4)
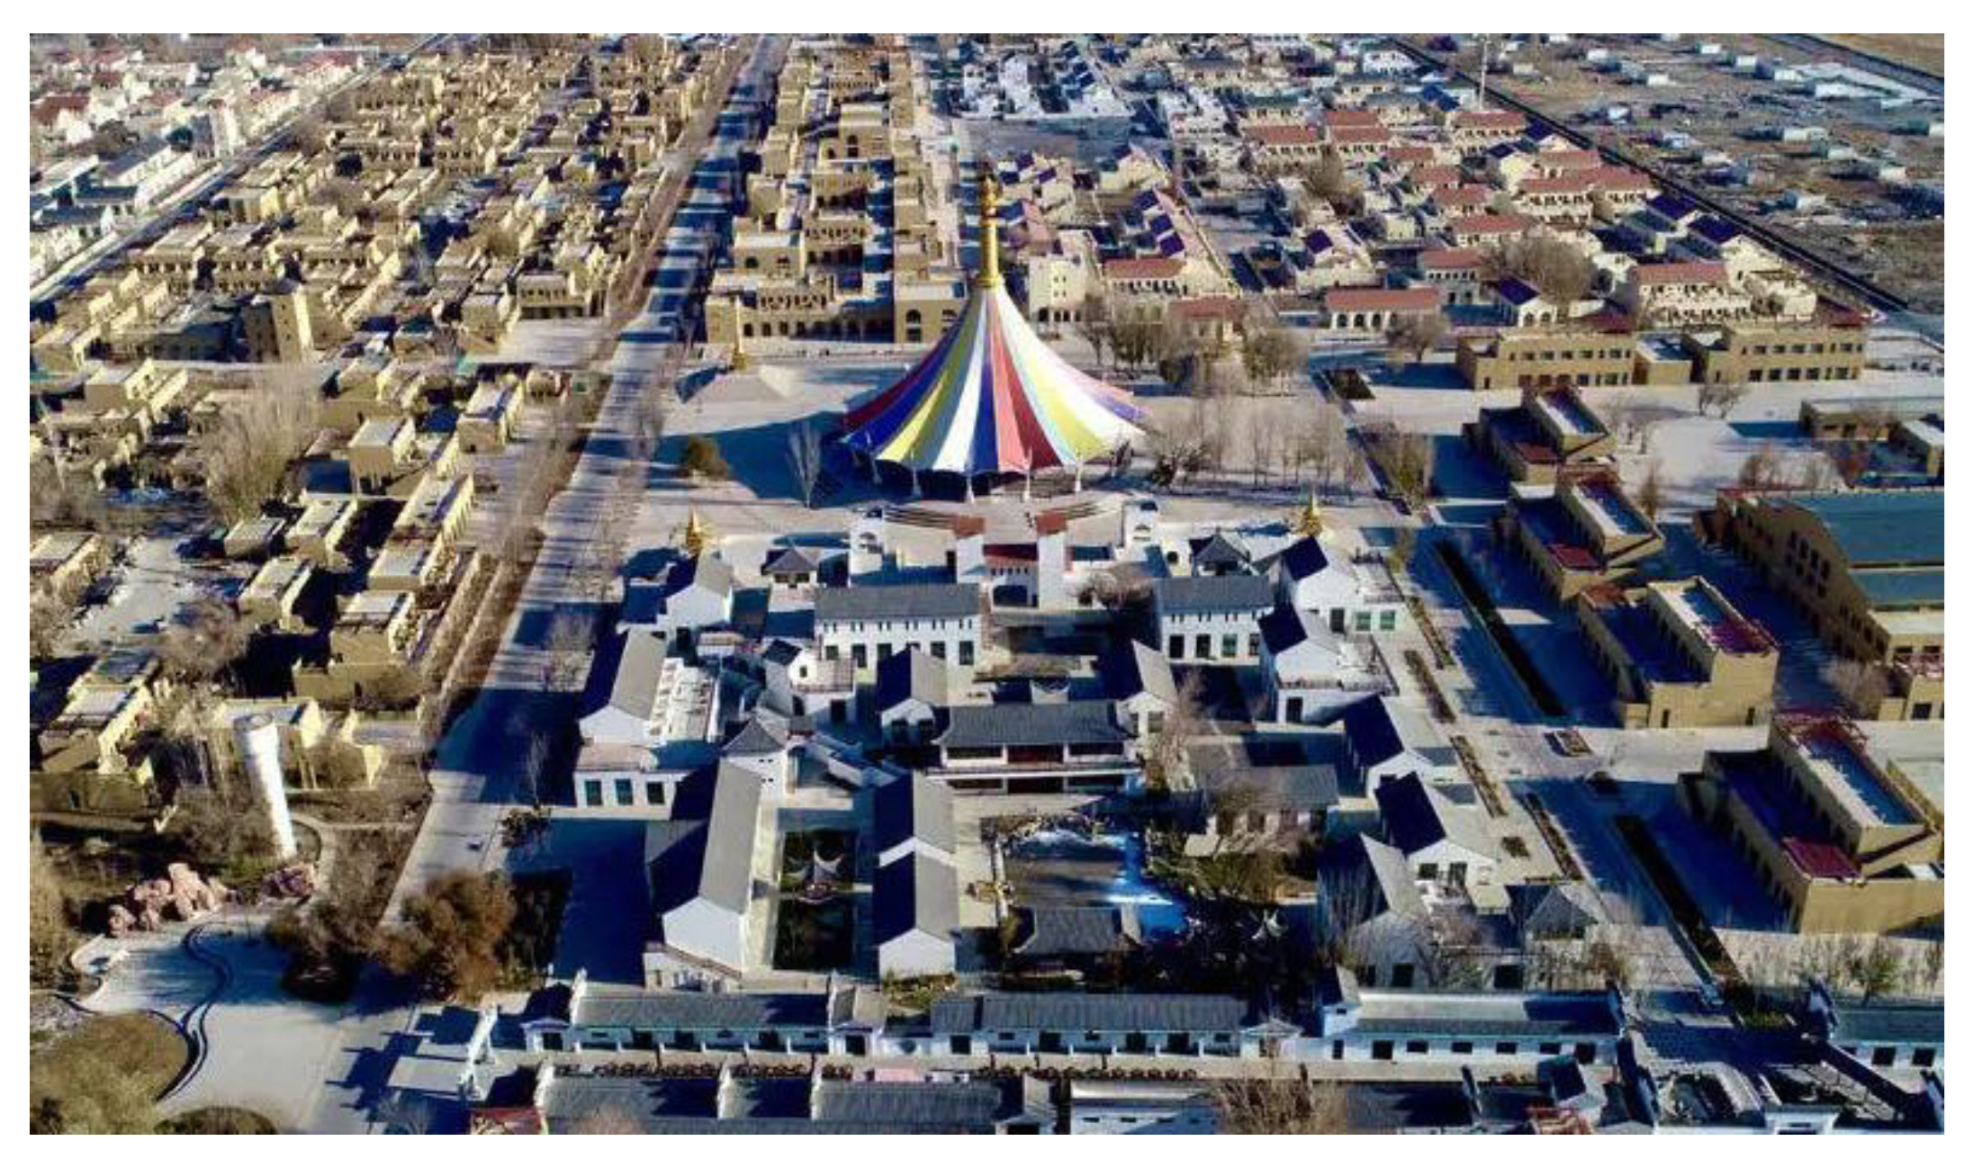
- From the perspective of policy, to achieve a balanced development of BLVCs in all regions, the national and local governments have strengthened policy guidance and financial support, especially in the northwest inland areas with slow development, such as ** an understanding of rural development from the macro law to specific implementation, which is conducive to the more reasonable use of the resources and regional advantages of rural areas, and the research results are universal. The specific study of characteristic rural tourism has created a new impetus for rural revitalization to further guide village leisure agriculture and the sustainable development of rural tourism and even to promote rural revitalization. This study proposes the following suggestions:
- (1)
- Make full use of local ecological characteristics and resource advantages, and adjust the measures to the local conditions. Pay attention to improving rural ecological quality, maintaining rural scenery and respecting the natural patterns.
- (2)
- Build a tourism transportation network, comprehensively improve the integrity and diversity of tourism transportation facilities, and further enhance the attraction of tourism destinations.
- (3)
- The various regions should improve the facilities supporting rural tourism and comprehensively improve the service capacity and level of rural tourism. Each region should rely on their own cultural and tourism resources to develop the tourism industry creatively, integrating advantageous regional resources and enhancing the effect of industrial agglomeration.
- (4)
- The government should further improve rural policies and increase financial support for rural tourism. Local governments should confront the differences and gaps in regional development, strengthen coordinated development with the surrounding areas and form a win-win strategy of regional linkage and cooperation to optimize the spatial layout.
Author Contributions


| No | Administrative Region | Amount | Proportion (%) | Cumulative Proportion (%) |
|---|---|---|---|---|
| 1 | Zhejiang | 72 | 4.90% | 4.90% |
| 2 | **njiang | 68 | 4.63% | 9.53% |
| 3 | Shandong | 64 | 4.35% | 13.88% |
| 4 | Jiangsu | 62 | 4.22% | 18.10% |
| 5 | Fujian | 62 | 4.22% | 22.31% |
| 6 | Sichuan | 57 | 3.88% | 26.19% |
| 7 | Anhui | 55 | 3.74% | 29.93% |
| 8 | Hubei | 54 | 3.67% | 33.61% |
| 9 | Hunan | 54 | 3.67% | 37.28% |
| 10 | Chongqing | 54 | 3.67% | 40.95% |
| 11 | Jiangxi | 53 | 3.61% | 44.56% |
| 12 | Liaoning | 52 | 3.54% | 48.10% |
| 13 | Guangxi | 51 | 3.47% | 51.57% |
| 14 | Henan | 50 | 3.40% | 54.97% |
| 15 | Shaanxi | 50 | 3.40% | 58.37% |
| 16 | Hebei | 48 | 3.27% | 61.63% |
| 17 | Shanxi | 48 | 3.27% | 64.90% |
| 18 | Jilin | 47 | 3.20% | 68.10% |
| 19 | Guizhou | 47 | 3.20% | 71.29% |
| 20 | Yunnan | 47 | 3.20% | 74.49% |
| 21 | Guangdong | 43 | 2.93% | 77.42% |
| 22 | Bei**g | 42 | 2.86% | 80.27% |
| 23 | Inner Mongolia | 42 | 2.86% | 83.13% |
| 24 | Heilongjiang | 41 | 2.79% | 85.92% |
| 25 | Gansu | 37 | 2.52% | 88.44% |
| 26 | Shanghai | 35 | 2.38% | 90.82% |
| 27 | Qinghai | 32 | 2.18% | 93.00% |
| 28 | Tibet | 28 | 1.90% | 94.90% |
| 29 | Tian** | 27 | 1.84% | 96.74% |
| 30 | Hainan | 26 | 1.77% | 98.51% |
| 31 | Ningxia | 22 | 1.50% | 100.00% |
| 32 | Hongkong | 0 | 0.00% | 100.00% |
| 33 | Macao | 0 | 0.00% | 100.00% |
| 34 | Taiwan (the Republic of China) | 0 | 0.00% | 100.00% |
| Total | 1470 | 100.00% | 100.00% |
| Density Classification | Administrative Region | Amount | Kernel Density Zone |
|---|---|---|---|
| Core density | * Bei**g | 42 | 10.09–17.98 |
| * Tian** | 27 | 10.09–17.98 | |
| Hebei | 48 | 5.36–10.09 | |
| * Shanghai | 35 | 10.09–17.98 | |
| * Zhejiang | 72 | 10.09–17.98 | |
| * Jiangsu | 62 | 10.09–17.98 | |
| Anhui | 55 | 5.36–10.09 | |
| High density | * Chongqing | 54 | 5.36–10.09 |
| Sichuan | 57 | 5.36–10.09 | |
| * Henan | 50 | 5.36–10.09 | |
| Shanxi | 48 | 5.36–10.09 | |
| * Hunan | 54 | 5.36–10.09 | |
| Jiangxi | 53 | 2.89–5.36 | |
| Hubei | 54 | 2.89–5.36 | |
| * Qinghai | 32 | 5.36–10.09 | |
| Gansu | 37 | 1.06–2.89 | |
| * Fujian | 62 | 5.36–10.09 | |
| Guangdong | 43 | 2.89–5.36 | |
| * Liaoning | 52 | 2.89–5.36 | |
| * Hainan | 26 | 5.36–10.09 | |
| Medium density | Shandong | 64 | 2.89–5.36 |
| Shaanxi | 50 | 2.89–5.36 | |
| Jilin | 47 | 2.89–5.36 | |
| Heilongjiang | 41 | 1.06–2.89 | |
| Guizhou | 47 | 2.89–5.36 | |
| Yunnan | 47 | 1.06–2.89 | |
| Guangxi | 51 | 2.89–5.36 | |
| Ningxia | 22 | 2.89–5.36 | |
| **njiang | 68 | 2.89–5.37 | |
| Low density | Inner Mongolia | 42 | 1.06–2.89 |
| Tibet | 28 | 1.06–2.89 |
| No | Administrative Division | Amount | Proportion (%) | Cumulative Proportion (%) |
|---|---|---|---|---|
| 1 | East (Shanghai, Jiangsu, Zhejiang, Anhui, Jiangxi, Shandong, Fujian, Taiwan (R.O.C.)) | 403 | 27.41% | 27.41% |
| 2 | Southwest (Chongqing, Sichuan, Guizhou, Yunnan, Tibet) | 233 | 15.85% | 43.27% |
| 3 | Northwest (Shaanxi, Gansu, Qinghai, Ningxia, **njiang) | 209 | 14.22% | 57.48% |
| 4 | North (Bei**g, Tian**, Shanxi, Hebei, Inner Mongolia) | 207 | 14.08% | 71.56% |
| 5 | Central (Henan, Hubei, Hunan) | 158 | 10.75% | 82.31% |
| 6 | Northeast (Heilongjiang, Jilin, Liaoning) | 140 | 9.52% | 91.84% |
| 7 | South (Guangdong, Guangxi, Hainan, Hong Kong, Macao) | 120 | 8.16% | 100.00% |
| Total | 1470 | 100.00% | 100.00% |
| Factor | Metric | Coefficient | The Number of Rural Villages | Characteristic Residential Village | Characteristic Folk Custom Village | Modern New Village | Historical Ancient Village |
|---|---|---|---|---|---|---|---|
| Community economy | Per capita disposable income of the residents | Pearson correlation | 0.03 | 0.132 | −0.045 | −0.147 | 0.18 |
| Sig. (2-tailed) | 0.871 | 0.477 | 0.812 | 0.43 | 0.332 | ||
| GDP per capita | Pearson correlation | 0.077 | 0.171 | −0.026 | −0.179 | 0.206 | |
| Sig. (2-tailed) | 0.681 | 0.357 | 0.891 | 0.337 | 0.267 | ||
| Third industry value | Pearson correlation | 0.461 ** | 0.388 * | −0.076 | 0.024 | 0.302 | |
| Sig. (2-tailed) | 0.009 | 0.031 | 0.684 | 0.898 | 0.098 | ||
| Agricultural level | Agricultural output value | Pearson correlation | 0.563 ** | 0.365 * | 0.05 | 0.439 * | 0.078 |
| Sig. (2-tailed) | 0.001 | 0.043 | 0.791 | 0.013 | 0.677 | ||
| Farmland area | Pearson correlation | 0.214 | 0.029 | 0.125 | 0.466 ** | −0.287 | |
| Sig. (2-tailed) | 0.248 | 0.876 | 0.502 | 0.008 | 0.117 | ||
| Transportation | Passenger volume | Pearson correlation | 0.541 ** | 0.27 | −0.146 | 0.164 | 0.322 |
| Sig. (2-tailed) | 0.002 | 0.143 | 0.433 | 0.378 | 0.077 | ||
| Highway mileage | Pearson correlation | 0.552 ** | 0.319 | 0.06 | 0.452* | −0.046 | |
| Sig. (2-tailed) | 0.001 | 0.08 | 0.748 | 0.011 | 0.807 | ||
| Cultural resources | Number of intangible cultural heritage resources | Pearson correlation | 0.664 ** | 0.607 ** | 0.14 | 0.04 | 0.472 ** |
| Sig. (2-tailed) | 0 | 0 | 0.452 | 0.829 | 0.007 | ||
| Ethnic minority population | Pearson correlation | 0.17 | 0.119 | 0.360 * | −0.121 | −0.024 | |
| Sig. (2-tailed) | 0.361 | 0.525 | 0.047 | 0.516 | 0.899 | ||
| Tourism development | Number of domestic tourists | Pearson correlation | 0.669 ** | 0.483 ** | −0.153 | 0.234 | 0.469 ** |
| Sig. (2-tailed) | 0 | 0.006 | 0.411 | 0.204 | 0.008 | ||
| Number of A-level scenic spots | Pearson correlation | 0.769 ** | 0.663 ** | 0.124 | 0.271 | 0.264 | |
| Sig. (2-tailed) | 0 | 0 | 0.506 | 0.141 | 0.151 | ||
| Customer source market | Urban population | Pearson correlation | 0.429 * | 0.293 | −0.101 | 0.163 | 0.214 |
| Sig. (2-tailed) | 0.016 | 0.109 | 0.59 | 0.381 | 0.247 | ||
| Proportion of urban population at the end of the year | Pearson correlation | −0.016 | −0.01 | −0.079 | 0.103 | 0.046 | |
| Sig. (2-tailed) | 0.931 | 0.956 | 0.672 | 0.583 | 0.805 |
| River Level | Buffer (km) | Amount | Proportion (%) |
|---|---|---|---|
| Level 3 and above | 20 km | 444 | 30.20% |
| Level 4 | 10 km | 237 | 16.12% |
| Level 5 | 10 km | 429 | 29.18% |
| Total | 1110 | 75.50% |
| The Nearest Road Distance (m) | Amount | Proportion (%) |
|---|---|---|
| 1000 | 674 | 45.85% |
| 1000–2000 | 245 | 16.67% |
| 2000–3000 | 152 | 10.34% |
| 3000 | 399 | 27.14% |
| No | Function | Index |
|---|---|---|
| 1 | The nearest neighbor index | = 0.707211 |
| 2 | Kernel density estimation | 1.06–17.98 |
| 3 | Imbalance | = 0.226552 |
| 4 | Gini coefficient | G = 0.960127, C = 0.039873 |
Publisher’s Note: MDPI stays neutral with regard to jurisdictional claims in published maps and institutional affiliations. |
© 2022 by the authors. Licensee MDPI, Basel, Switzerland. This article is an open access article distributed under the terms and conditions of the Creative Commons Attribution (CC BY) license (https://creativecommons.org/licenses/by/4.0/).
Share and Cite
**e, Y.; Meng, X.; Cenci, J.; Zhang, J. Spatial Pattern and Formation Mechanism of Rural Tourism Resources in China: Evidence from 1470 National Leisure Villages. ISPRS Int. J. Geo-Inf. 2022, 11, 455. https://doi.org/10.3390/ijgi11080455
**e Y, Meng X, Cenci J, Zhang J. Spatial Pattern and Formation Mechanism of Rural Tourism Resources in China: Evidence from 1470 National Leisure Villages. ISPRS International Journal of Geo-Information. 2022; 11(8):455. https://doi.org/10.3390/ijgi11080455
Chicago/Turabian Style**e, Yuchen, **angzhuang Meng, Jeremy Cenci, and Jiazhen Zhang. 2022. "Spatial Pattern and Formation Mechanism of Rural Tourism Resources in China: Evidence from 1470 National Leisure Villages" ISPRS International Journal of Geo-Information 11, no. 8: 455. https://doi.org/10.3390/ijgi11080455