


Application of AHP-ICM and AHP-EWM in Collapse Disaster Risk Map** in Huinan County
Abstract
:1. Introduction
2. Data and Methodology
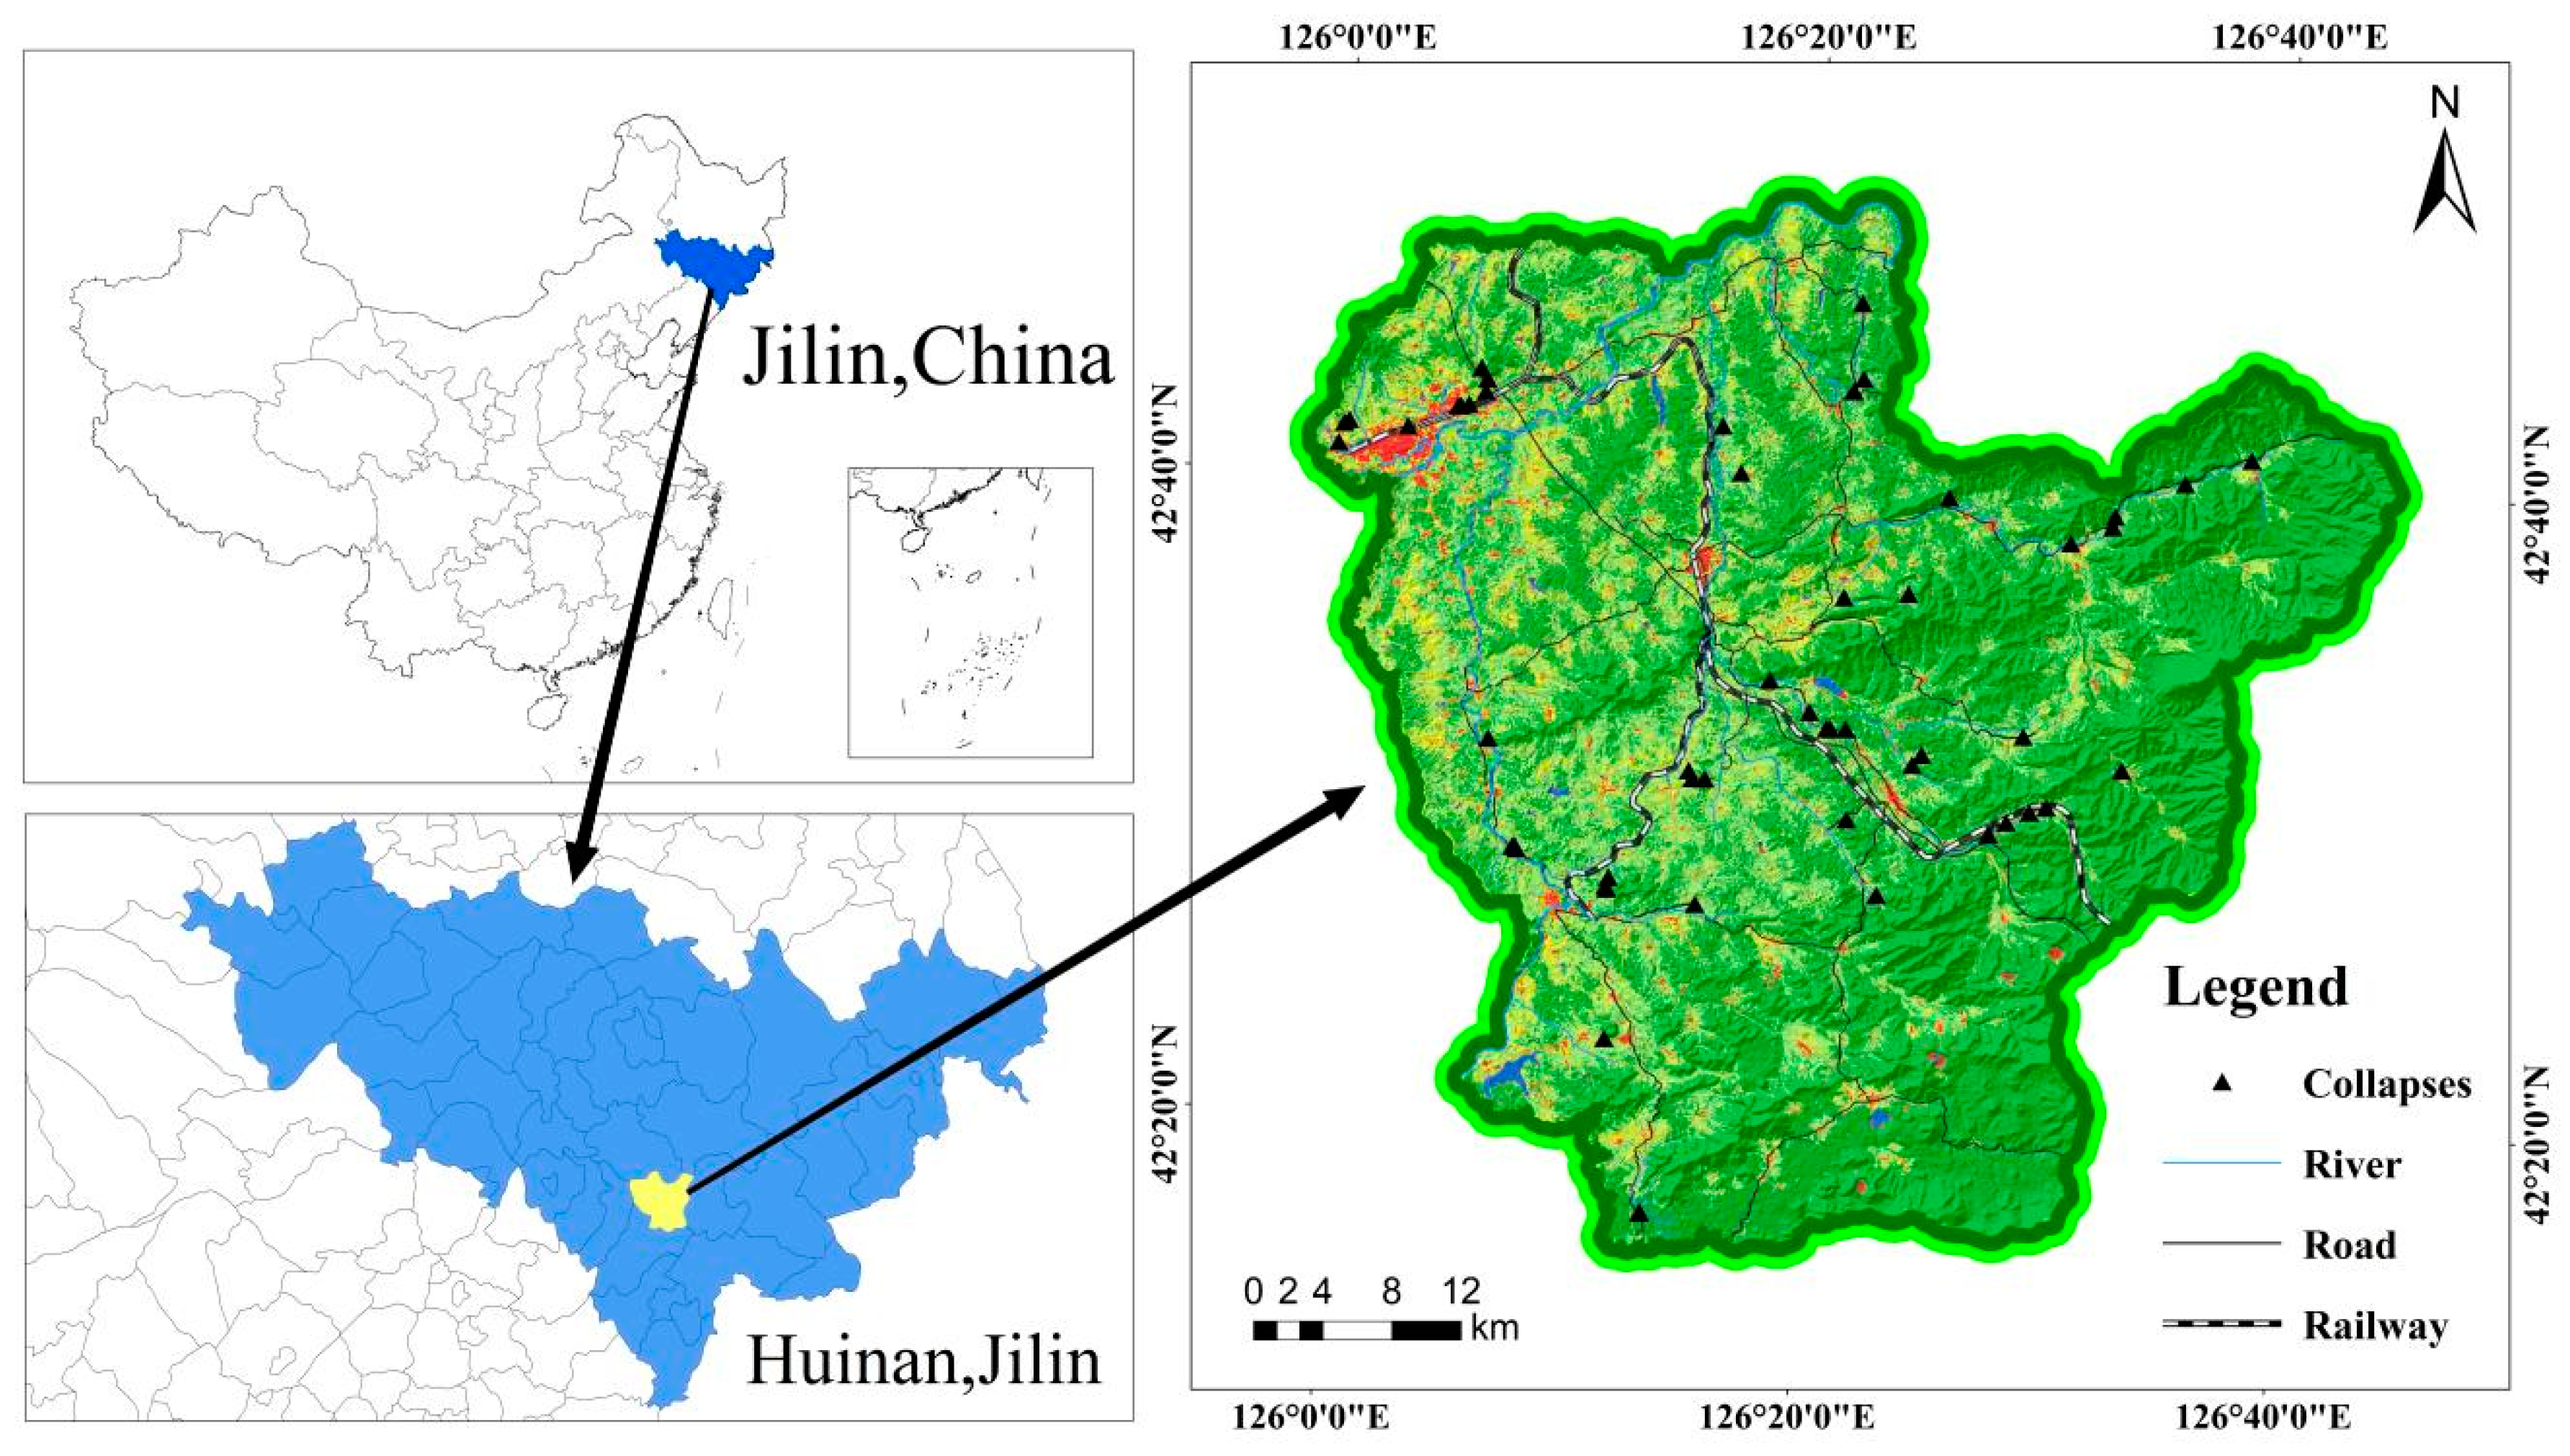
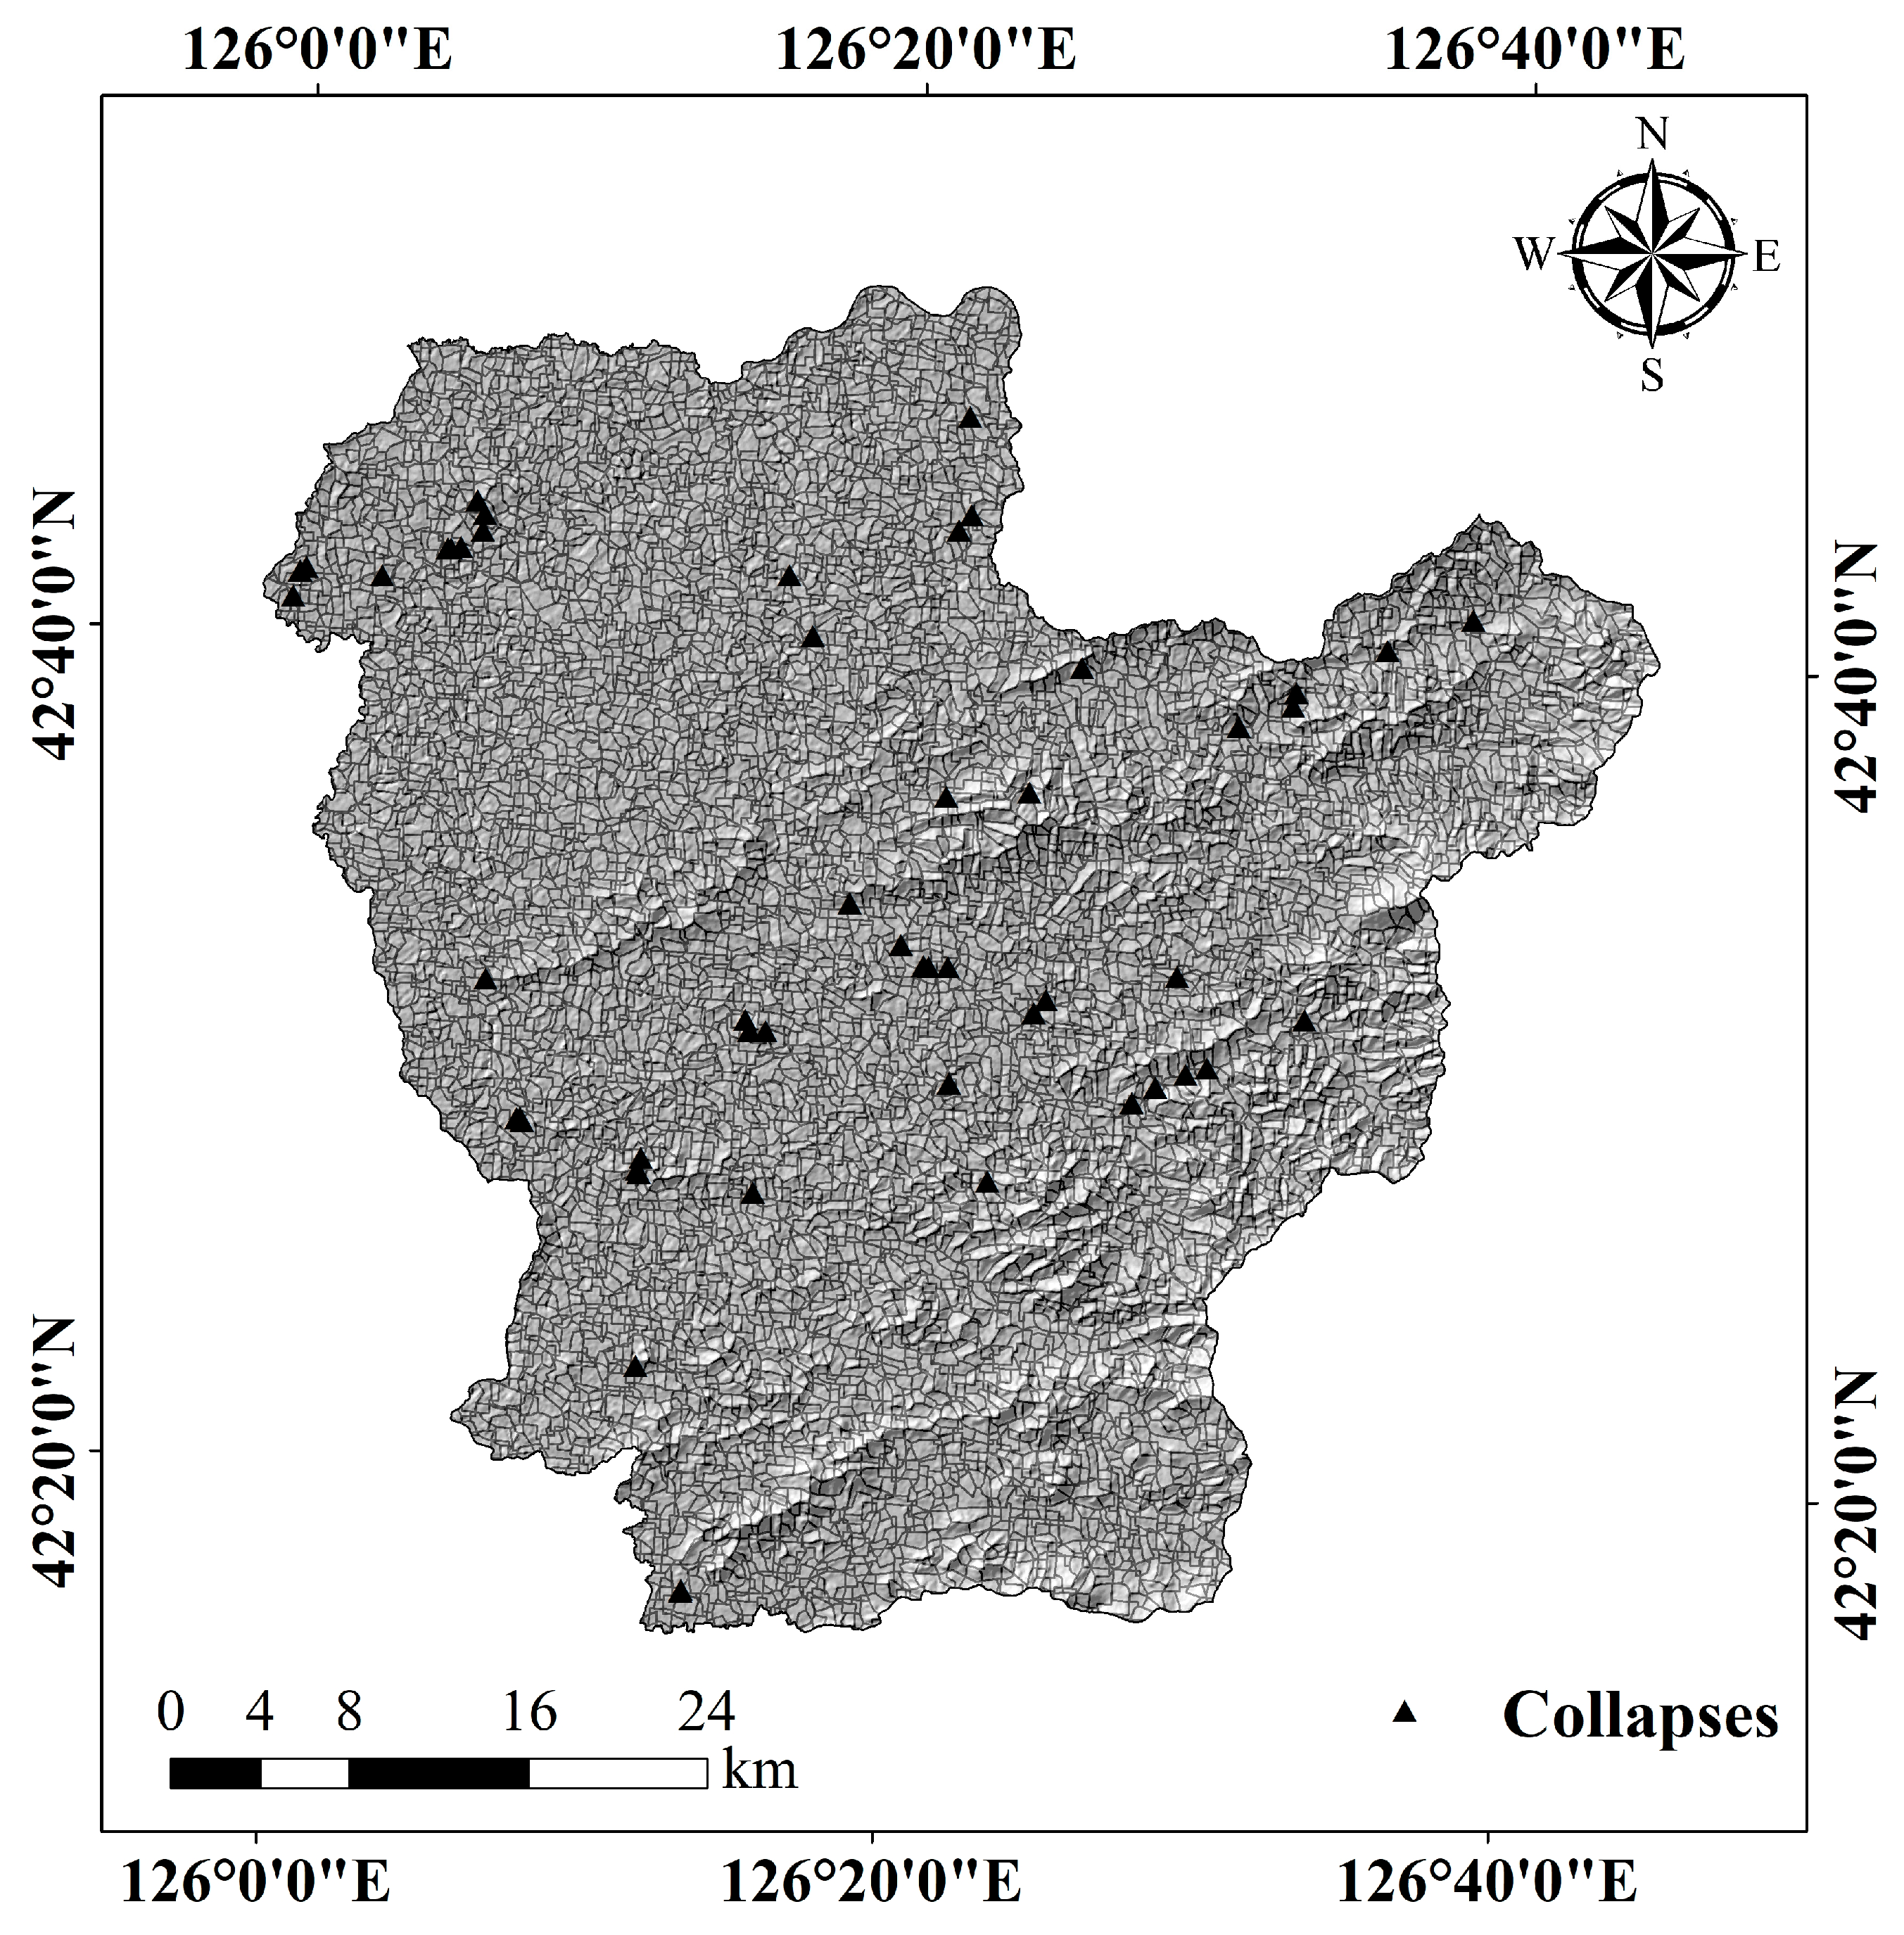
2.1. Overview of the Study Area
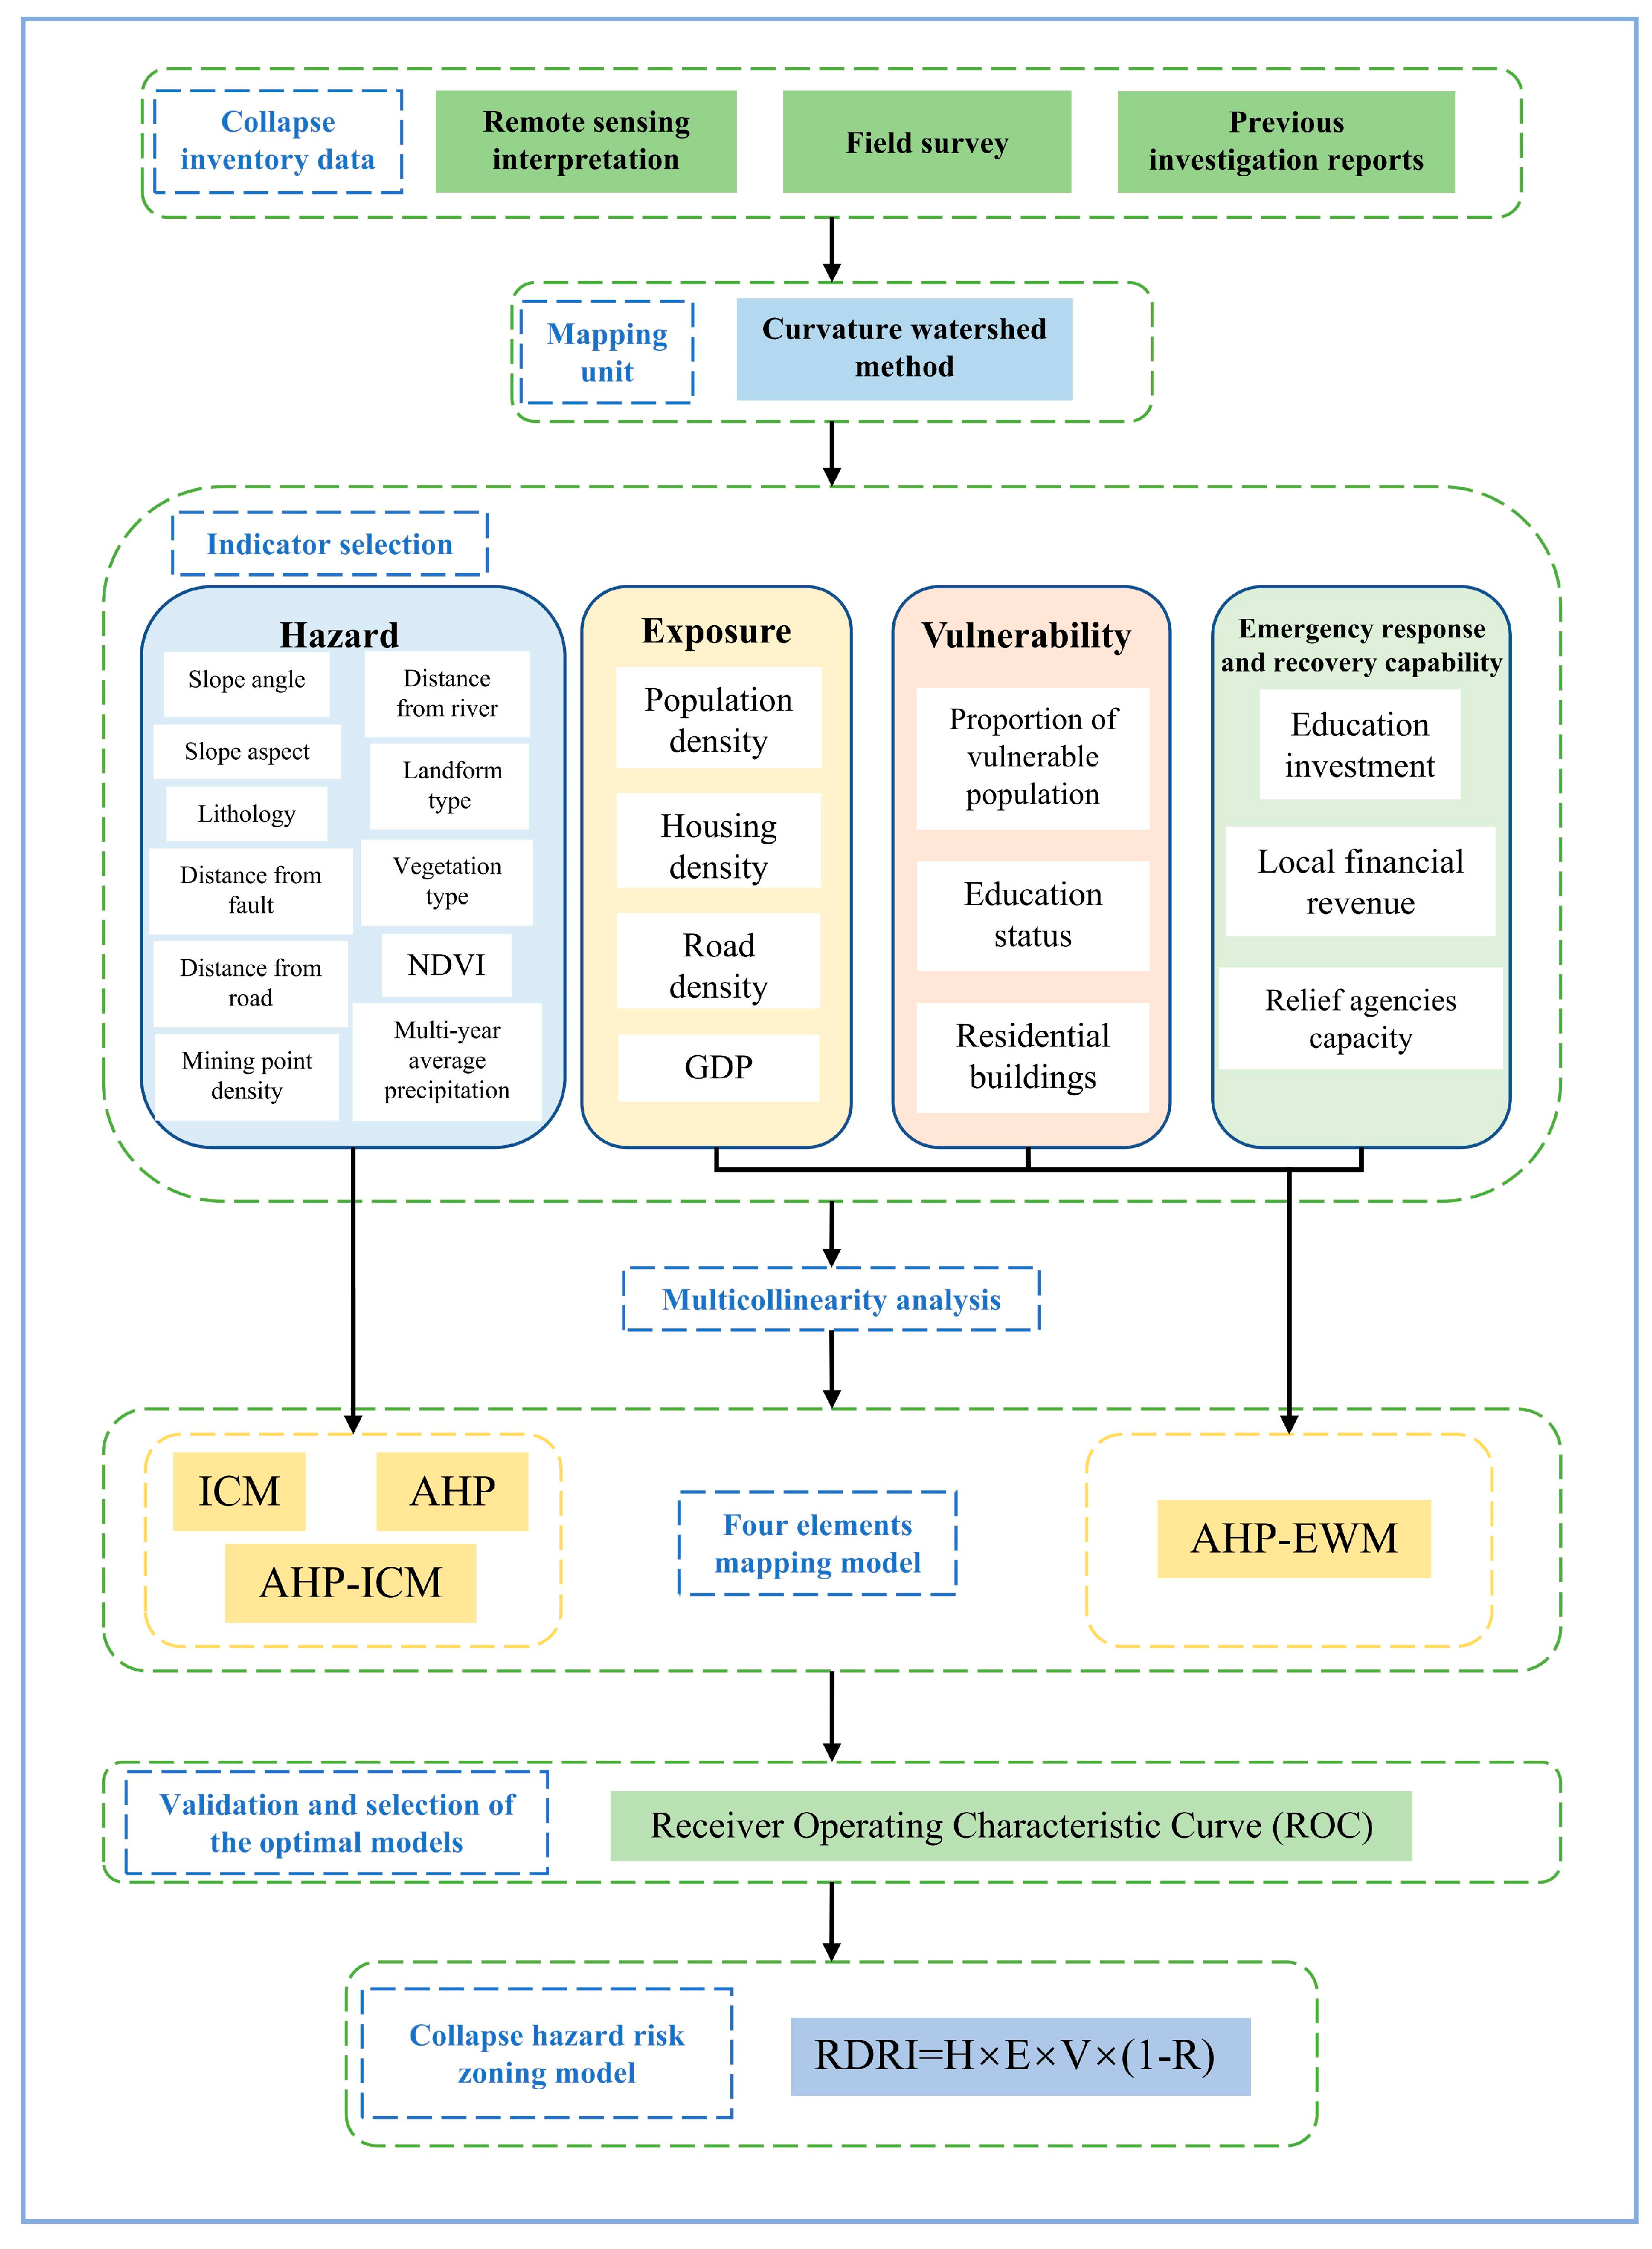
2.2. Collapse Evaluation Indicators
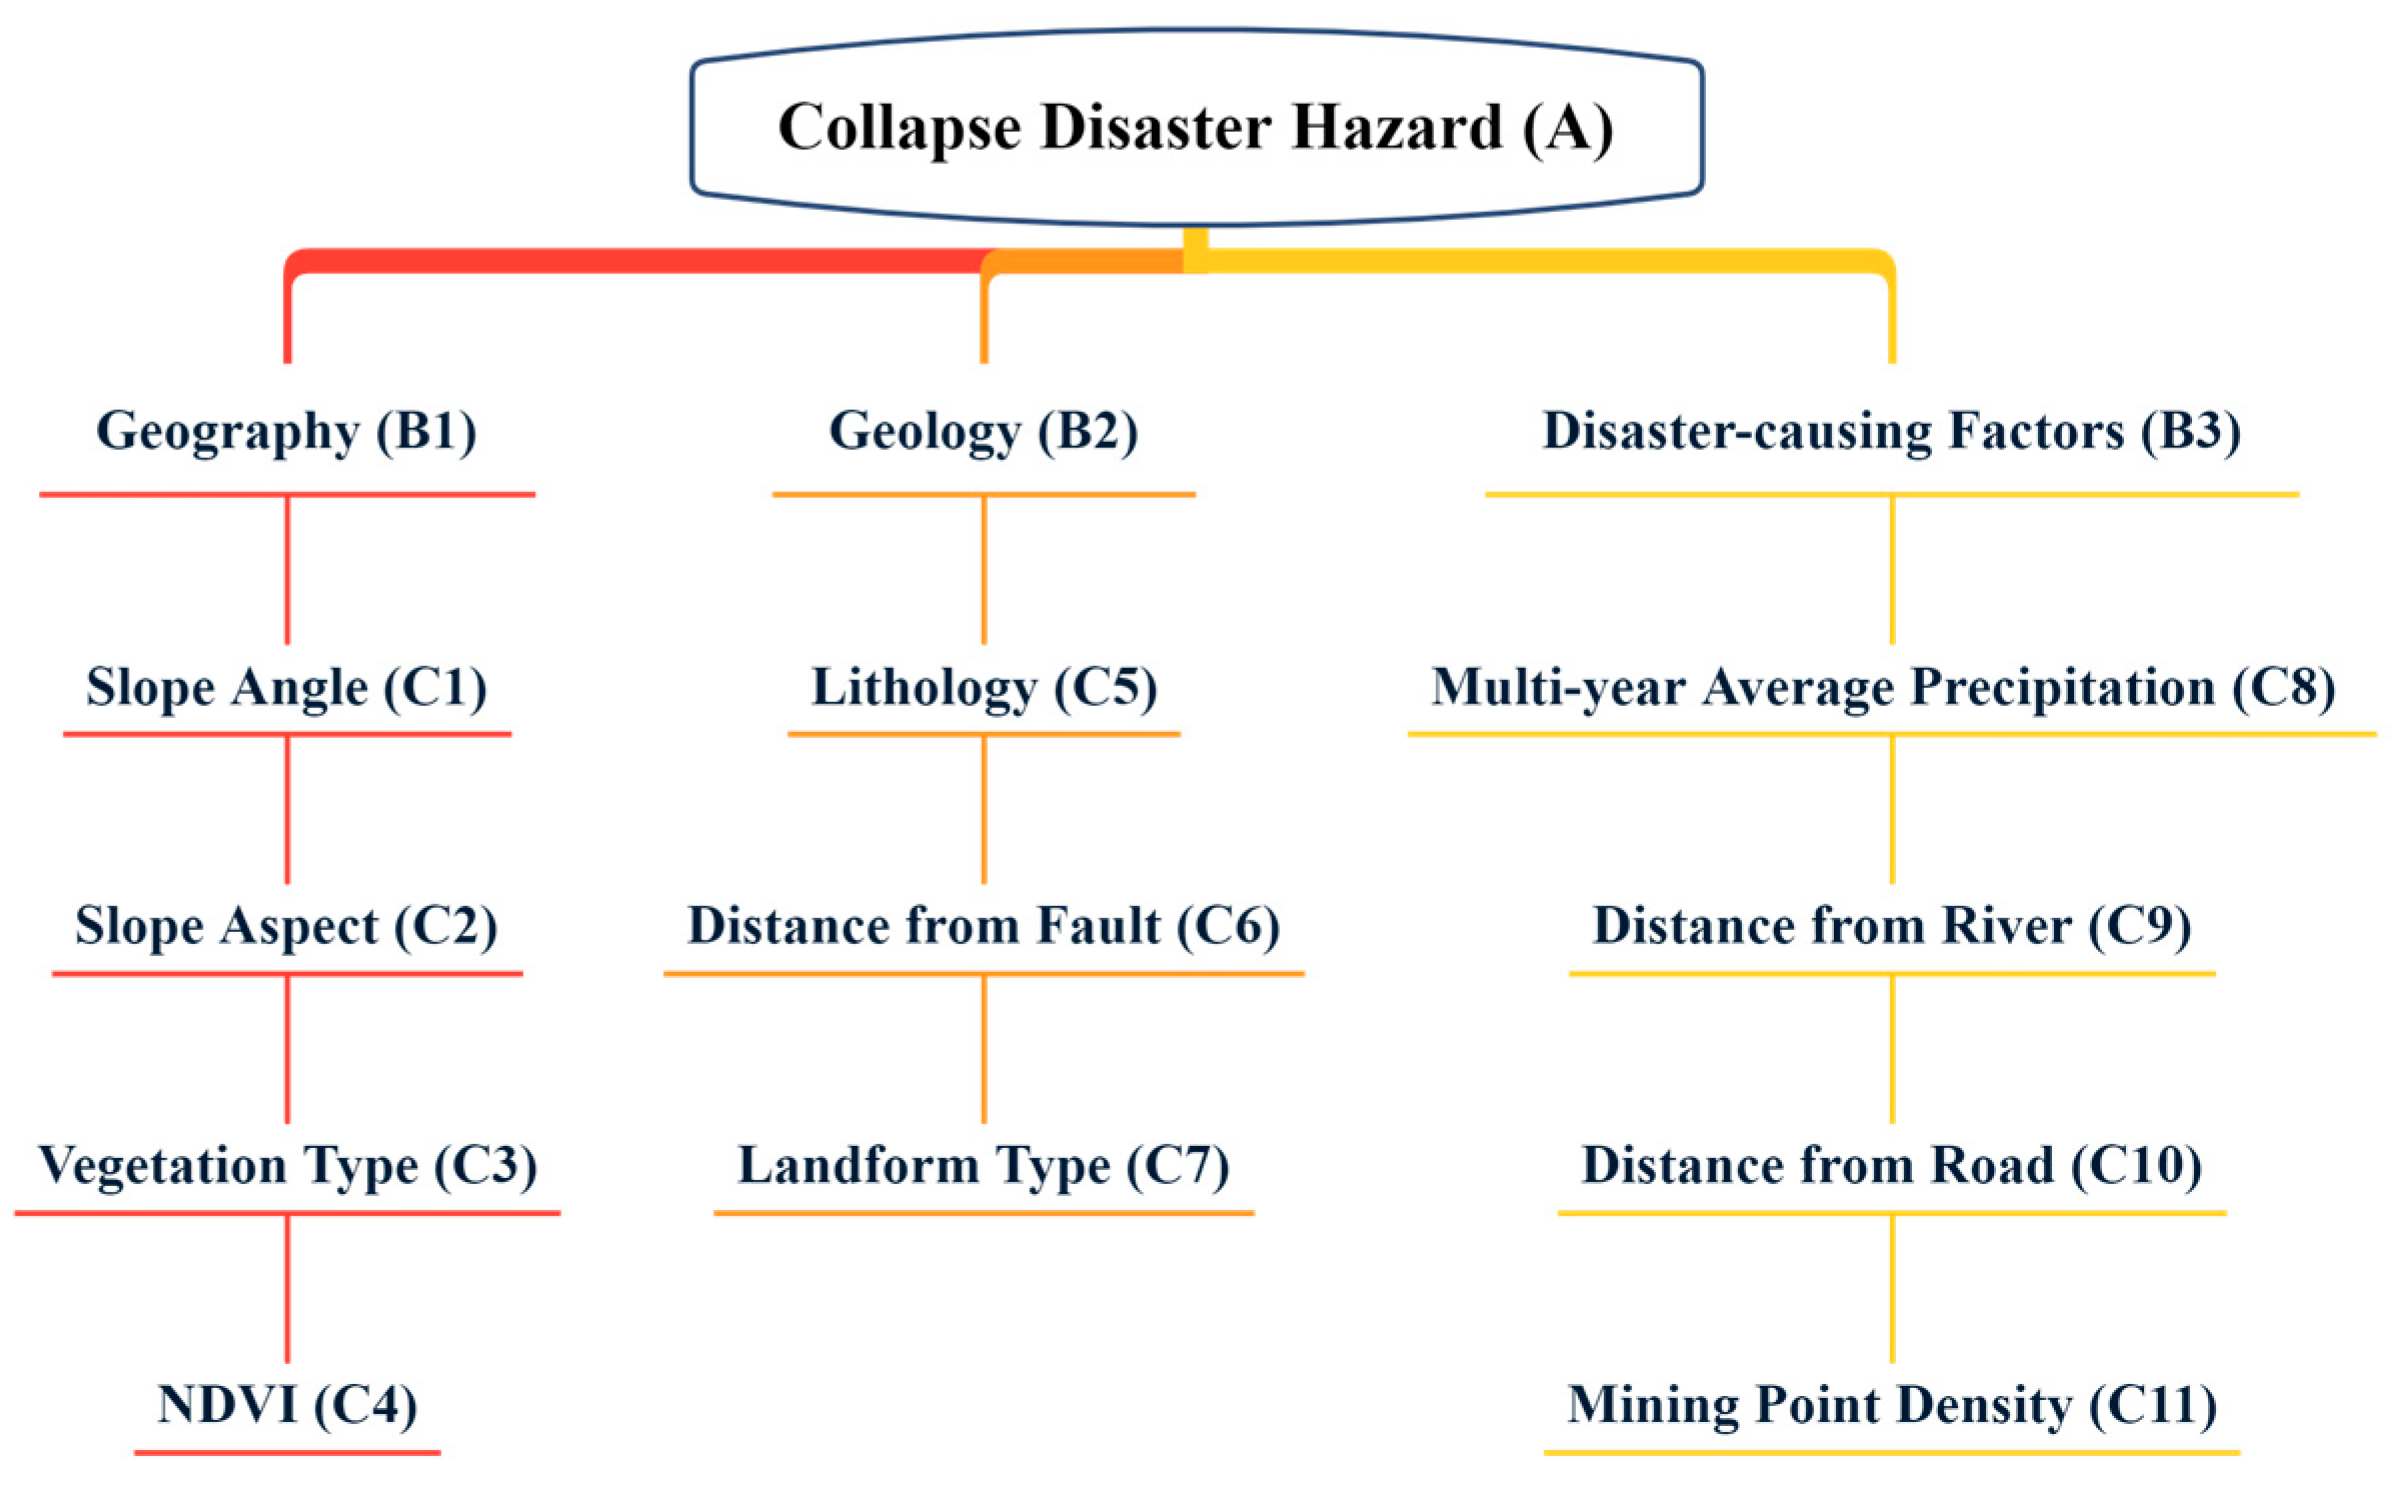
2.2.1. Establishment of the Indicator System
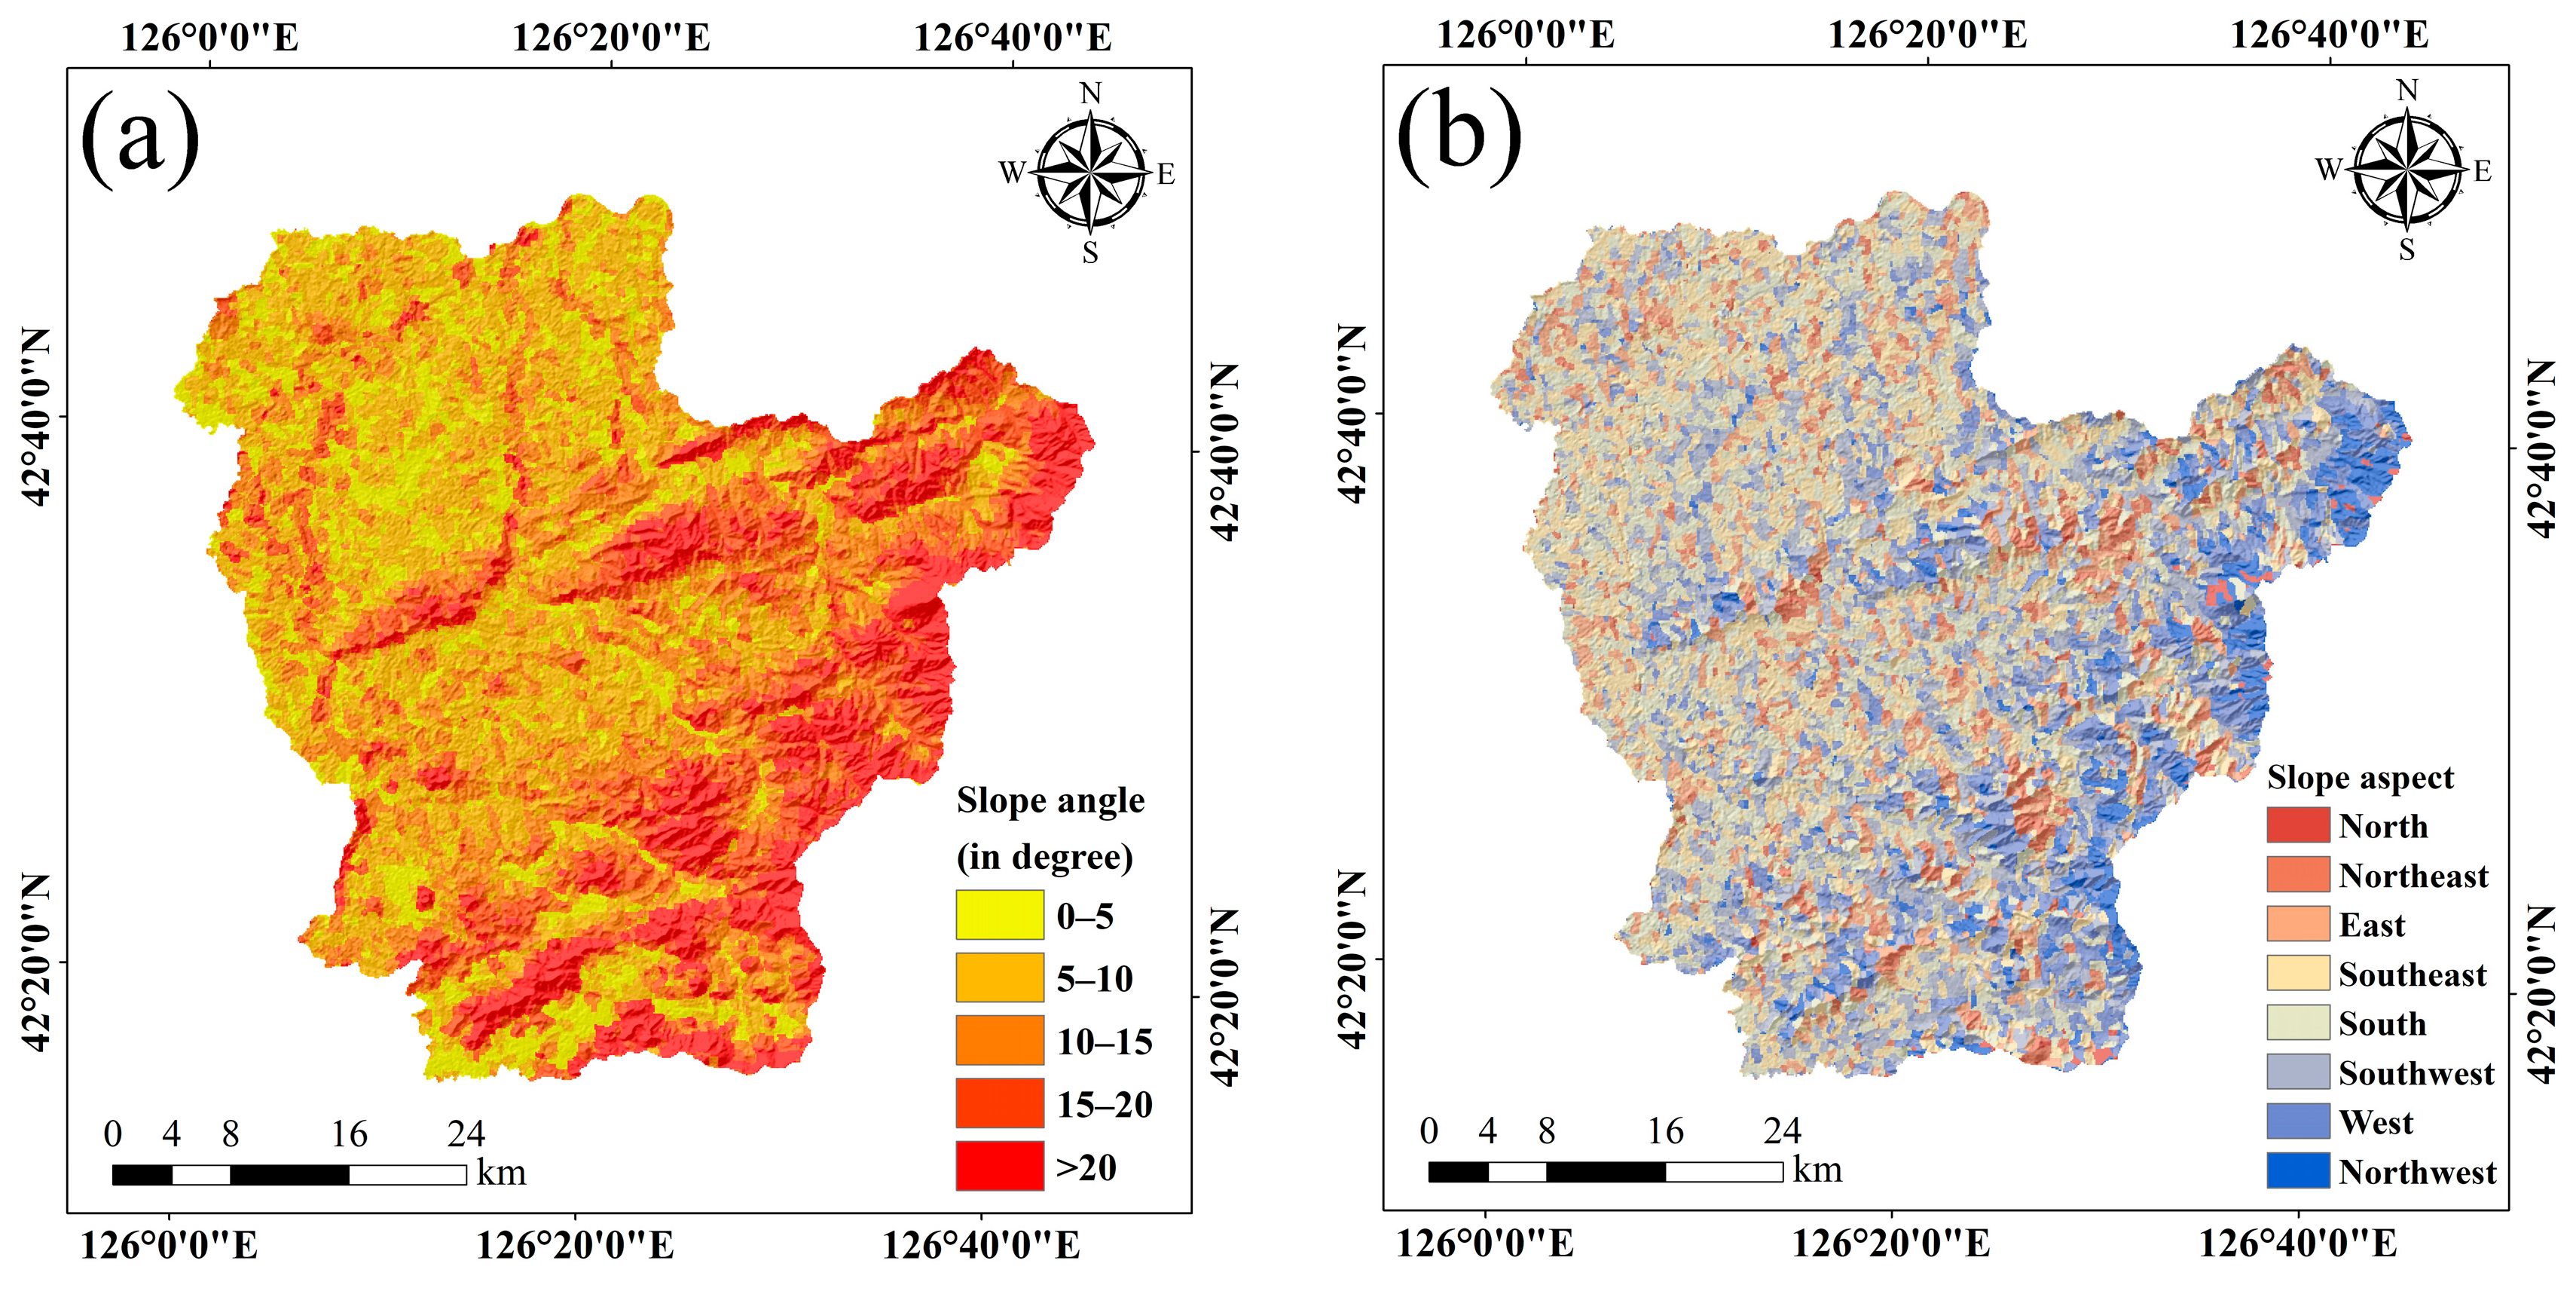
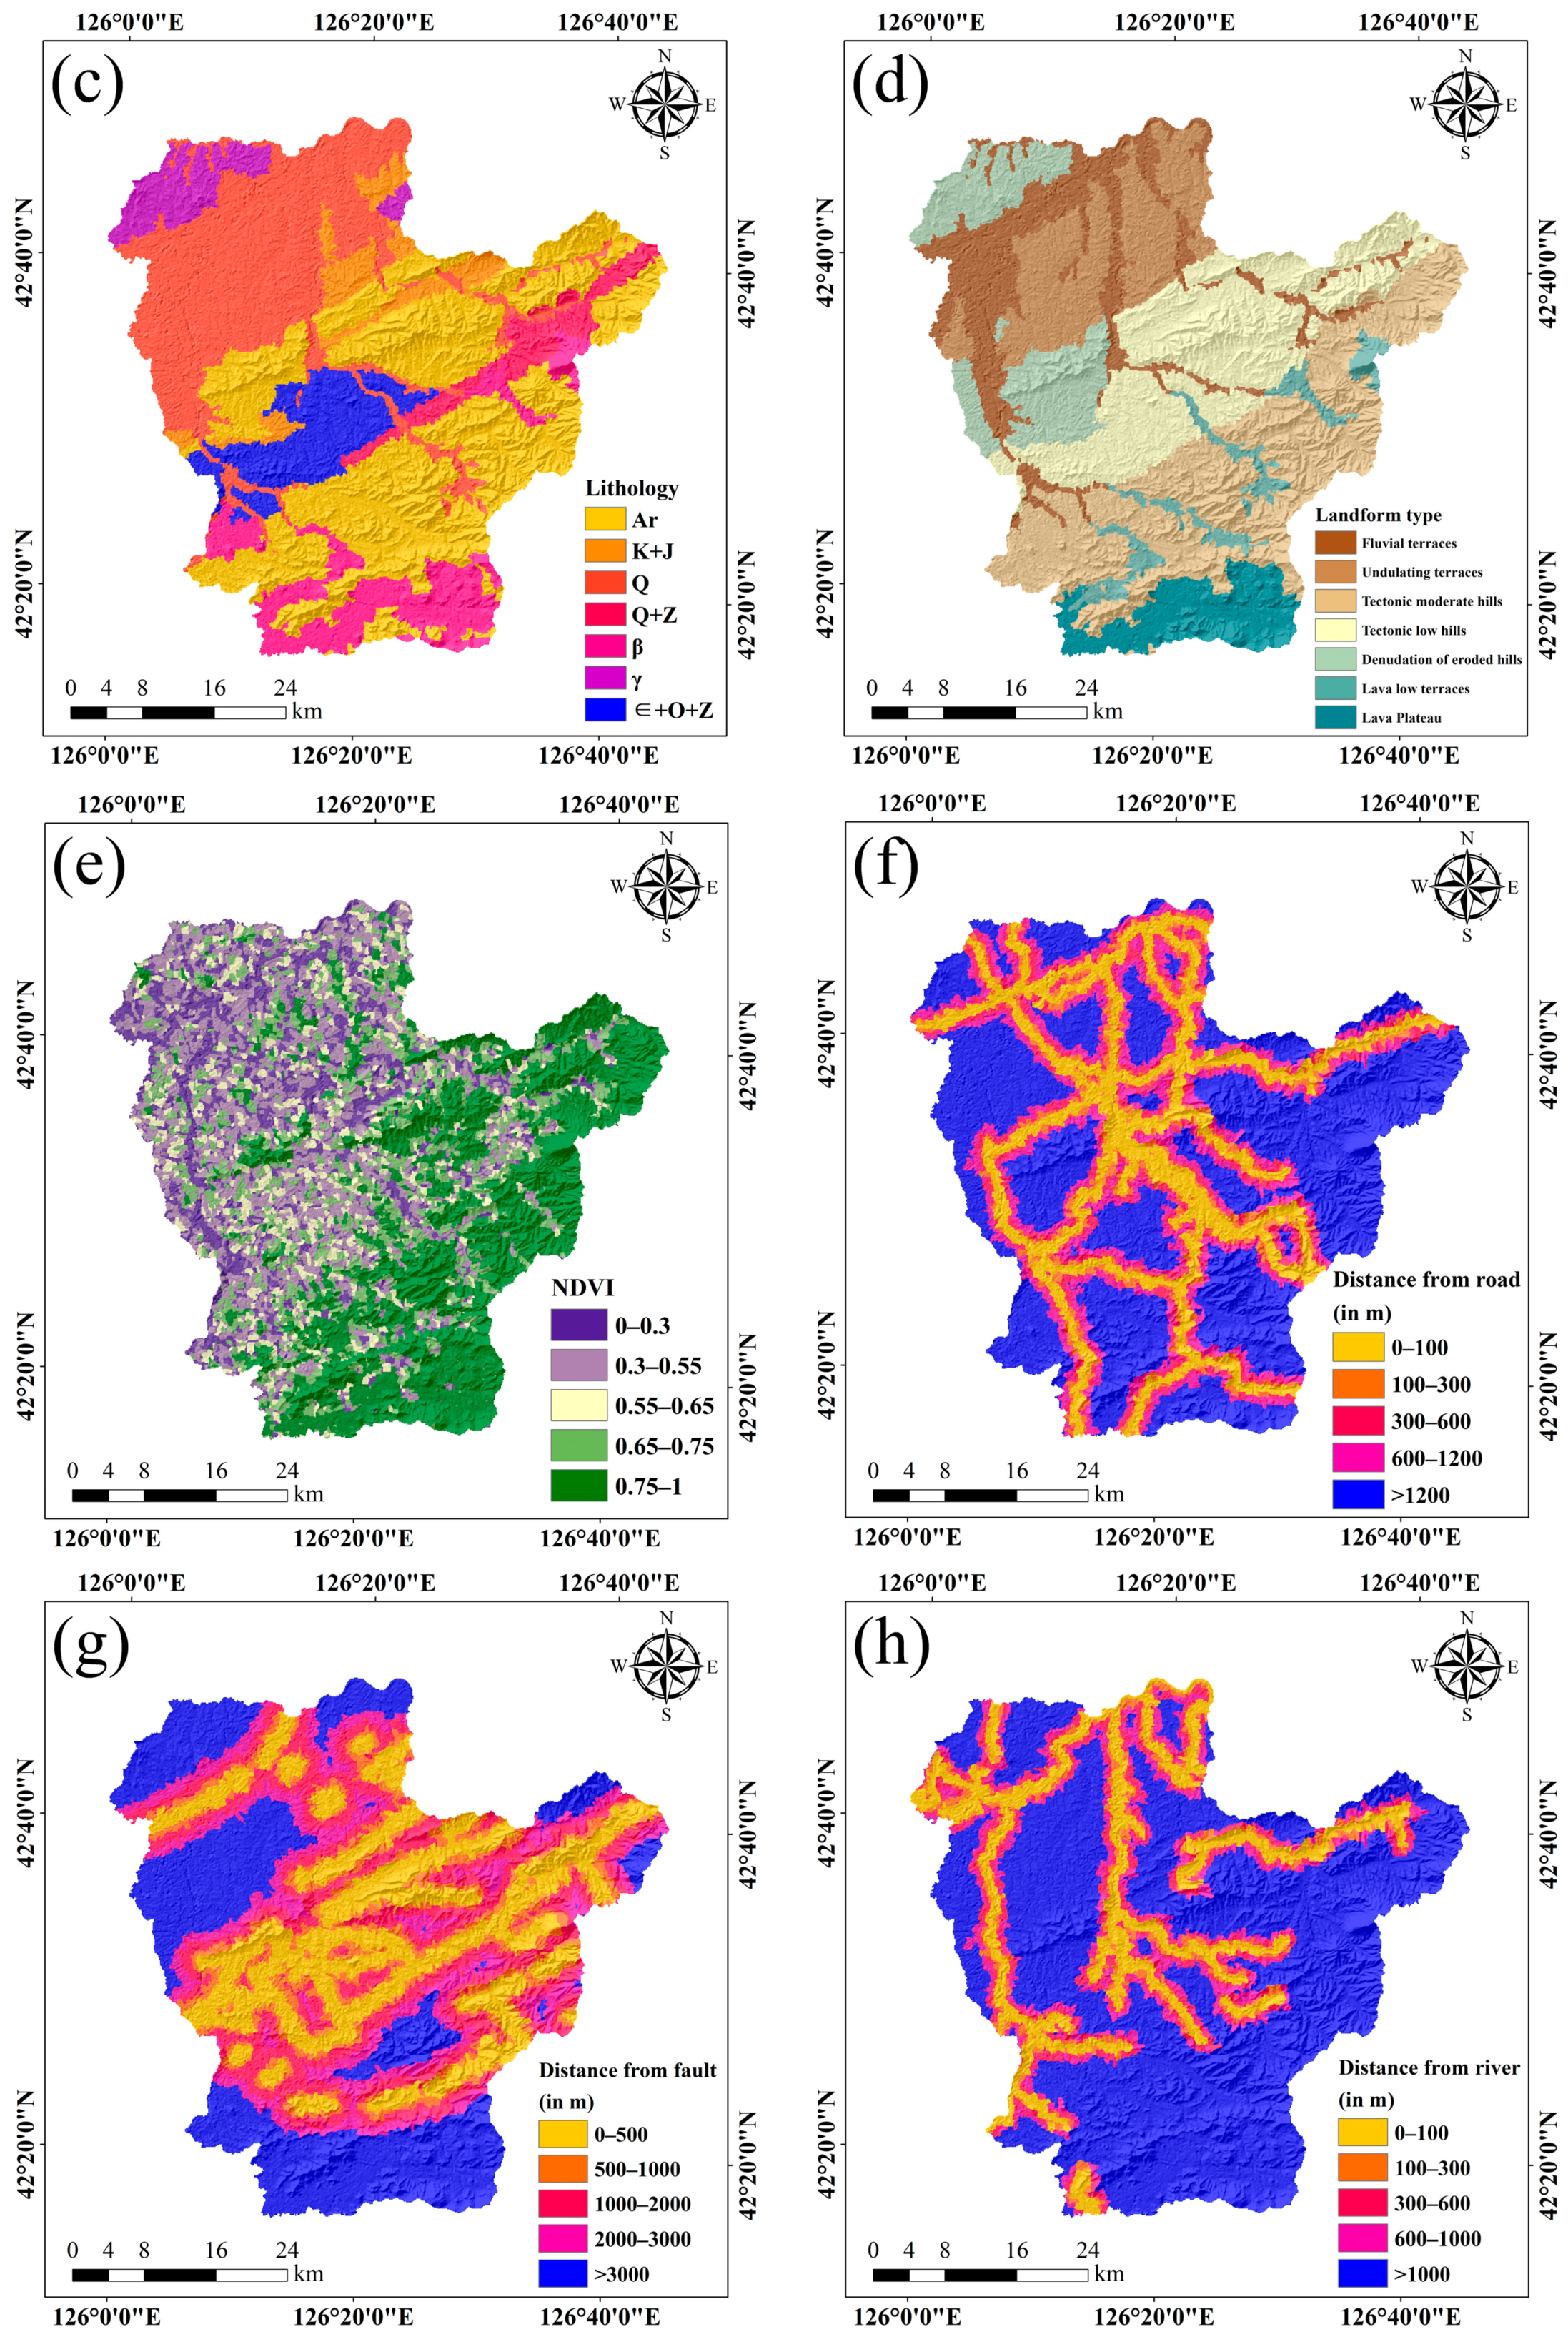
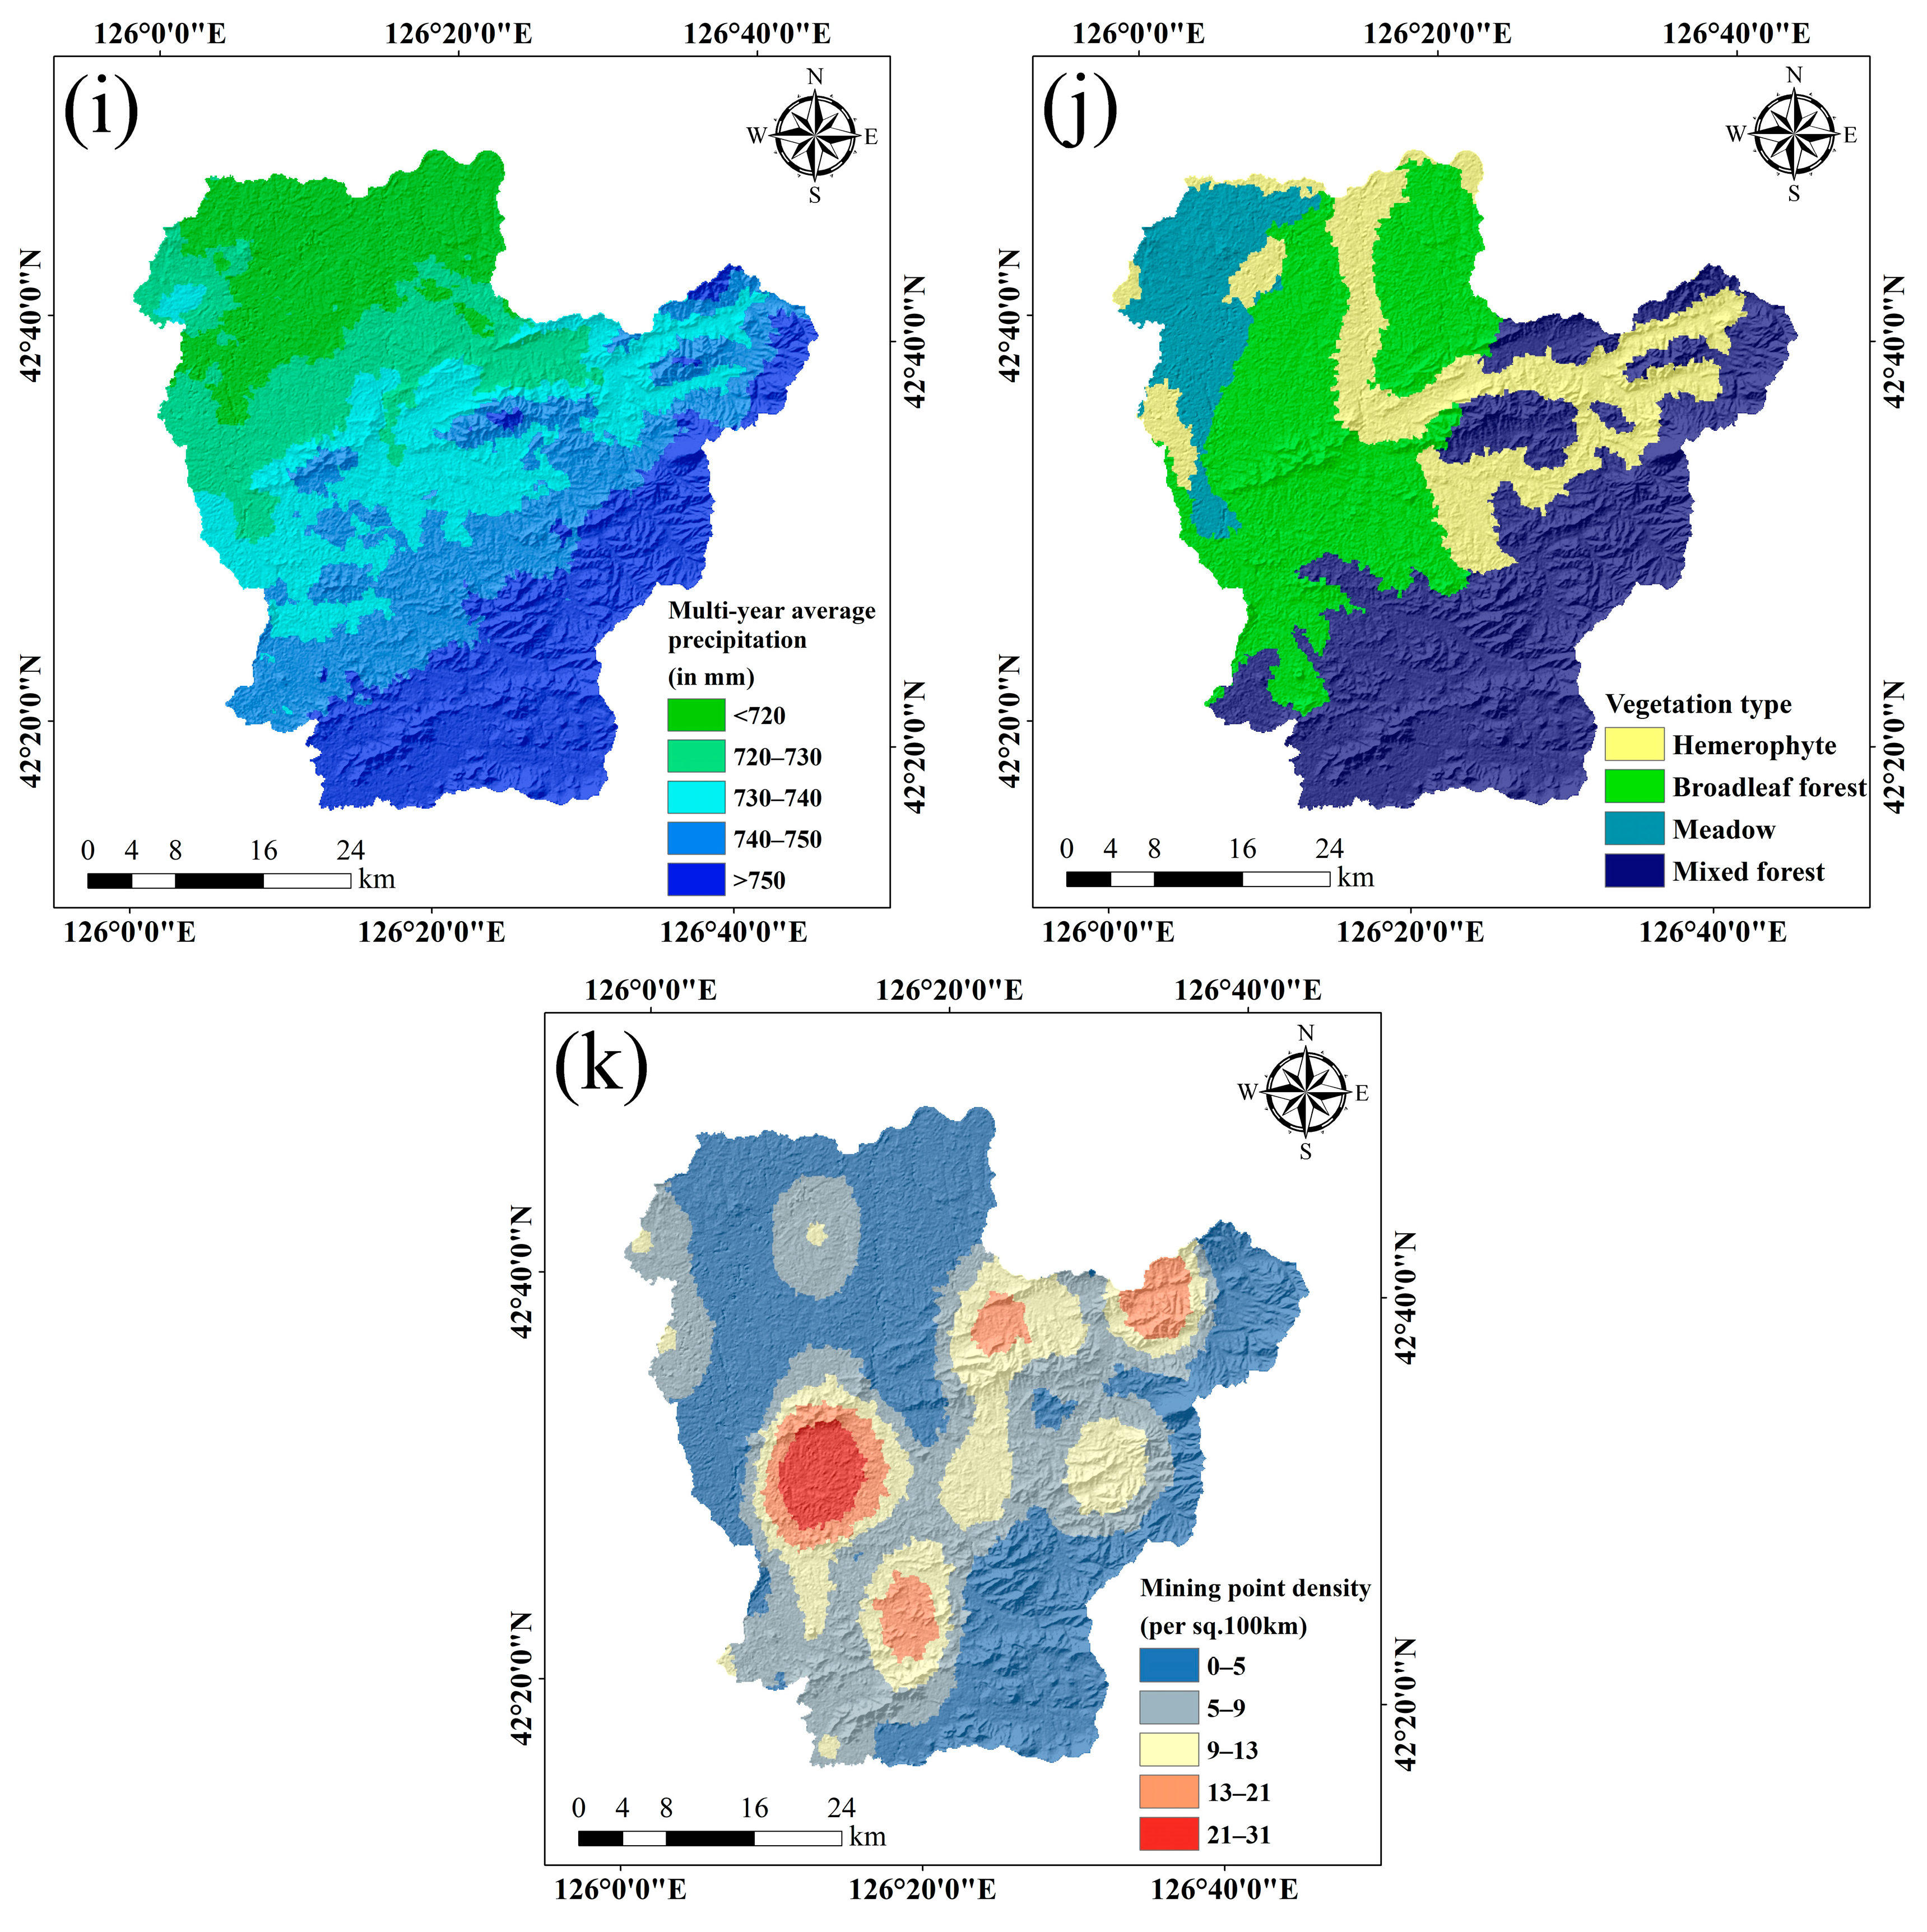
Selection of Hazard Indicators
Selection of Exposure Indicators
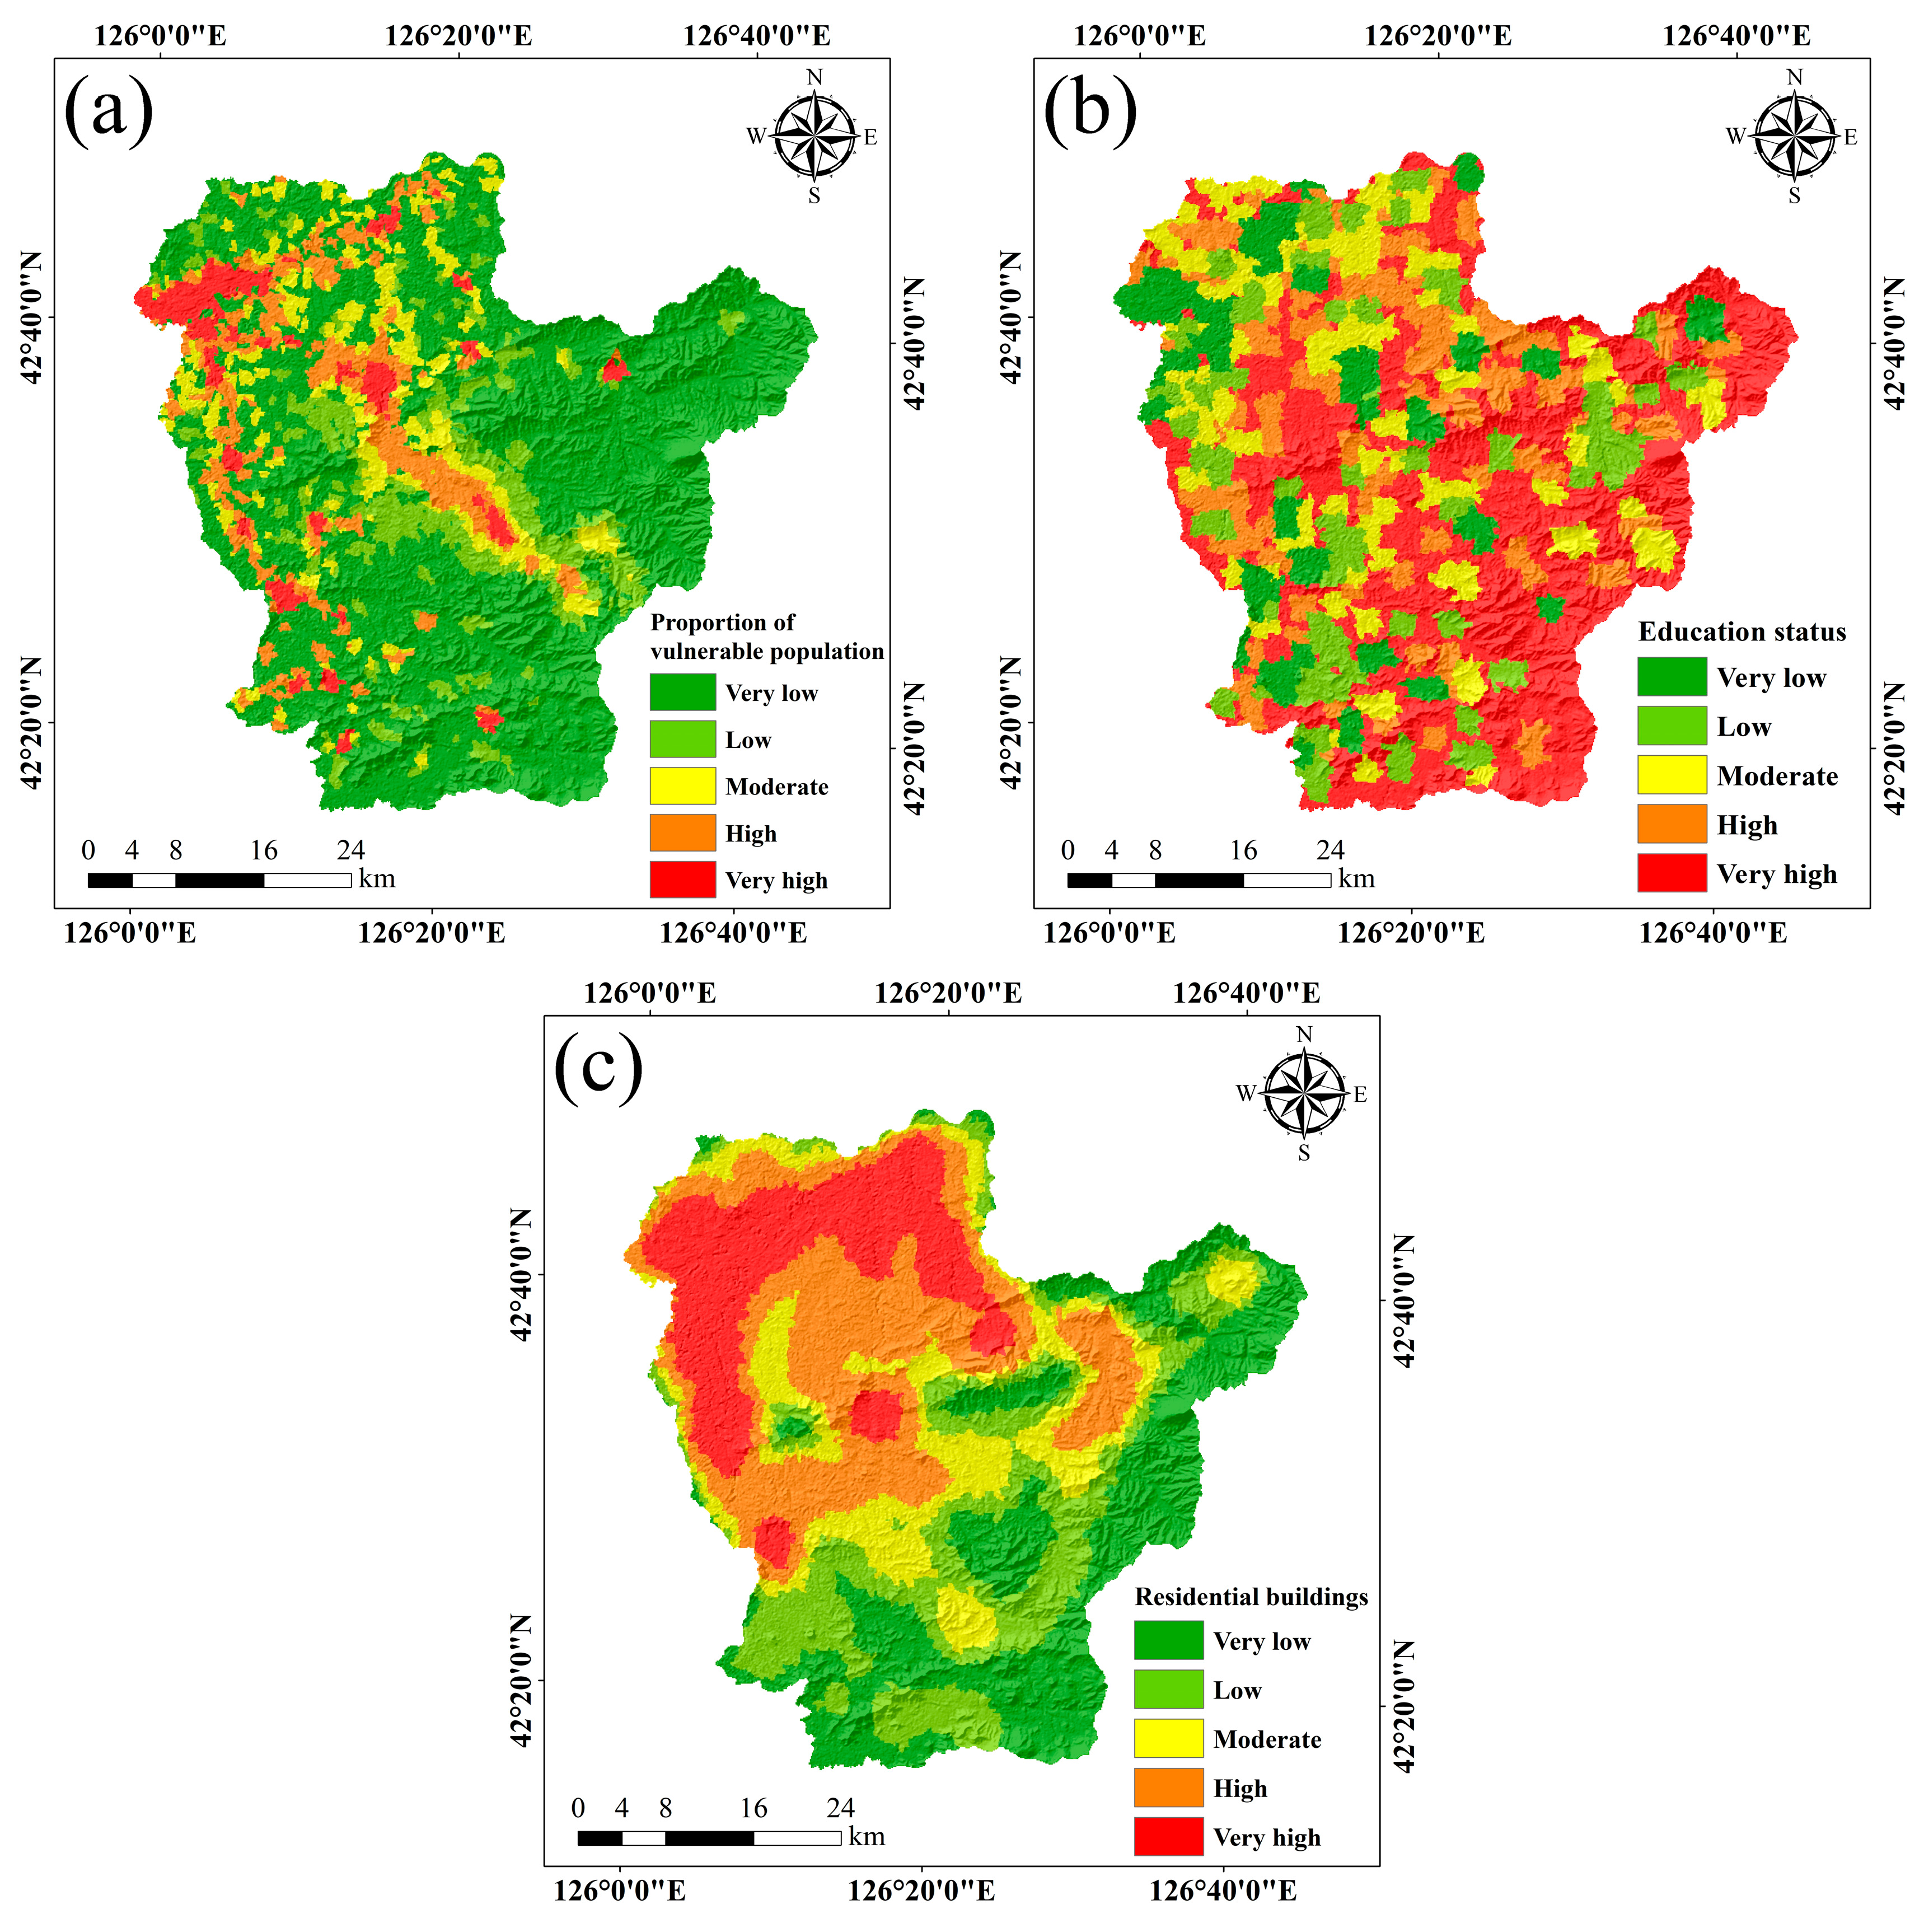
Selection of Vulnerability Indicators
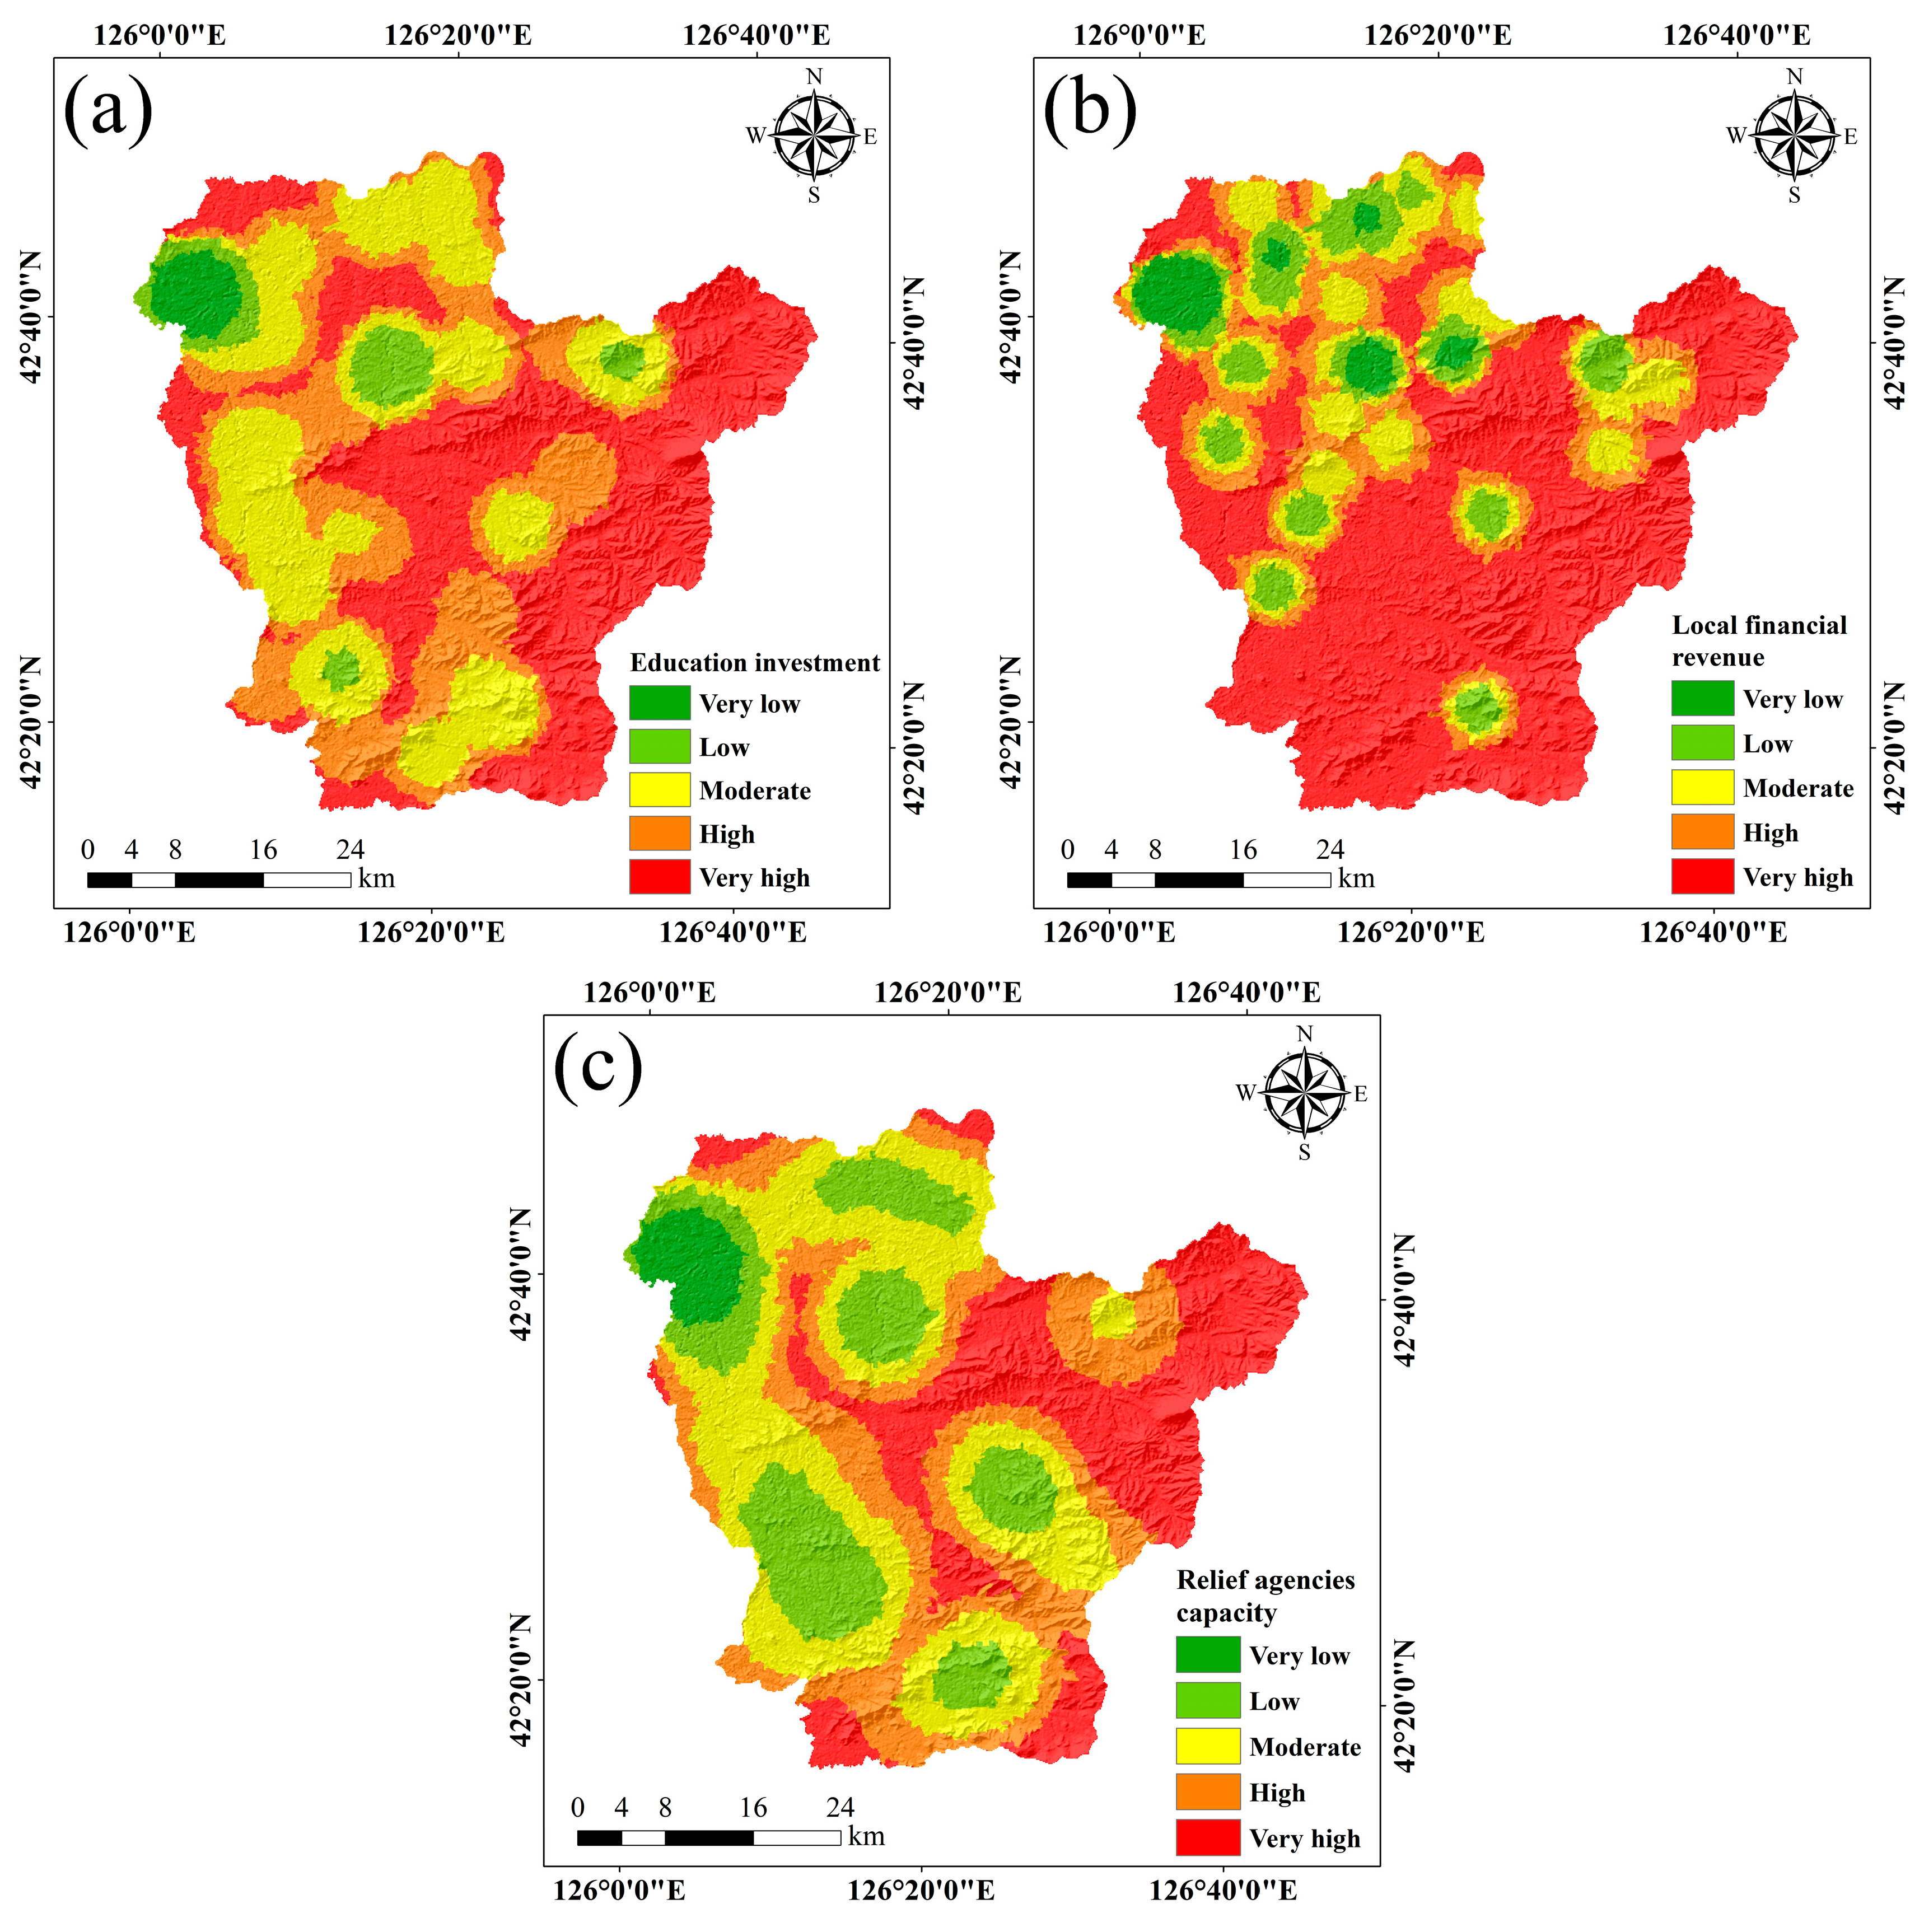
Selection of Emergency Response and Recovery Capability Indicators
2.2.2. Multicollinearity Analysis of Evaluation Indicators and Results
2.3. Data Collection
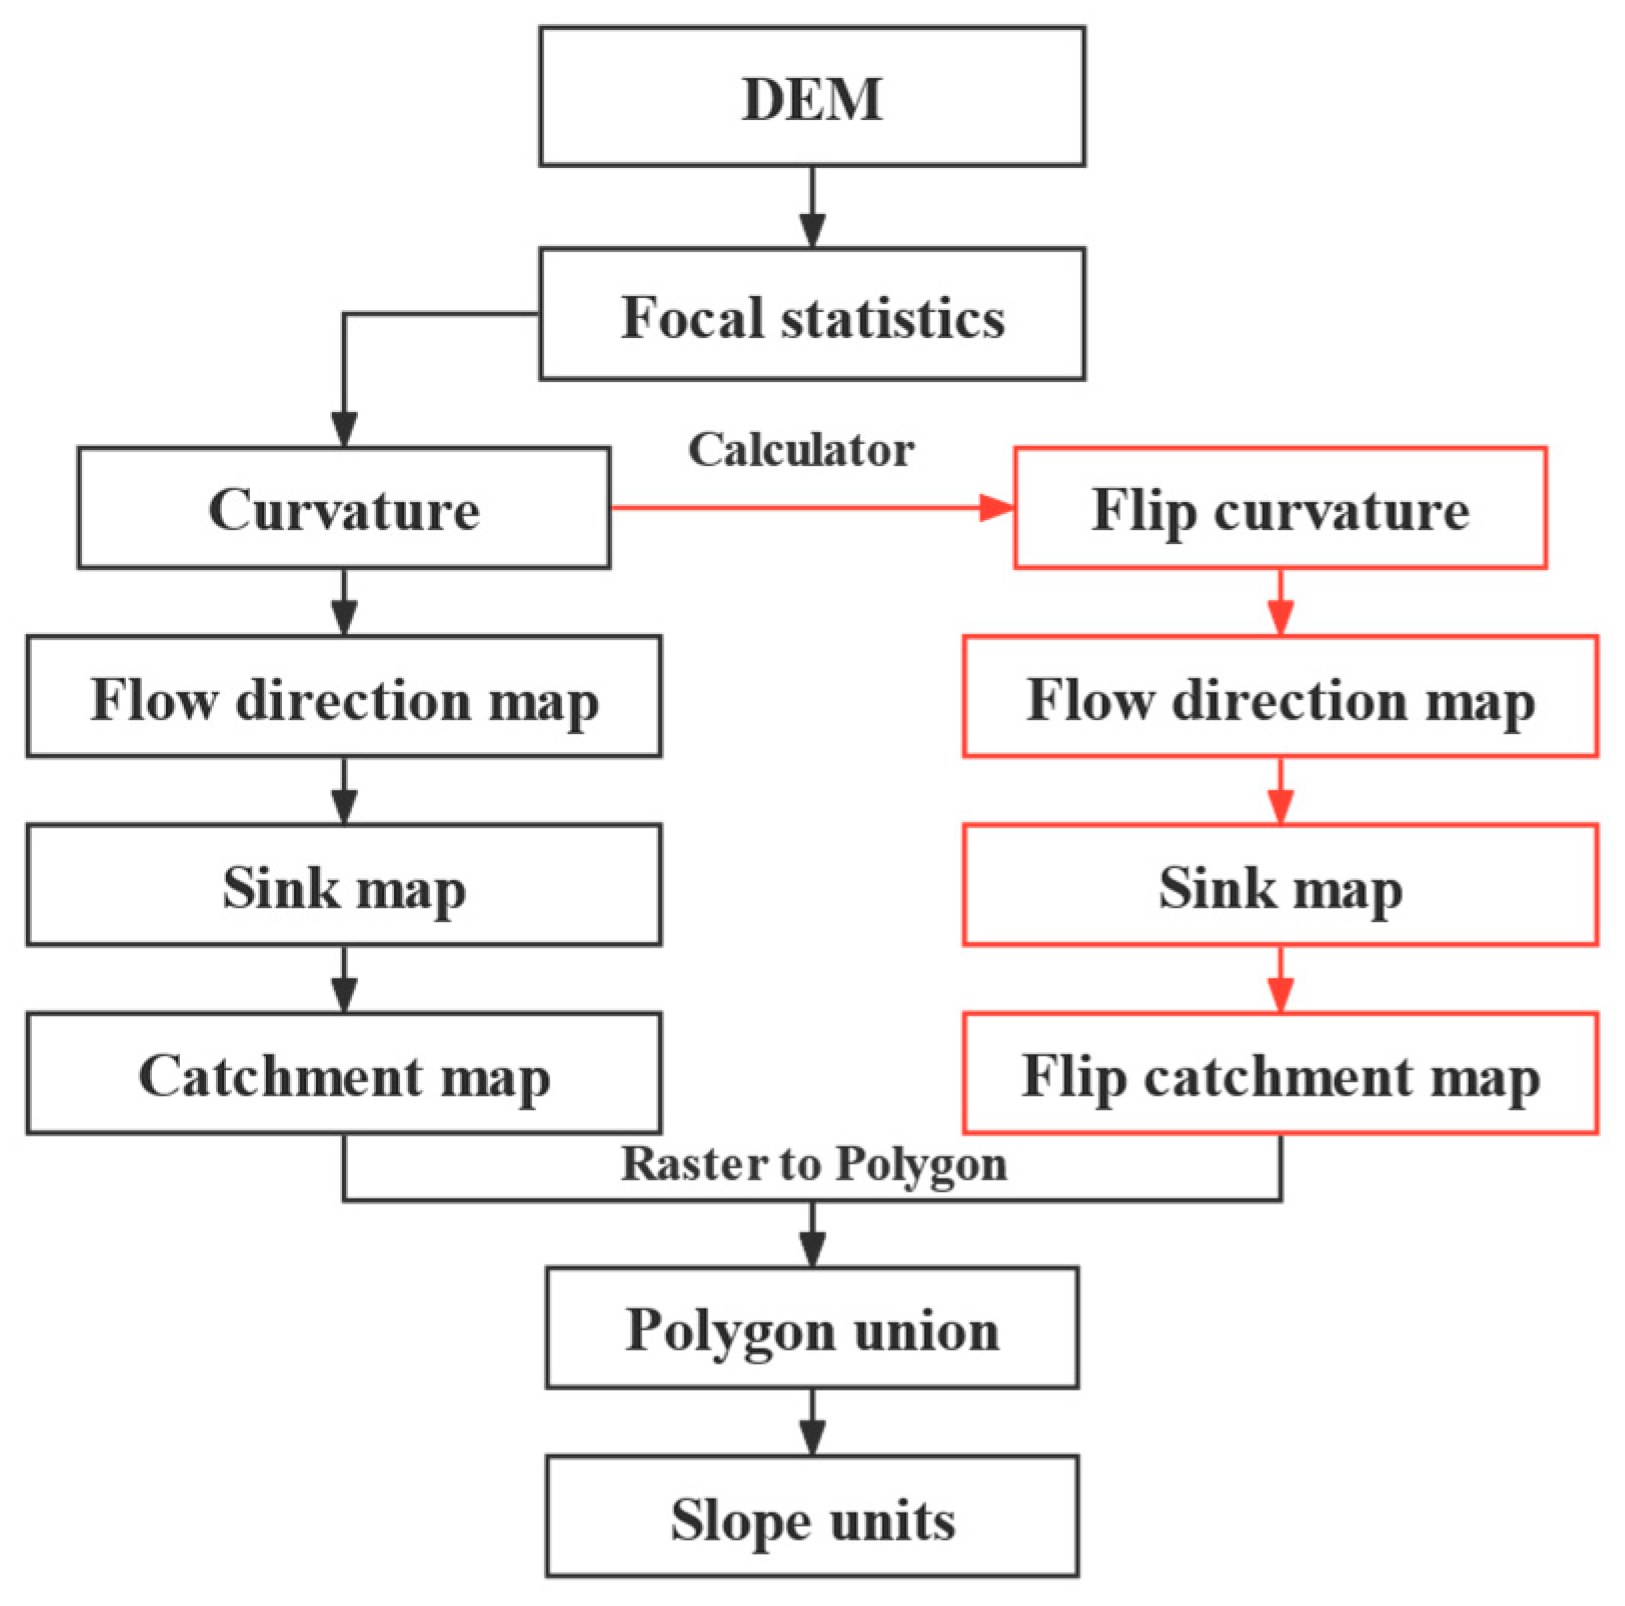
2.4. Map** Unit
2.5. Collapse Inventory
2.6. Collapse Map** Model
2.6.1. Hazard Map** Model
Information Content Model (ICM)
Analytical Hierarchy Process (AHP)
AHP-ICM Model
2.6.2. Exposure, Vulnerability, and Emergency Responses and Recovery Capability Map** Model
Entropy Weighting Method (EWM)
AHP-EWM Model
2.6.3. Collapse Risk Map** Model
3. Results and Analysis of the Hazard Map** Model
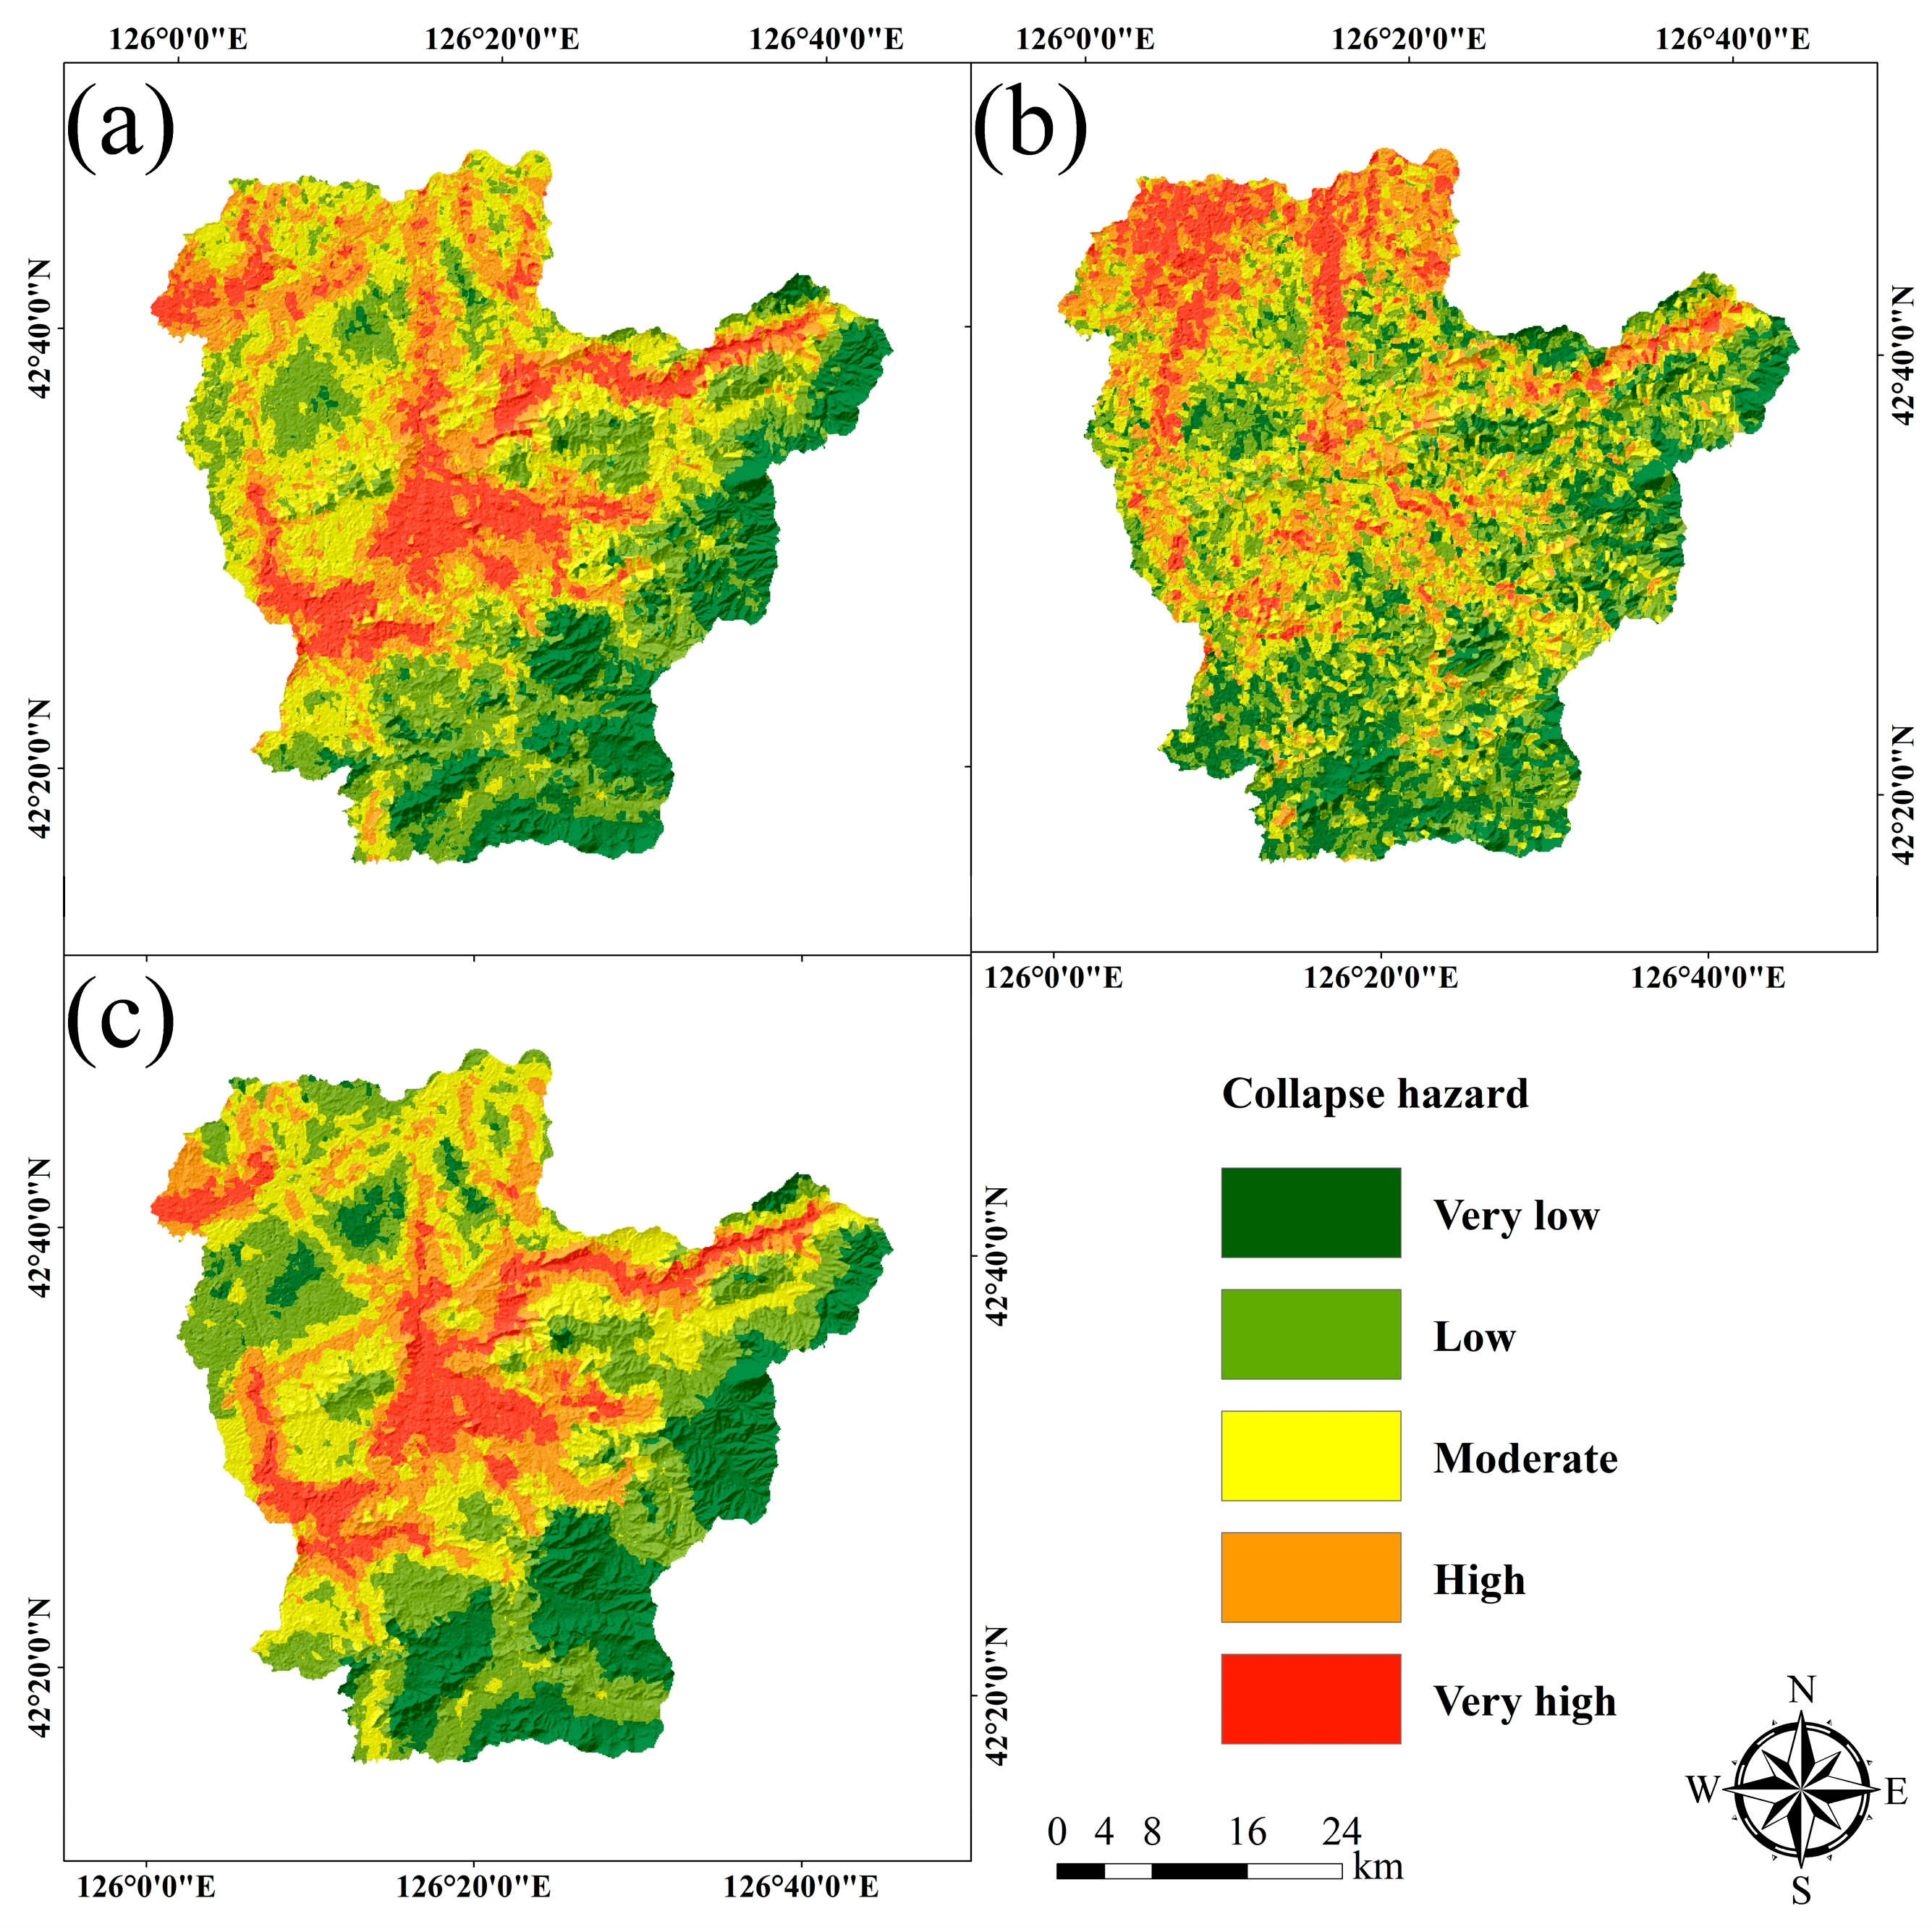
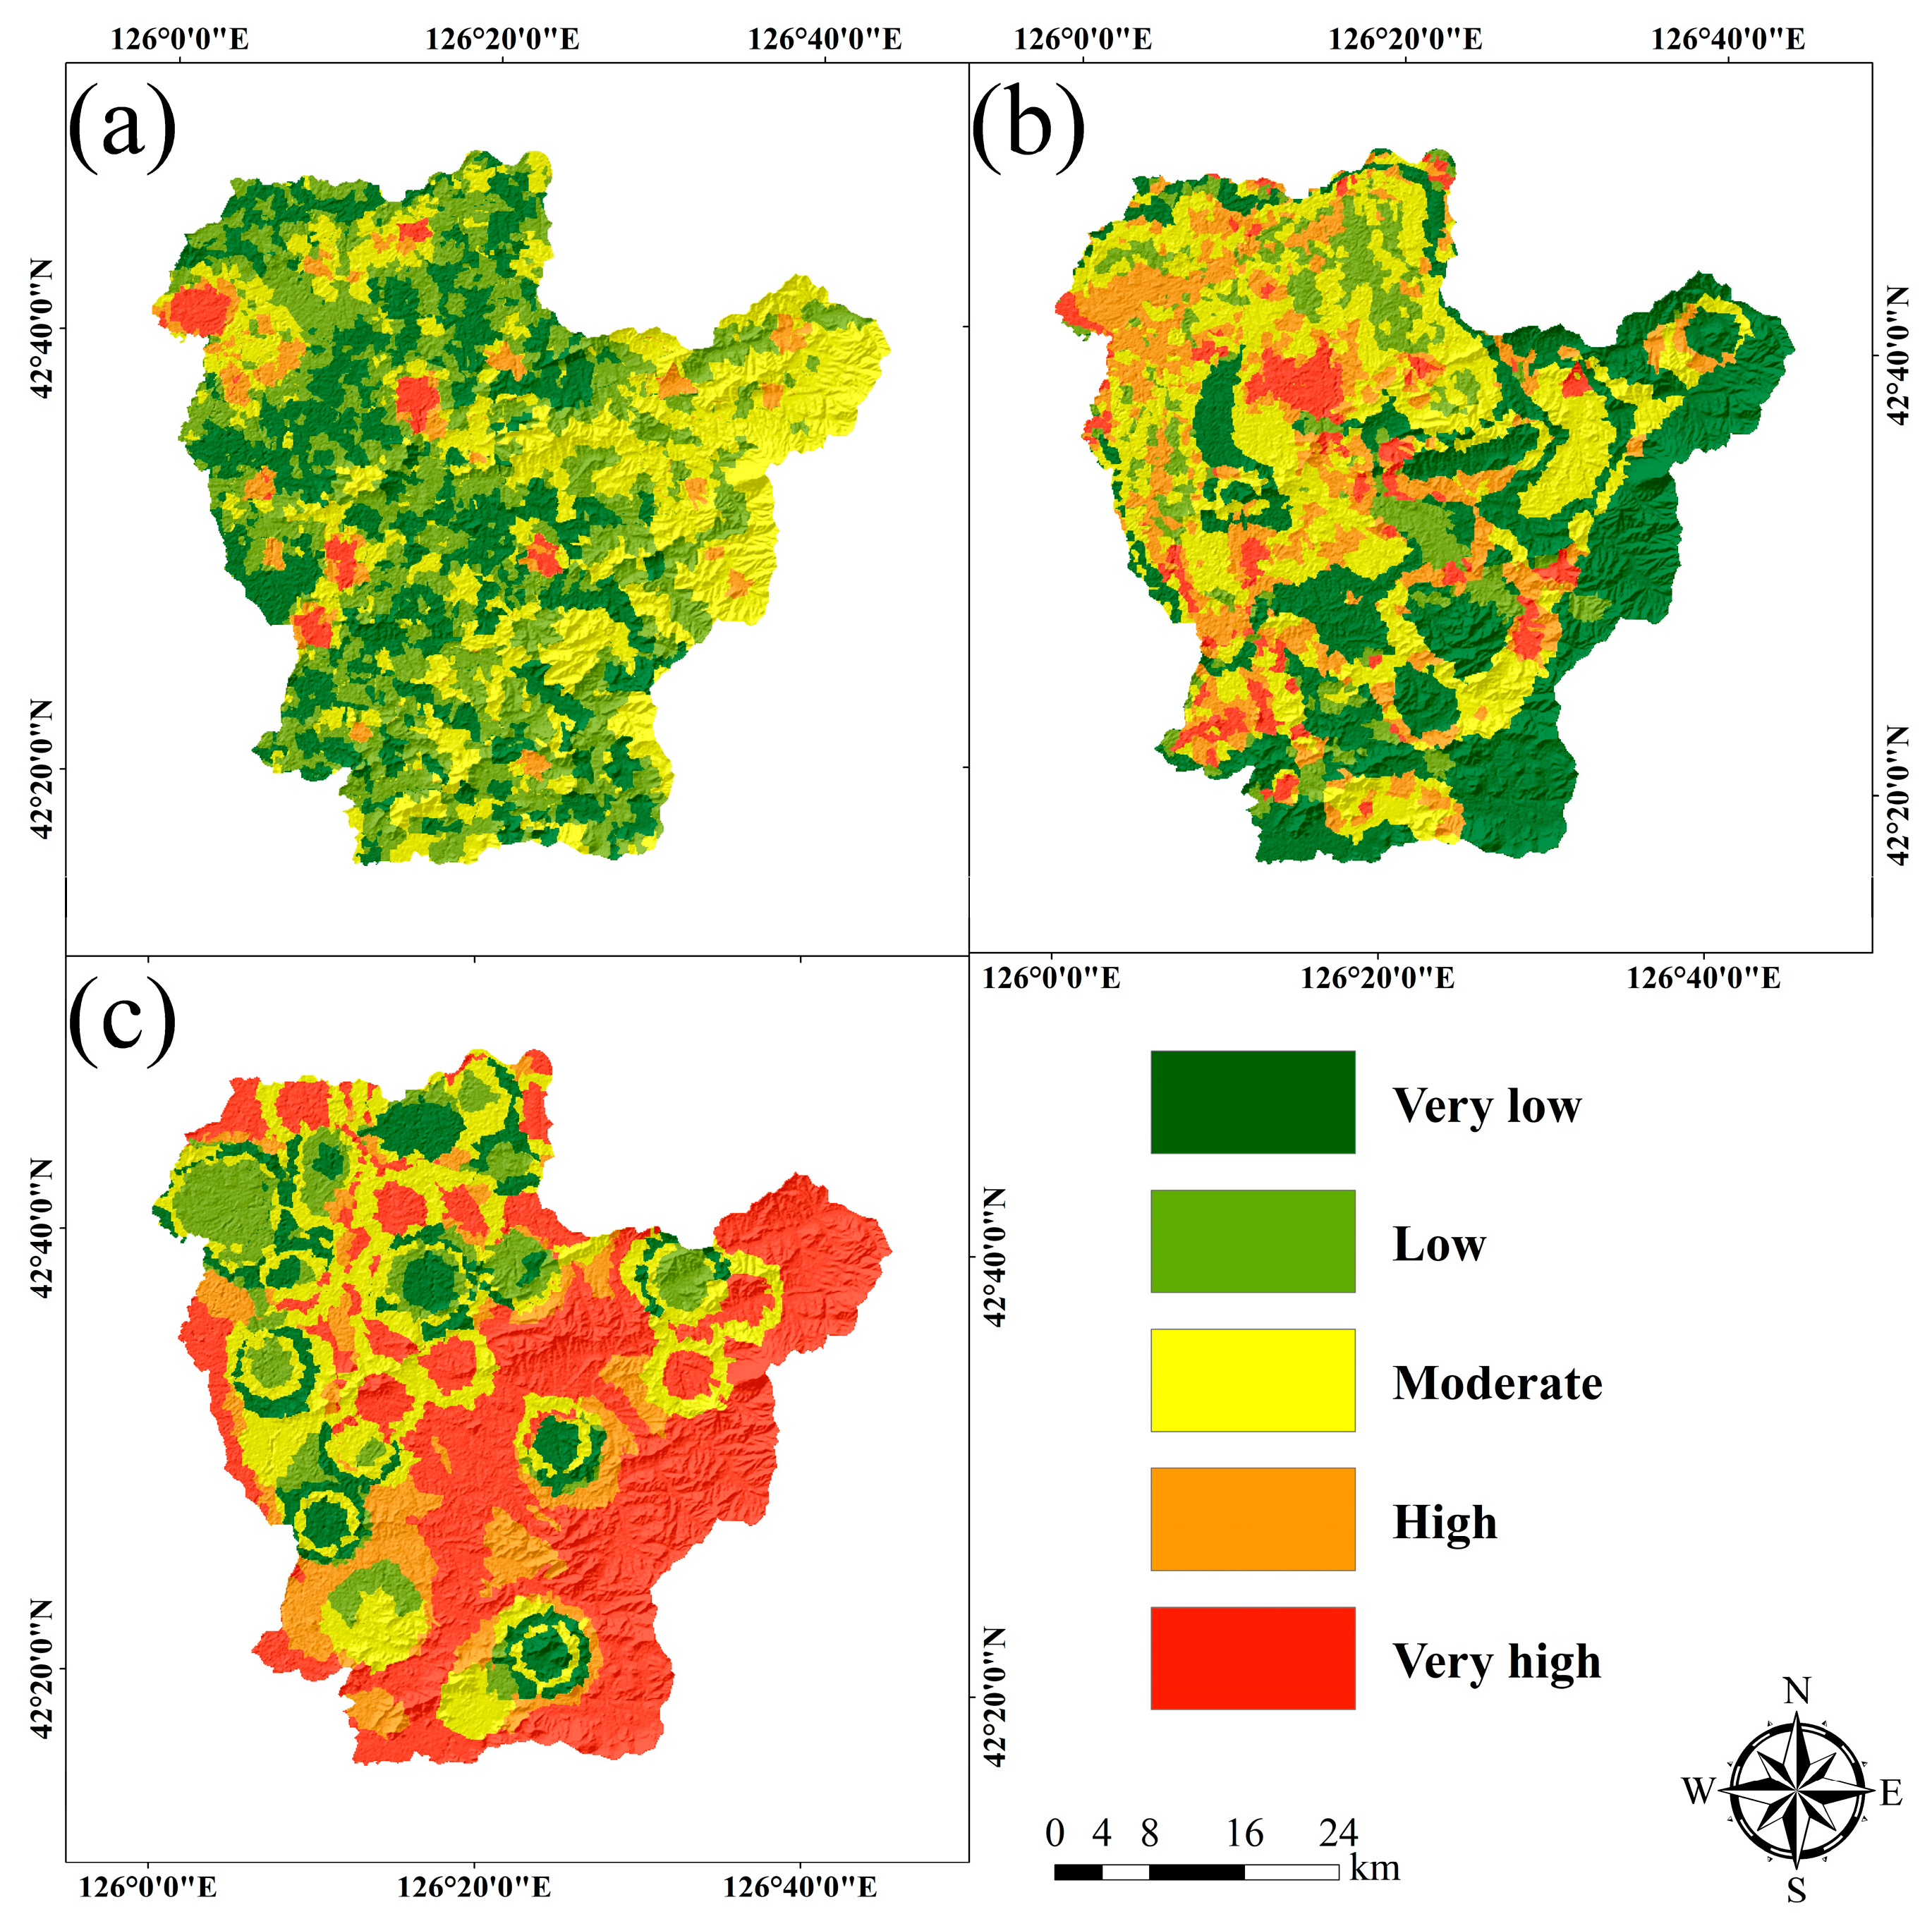
3.1. Results of the Model
3.1.1. Results of the Information Content Model (ICM)
3.1.2. Results of the Analytical Hierarchy Process (AHP)
3.1.3. Results of the AHP-ICM Model
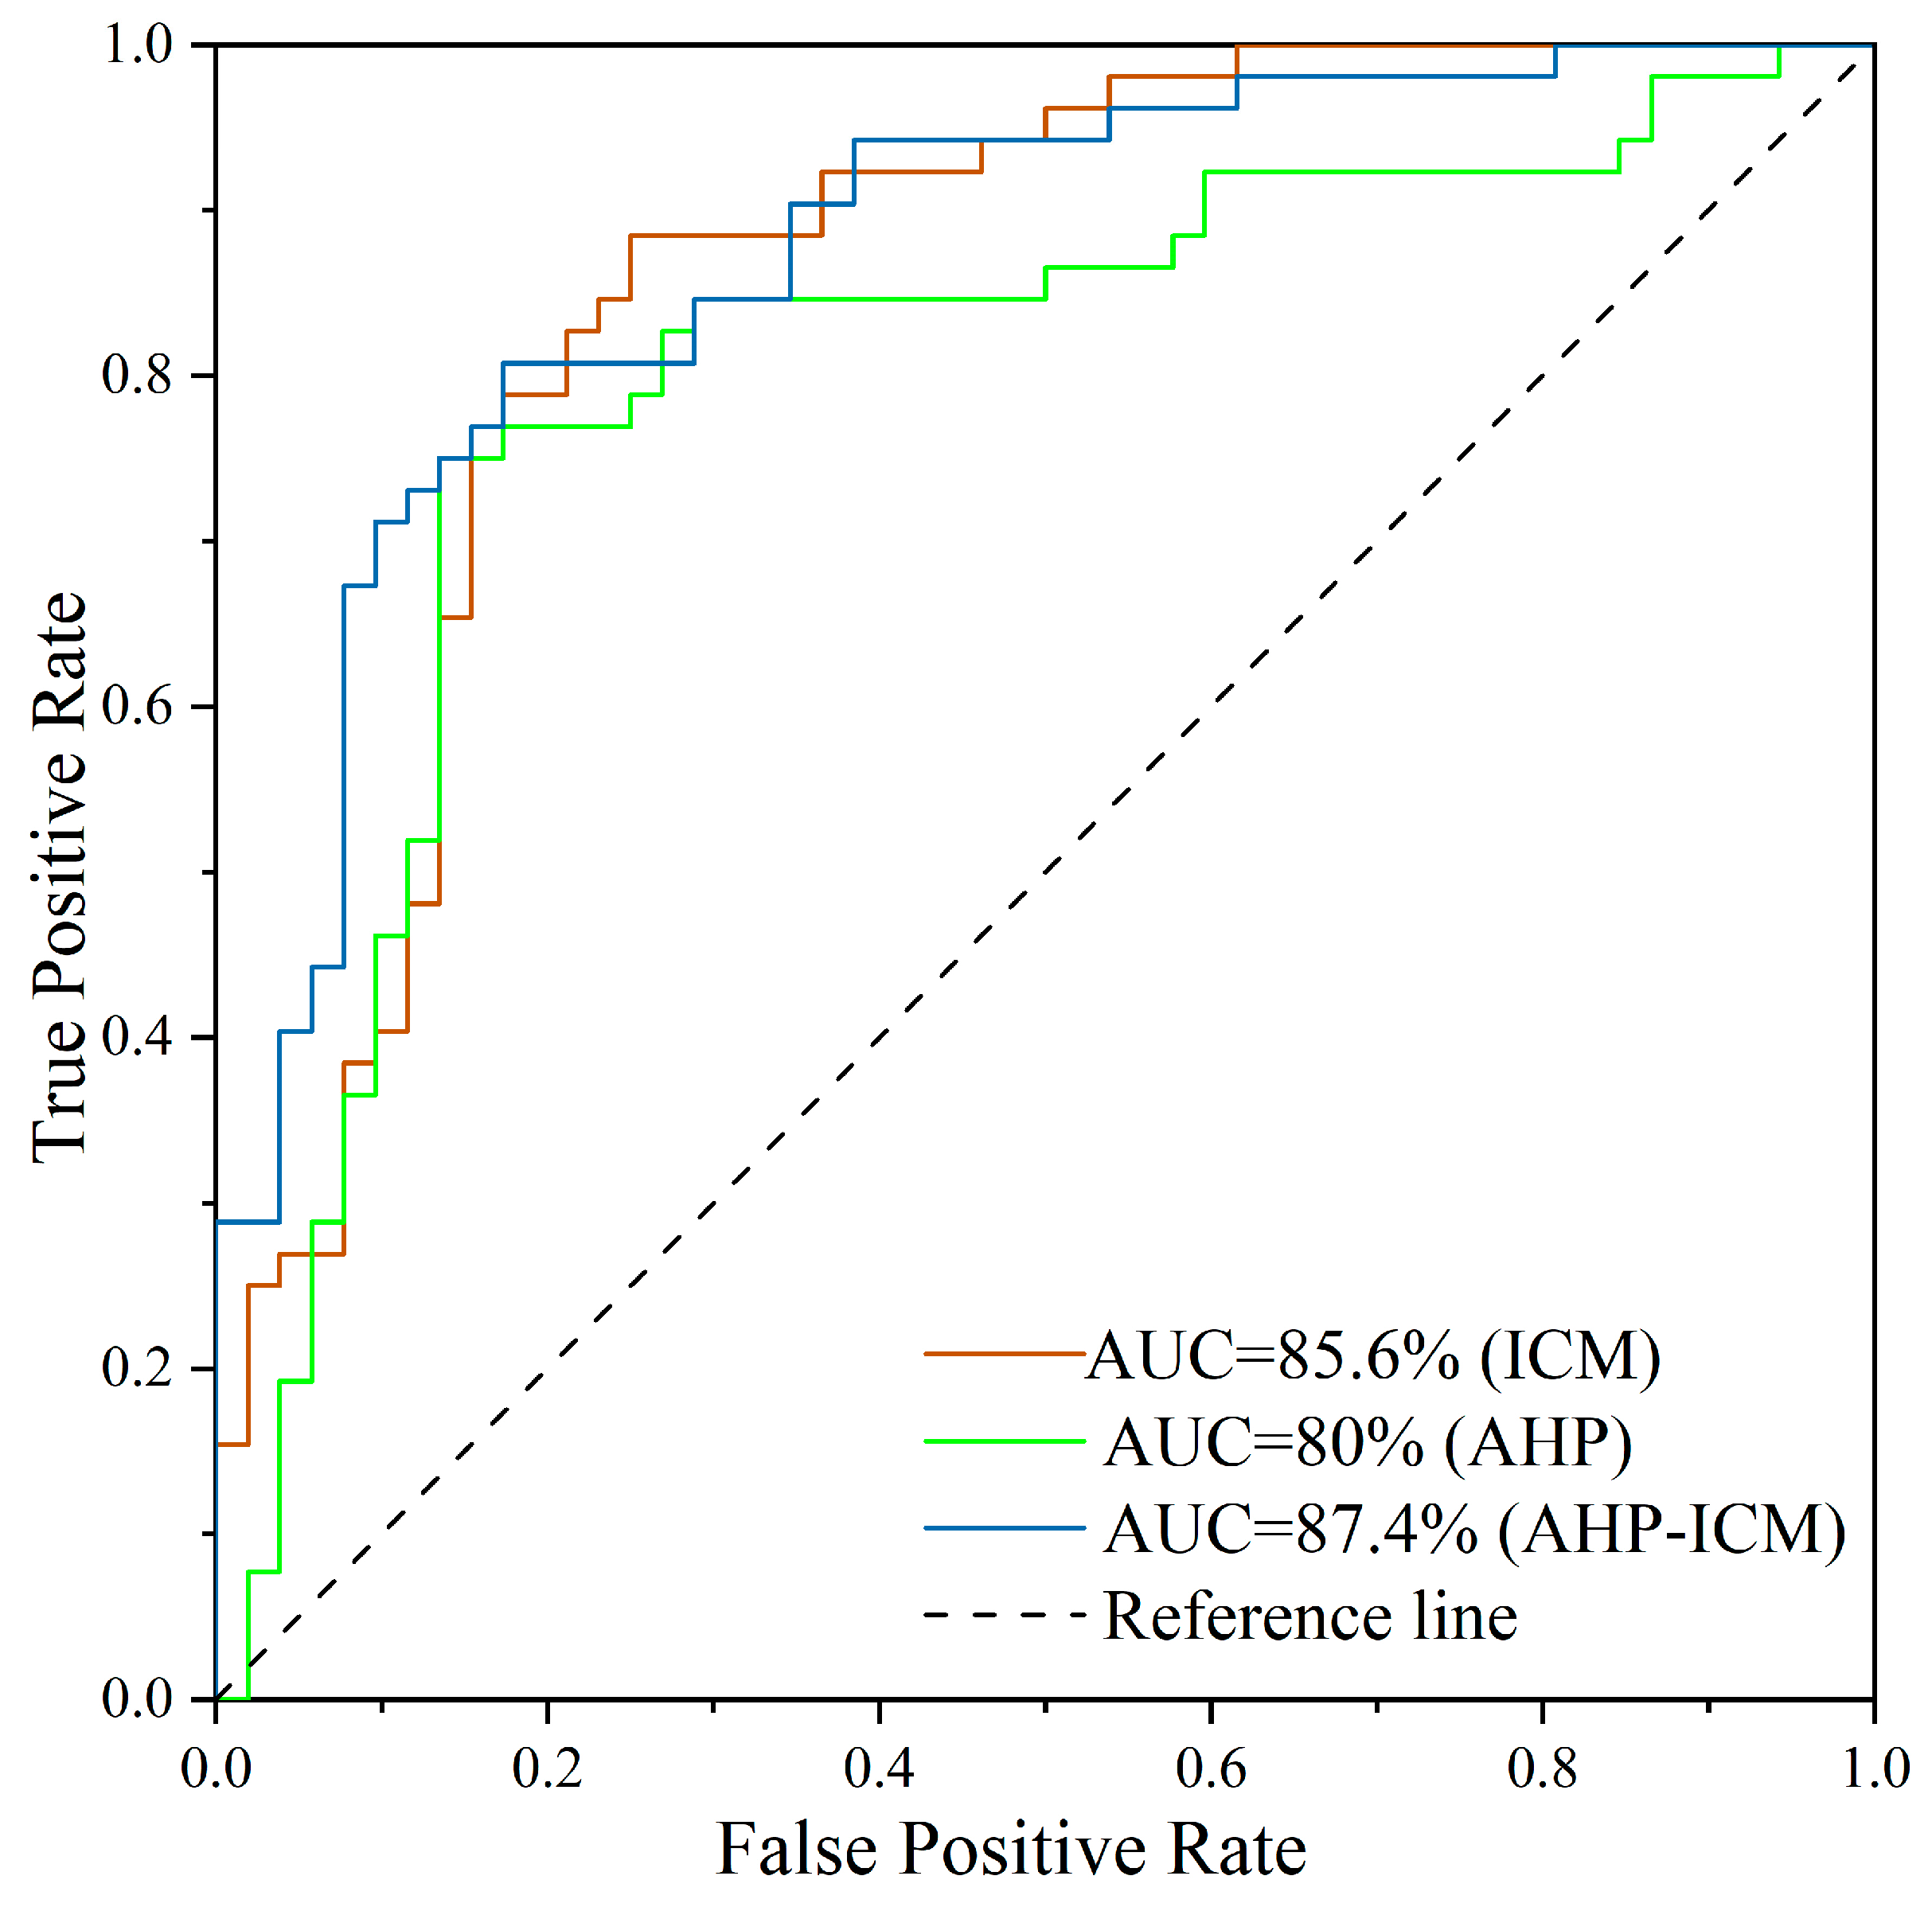
3.2. Validation of the Hazard Map** Model
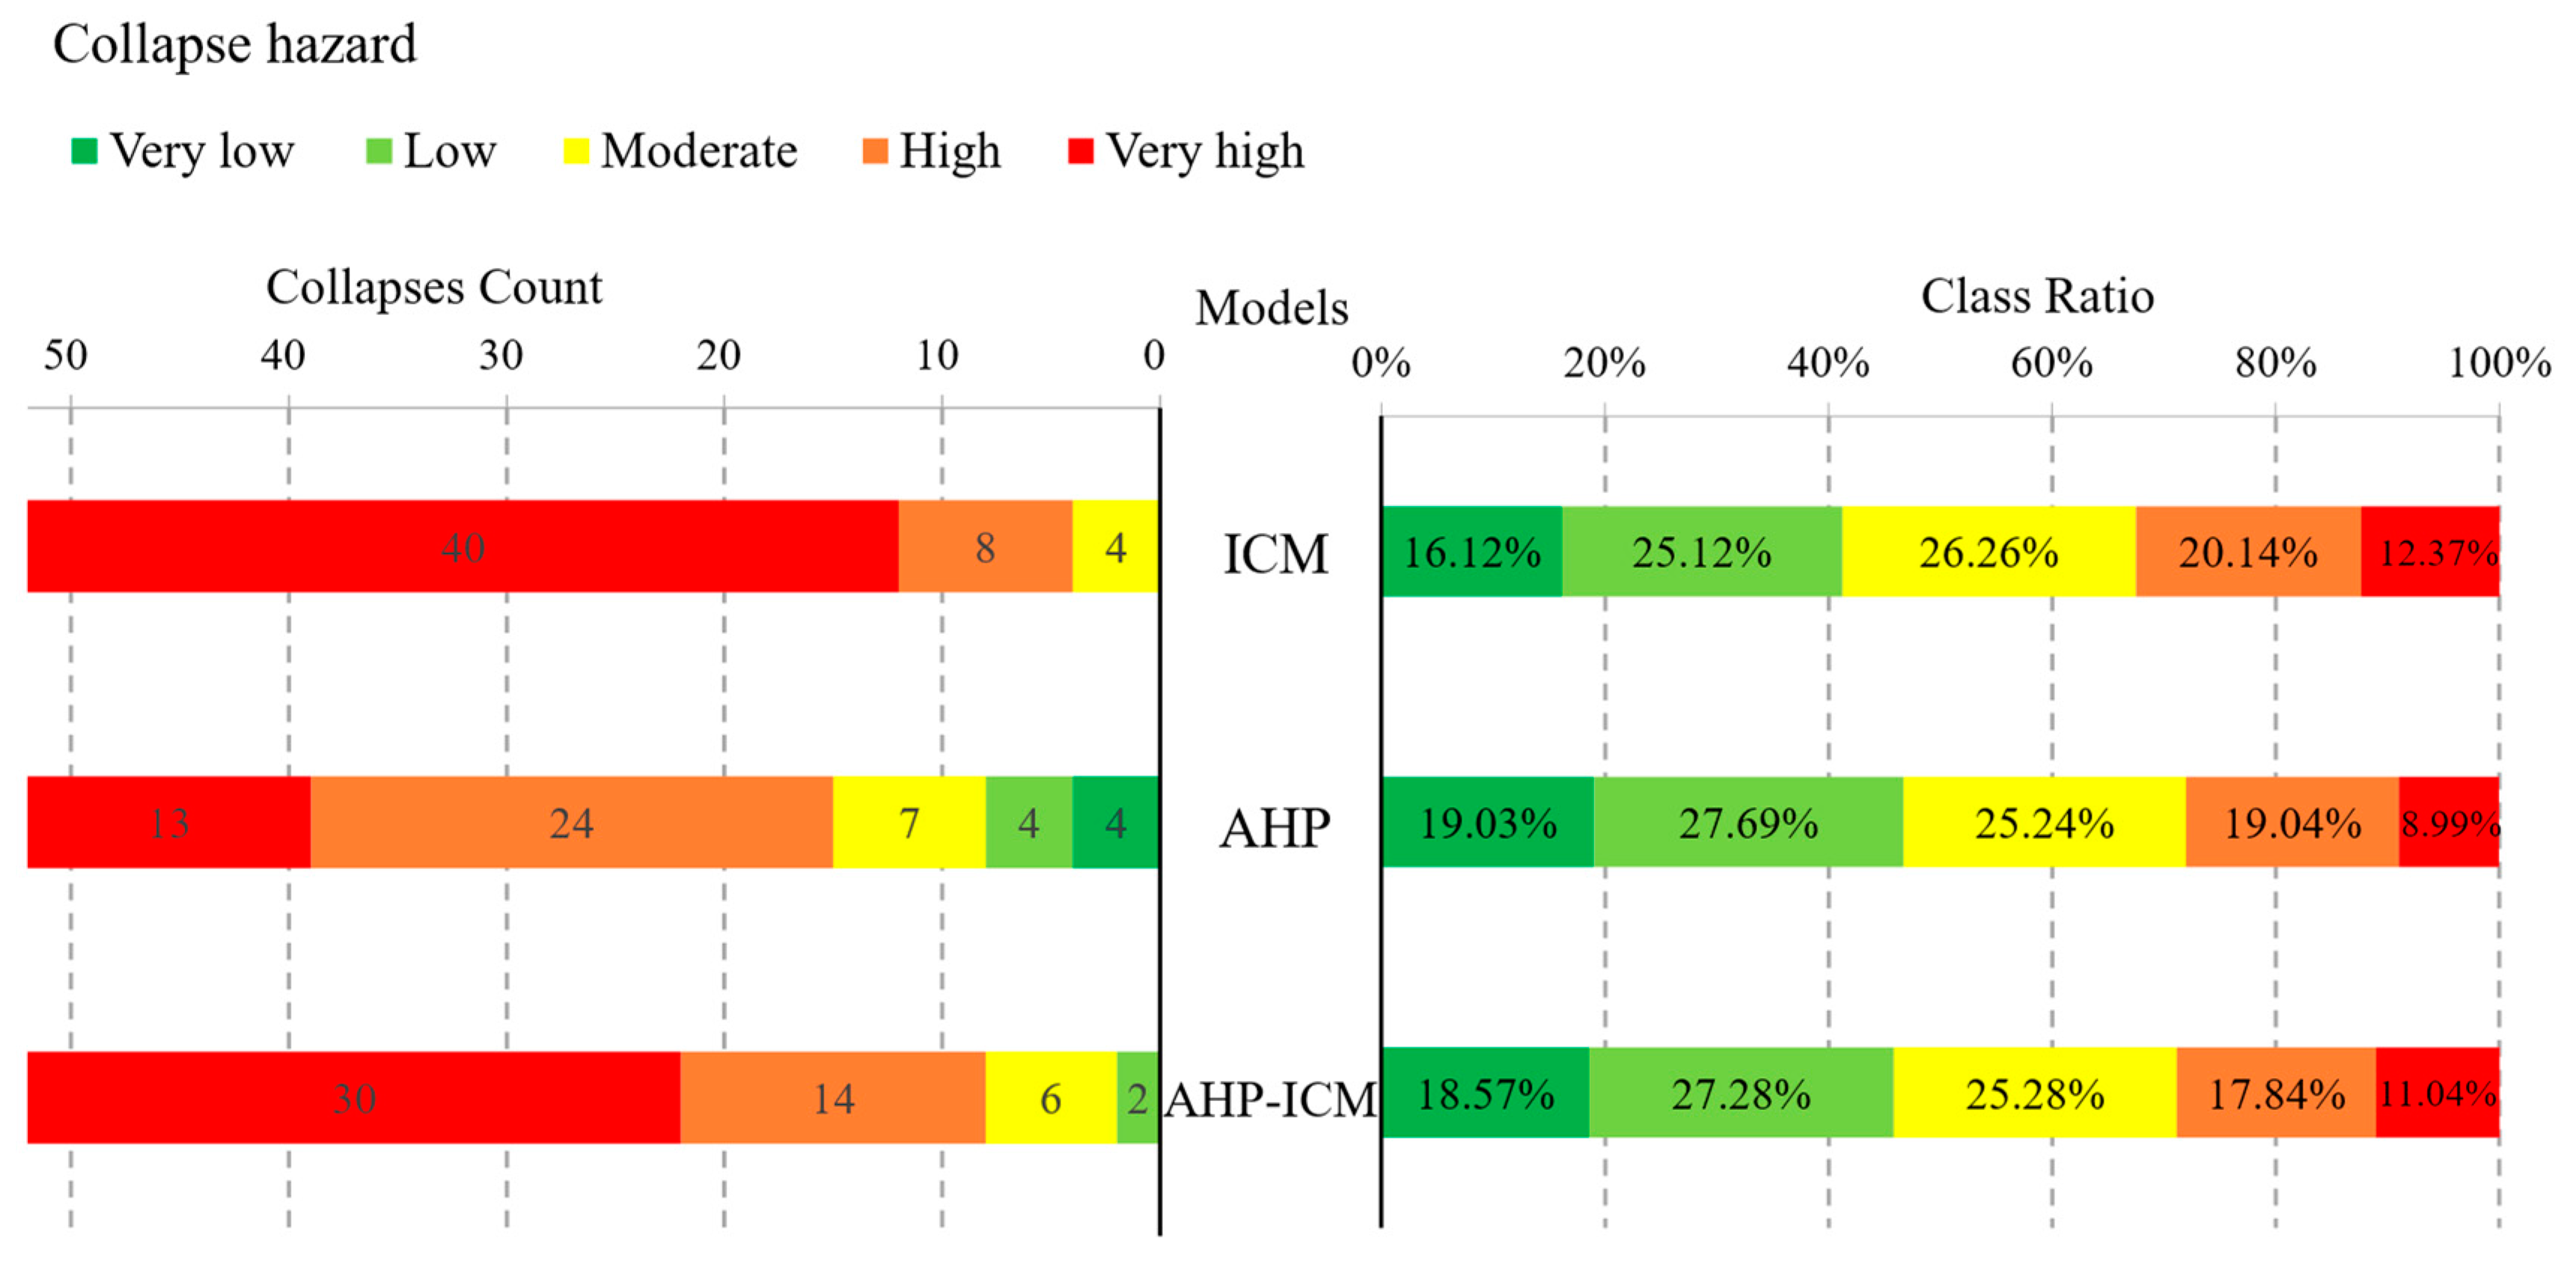
3.3. Comparison of Hazard Map** Models
4. Results of Exposure, Vulnerability, and Emergency Response and Recovery Capability Map**
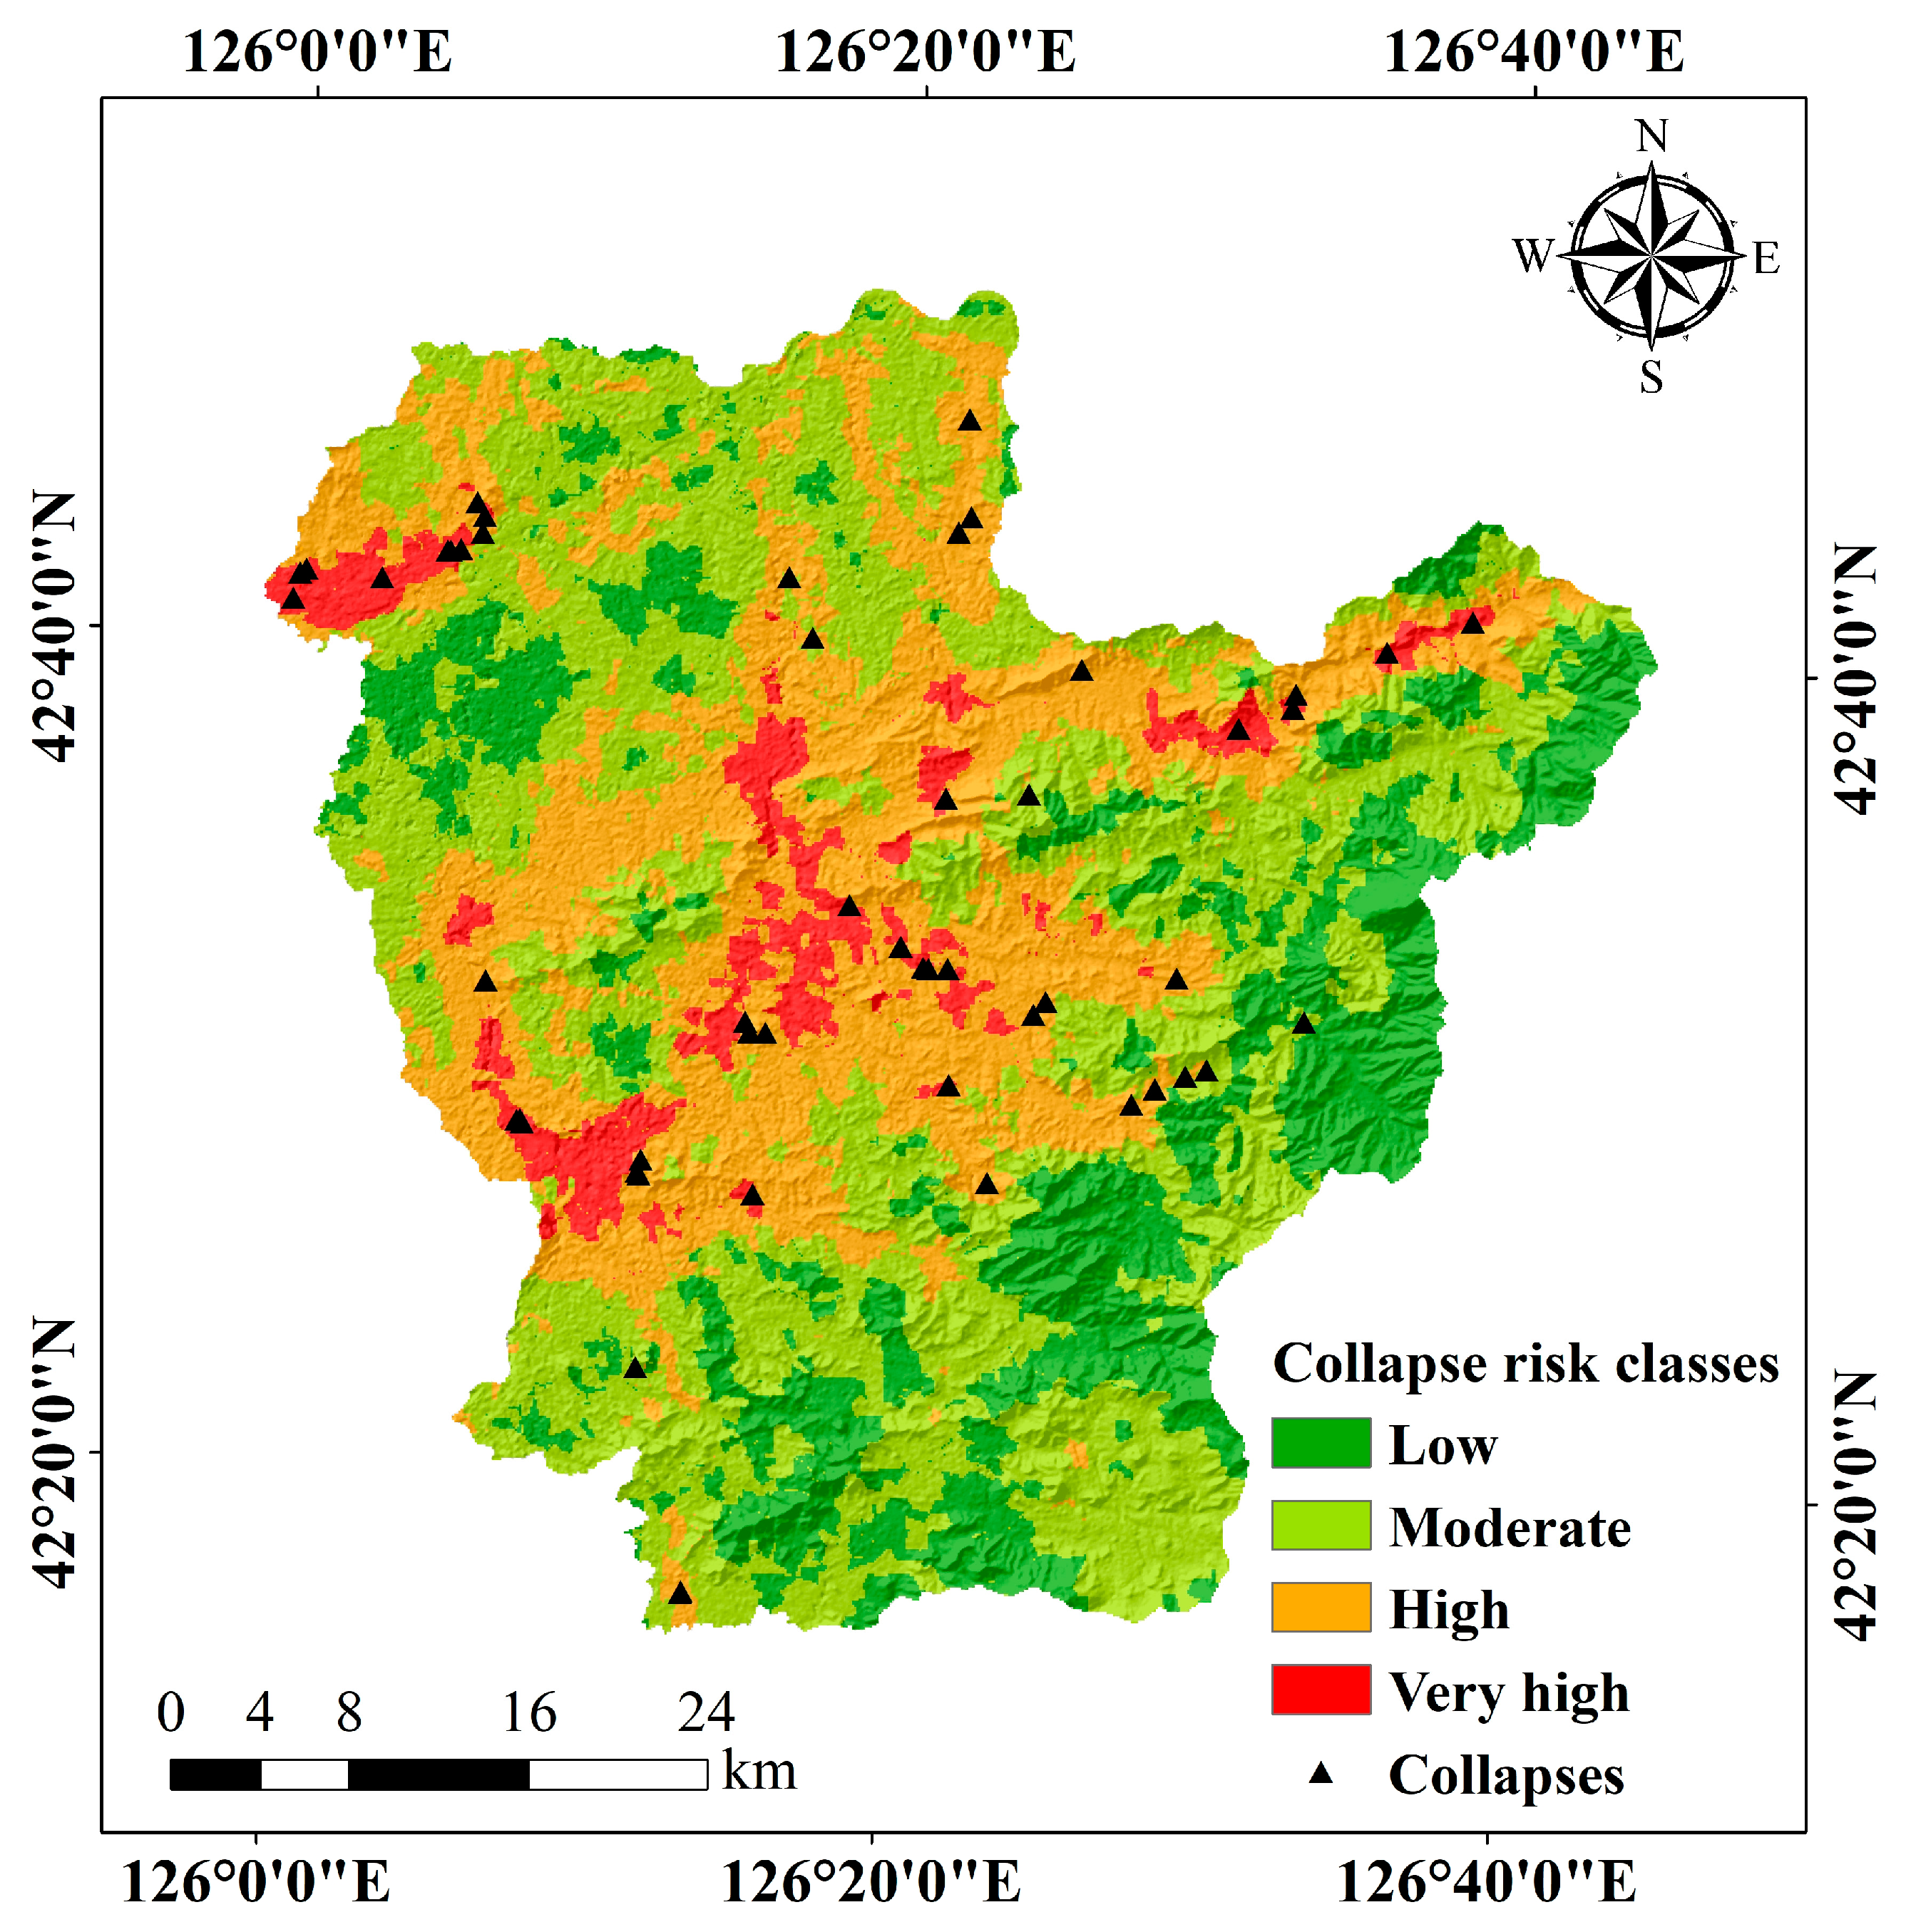
5. Results of Risk Map**
6. Discussion
6.1. Importance and Significance of This Study
6.2. Comprehensive Evaluation of Hazard Map** Model
6.3. Limitations and Perspectives of This Study
7. Conclusions
Author Contributions
Funding
Data Availability Statement
Conflicts of Interest
References
- Xu, Z.H.; Wang, W.Y.; Lin, P.; Wang, X.T.; Yu, T.F. Buffering Effect of Overlying Sand Layer Technology for Dealing with Rockfall Disaster in Tunnels and a Case Study. Int. J. Geomech. 2020, 20, 04020127. [Google Scholar] [CrossRef]
- ** using XGBoost model by hybrid optimized factor screening and hyperparameter. Geocarto Int. 2022, 37, 16872–16899. [Google Scholar] [CrossRef]
- Wang, F.; Xu, P.; Wang, C.; Wang, N.; Jiang, N. Application of a GIS-Based Slope Unit Method for Landslide Susceptibility Map** along the Longzi River, Southeastern Tibetan Plateau, China. ISPRS Int. J. Geo-Inf. 2017, 6, 172. [Google Scholar] [CrossRef]
- Du, G.; Zhang, Y.; Yang, Z.; Guo, C.; Yao, X.; Sun, D. Landslide susceptibility map** in the region of eastern Himalayan syntaxis, Tibetan Plateau, China: A comparison between analytical hierarchy process information value and logistic regression-information value methods. Bull. Eng. Geol. Environ. 2018, 78, 4201–4215. [Google Scholar] [CrossRef]
- Bhagya, S.B.; Sumi, A.S.; Balaji, S.; Danumah, J.H.; Costache, R.; Rajaneesh, A.; Gokul, A.; Chandrasenan, C.P.; Quevedo, R.P.; Johny, A.; et al. Landslide Susceptibility Assessment of a Part of the Western Ghats (India) Employing the AHP and F-AHP Models and Comparison with Existing Susceptibility Maps. Land 2023, 12, 468. [Google Scholar] [CrossRef]
- Zhou, S.; Chen, G.; Fang, L.; Nie, Y. GIS-Based Integration of Subjective and Objective Weighting Methods for Regional Landslides Susceptibility Map**. Sustainability 2016, 8, 334. [Google Scholar] [CrossRef]
- Deng, H.; Wu, X.; Zhang, W.; Liu, Y.; Li, W.; Li, X.; Zhou, P.; Zhuo, W. Slope-Unit Scale Landslide Susceptibility Map** Based on the Random Forest Model in Deep Valley Areas. Remote Sens. 2022, 14, 4245. [Google Scholar] [CrossRef]
- Panchal, S.; Shrivastava, A.K. A Comparative Study of Frequency Ratio, Shannon’s Entropy and Analytic Hierarchy Process (AHP) Models for Landslide Susceptibility Assessment. ISPRS Int. J. Geo-Inf. 2021, 10, 603. [Google Scholar] [CrossRef]
- Ma, Z.; Qin, S.; Cao, C.; Lv, J.; Li, G.; Qiao, S.; Hu, X. The Influence of Different Knowledge-Driven Methods on Landslide Susceptibility Map**: A Case Study in the Changbai Mountain Area, Northeast China. Entropy 2019, 21, 372. [Google Scholar] [CrossRef]
- Sun, X.; Chen, J.; Li, Y.; Rene, N.N. Landslide Susceptibility Map** along a Rapidly Uplifting River Valley of the Upper **sha River, Southeastern Tibetan Plateau, China. Remote Sens. 2022, 14, 1730. [Google Scholar] [CrossRef]
- Lin, L.; Lin, Q.; Wang, Y. Landslide susceptibility map** on a global scale using the method of logistic regression. Nat. Hazards Earth Syst. Sci. 2017, 17, 1411–1424. [Google Scholar] [CrossRef]
- Sun, X.; Yu, C.; Li, Y.; Rene, N.N. Susceptibility Map** of Typical Geological Hazards in Helong City Affected by Volcanic Activity of Changbai Mountain, Northeastern China. ISPRS Int. J. Geo-Inf. 2022, 11, 344. [Google Scholar] [CrossRef]
- Zhang, J.-Q.; Liang, J.-D.; Liu, X.-P.; Tong, Z.-J. GIS-Based Risk Assessment of Ecological Disasters in Jilin Province, Northeast China. Hum. Ecol. Risk Assess. 2009, 15, 727–745. [Google Scholar] [CrossRef]
- Hamza, T.; Raghuvanshi, T.K. GIS based landslide hazard evaluation and zonation—A case from Jeldu District, Central Ethiopia. J. King Saud Univ. Sci. 2017, 29, 151–165. [Google Scholar] [CrossRef]
- Pellicani, R.; Argentiero, I.; Spilotro, G. GIS-based predictive models for regional-scale landslide susceptibility assessment and risk map** along road corridors. Geomat. Nat. Hazards Risk 2017, 8, 1012–1033. [Google Scholar] [CrossRef]
- Pradhan, A.M.S.; Kim, Y.-T. Rainfall-Induced Shallow Landslide Susceptibility Map** at Two Adjacent Catchments Using Advanced Machine Learning Algorithms. ISPRS Int. J. Geo-Inf. 2020, 9, 569. [Google Scholar] [CrossRef]
- Tan, Q.; Huang, Y.; Hu, J.; Zhou, P.; Hu, J. Application of artificial neural network model based on GIS in geological hazard zoning. Neural Comput. Appl. 2020, 33, 591–602. [Google Scholar] [CrossRef]
- Wu, C.; Zhang, Y.; Zhang, J.; Chen, Y.; Duan, C.; Qi, J.; Cheng, Z.; Pan, Z. Comprehensive Evaluation of the Eco-Geological Environment in the Concentrated Mining Area of Mineral Resources. Sustainability 2022, 14, 6808. [Google Scholar] [CrossRef]
- Yuan, X.; Liu, C.; Nie, R.; Yang, Z.; Li, W.; Dai, X.; Cheng, J.; Zhang, J.; Ma, L.; Fu, X.; et al. A Comparative Analysis of Certainty Factor-Based Machine Learning Methods for Collapse and Landslide Susceptibility Map** in Wenchuan County, China. Remote Sens. 2022, 14, 3259. [Google Scholar] [CrossRef]
- Kadavi, P.; Lee, C.-W.; Lee, S. Application of Ensemble-Based Machine Learning Models to Landslide Susceptibility Map**. Remote Sens. 2018, 10, 1252. [Google Scholar] [CrossRef]
- Do, C.; Kuleshov, Y. Multi-Hazard Tropical Cyclone Risk Assessment for Australia. Remote Sens. 2023, 15, 795. [Google Scholar] [CrossRef]
- Ke, K.; Zhang, Y.; Zhang, J.; Chen, Y.; Wu, C.; Nie, Z.; Wu, J. Risk Assessment of Earthquake–Landslide Hazard Chain Based on CF-SVM and Newmark Model—Using Changbai Mountain as an Example. Land 2023, 12, 696. [Google Scholar] [CrossRef]
- Duan, C.; Zhang, J.; Chen, Y.; Lang, Q.; Zhang, Y.; Wu, C.; Zhang, Z. Comprehensive Risk Assessment of Urban Waterlogging Disaster Based on MCDA-GIS Integration: The Case Study of Changchun, China. Remote Sens. 2022, 14, 3101. [Google Scholar] [CrossRef]
- Mwakapesa, D.S.; Lan, X.; Nanehkaran, Y.A.; Mao, Y. Landslide susceptibility map** using O-CURE and PAM clustering algorithms. Front. Environ. Sci. 2023, 11, 271. [Google Scholar] [CrossRef]
- Zhang, T.; Fu, Q.; Quevedo, R.P.; Chen, T.; Luo, D.; Liu, F.; Kong, H. Landslide Susceptibility Map** Using Novel Hybrid Model Based on Different Map** Units. KSCE J. Civ. Eng. 2022, 26, 2888–2900. [Google Scholar] [CrossRef]
- Ba, Q.; Chen, Y.; Deng, S.; Yang, J.; Li, H. A comparison of slope units and grid cells as map** units for landslide susceptibility assessment. Earth Sci. Inf. 2018, 11, 373–388. [Google Scholar] [CrossRef]
- Guzzetti, F.; Carrara, A.; Cardinali, M.; Reichenbach, P. Landslide hazard evaluation: A review of current techniques and their application in a multi-scale study, Central Italy. Geomorphology 1999, 31, 181–216. [Google Scholar] [CrossRef]
- Deng, N.; Li, Y.; Ma, J.; Shahabi, H.; Hashim, M.; de Oliveira, G.; Chaeikar, S.S. A comparative study for landslide susceptibility assessment using machine learning algorithms based on grid unit and slope unit. Front. Environ. Sci. 2022, 10, 1009433. [Google Scholar] [CrossRef]
- Yu, C.; Chen, J. Application of a GIS-Based Slope Unit Method for Landslide Susceptibility Map** in Helong City: Comparative Assessment of ICM, AHP, and RF Model. Symmetry 2020, 12, 1848. [Google Scholar] [CrossRef]
- Hong, H.; Liu, J.; Bui, D.T.; Pradhan, B.; Acharya, T.D.; Pham, B.T.; Zhu, A.X.; Chen, W.; Ahmad, B.B. Landslide susceptibility map** using J48 Decision Tree with AdaBoost, Bagging and Rotation Forest ensembles in the Guangchang area (China). Catena 2018, 163, 399–413. [Google Scholar] [CrossRef]
- He, H.; Hu, D.; Sun, Q.; Zhu, L.; Liu, Y. A Landslide Susceptibility Assessment Method Based on GIS Technology and an AHP-Weighted Information Content Method: A Case Study of Southern Anhui, China. ISPRS Int. J. Geo-Inf. 2019, 8, 266. [Google Scholar] [CrossRef]
- Saaty, T.L. Modeling unstructured decision problems—The theory of analytical hierarchies. Math. Comput. Simul. 1978, 20, 147–158. [Google Scholar] [CrossRef]
- Gao, R.; Wang, C.; Liang, Z.; Han, S.; Li, B. A Research on Susceptibility Map** of Multiple Geological Hazards in Yanzi River Basin, China. ISPRS Int. J. Geo-Inf. 2021, 10, 218. [Google Scholar] [CrossRef]
- Roccati, A.; Paliaga, G.; Luino, F.; Faccini, F.; Turconi, L. GIS-Based Landslide Susceptibility Map** for Land Use Planning and Risk Assessment. Land 2021, 10, 162. [Google Scholar] [CrossRef]
- Cao, C.; Wang, Q.; Chen, J.; Ruan, Y.; Zheng, L.; Song, S.; Niu, C. Landslide Susceptibility Map** in Vertical Distribution Law of Precipitation Area: Case of the Xulong Hydropower Station Reservoir, Southwestern China. Water 2016, 8, 270. [Google Scholar] [CrossRef]
- Li, X. TOPSIS model with entropy weight for eco geological environmental carrying capacity assessment. Microprocess. Microsyst. 2021, 82, 103805. [Google Scholar] [CrossRef]
- Kincal, C.; Kayhan, H. A Combined Method for Preparation of Landslide Susceptibility Map in Izmir (Türkiye). Appl. Sci. 2022, 12, 9029. [Google Scholar] [CrossRef]
- Saha, A.; Villuri, V.G.K.; Bhardwaj, A. Development and Assessment of GIS-Based Landslide Susceptibility Map** Models Using ANN, Fuzzy-AHP, and MCDA in Darjeeling Himalayas, West Bengal, India. Land 2022, 11, 1711. [Google Scholar] [CrossRef]
- Saha, A.; Villuri, V.G.K.; Bhardwaj, A.; Kumar, S. A Multi-Criteria Decision Analysis (MCDA) Approach for Landslide Susceptibility Map** of a Part of Darjeeling District in North-East Himalaya, India. Appl. Sci. 2023, 13, 5062. [Google Scholar] [CrossRef]


| Indicator | TOL | VIF |
|---|---|---|
| Local financial revenue | 0.16 | 6.248 |
| Distance from road | 0.179 | 5.602 |
| Multi-year average precipitation | 0.266 | 3.755 |
| Vegetation type | 0.34 | 2.942 |
| Education investment | 0.351 | 2.849 |
| Slope aspect | 0.369 | 2.707 |
| Lithology | 0.369 | 2.712 |
| Education status | 0.432 | 2.312 |
| Population density | 0.477 | 2.095 |
| Landform type | 0.56 | 1.787 |
| Road density | 0.578 | 1.731 |
| Distance from river | 0.606 | 1.65 |
| Proportion of vulnerable population | 0.627 | 1.595 |
| Housing density | 0.75 | 1.333 |
| GDP | 0.796 | 1.256 |
| Relief agencies’ capacity | 0.8 | 1.251 |
| NDVI | 0.846 | 1.182 |
| Slope angle | 0.898 | 1.114 |
| Distance from fault | 0.906 | 1.104 |
| Mining point density | 0.913 | 1.095 |
| Residential buildings | 0.947 | 1.055 |
| Sl. No. | Indicator | Data Types | Resolution/Year | Data Source |
|---|---|---|---|---|
| Hazard indicators | ||||
| 1 | Lithology | Raster data | 1:50,000 | Report on Geological Disaster Investigation and Map** in Huinan County, Jilin Province |
| 2 | Distance from fault | Vector data | 1:50,000 | Report on Geological Disaster Investigation and Map** in Huinan County, Jilin Province |
| 3 | Slope angle | Raster data | 30 m | https://www.gscloud.cn (accessed on 30 February 2023) |
| 4 | Slope aspect | Raster data | 30 m | https://www.gscloud.cn (accessed on 30 February 2023) |
| 5 | Landform type | Vector data | 1:50,000 | Report on Geological Disaster Investigation and Map** in Huinan County, Jilin Province |
| 6 | Distance from river | Vector data | 1:1,000,000 | https://www.webmap.cn/ (accessed on 9 March 2023) |
| 7 | Multi-year average annual precipitation | Raster data | 1 km | https://www.resdc.cn/ (accessed on 15 March 2023) |
| 8 | Vegetation type | Vector data | 1:1,000,000 | https://www.databox.store (accessed on 11 February 2023) |
| 9 | NDVI | Raster data | 30 m | Landsat 8 OIL_TIRS |
| 10 | Distance from road | Vector data | 1:1,000,000 | https://www.webmap.cn/ (accessed on 9 March 2023) |
| 11 | Mining point density | Vector data | 1:50,000 | Report on Geological Disaster Investigation and Map** in Huinan County, Jilin Province |
| Exposure indicators | ||||
| 1 | Population density | Raster data | 100 m | https://www.worldpop.org/ (accessed on 14 February 2023) |
| 2 | Housing density | Vector data | 1:50,000 | Report on Geological Disaster Investigation and Map** in Huinan County, Jilin Province |
| 3 | Road density | Vector data | 1:50,000 | Report on Geological Disaster Investigation and Map** in Huinan County, Jilin Province |
| 4 | GDP | Raster data | 1 km | http://www.geodata.cn/ (accessed on 16 March 2023) |
| Vulnerability indicators | ||||
| 1 | Proportion of vulnerable population | Raster data | 100 m | https://www.worldpop.org/ (accessed on 14 February 2023) |
| 2 | Education status | Attribute data | 2015–2019 | Tonghua Statistical Yearbook |
| 3 | Residential buildings | Vector data | 1:50,000 | Report on Geological Disaster Investigation and Map** in Huinan County, Jilin Province |
| Emergency response and recovery capability indicators | ||||
| 1 | Education investment | Attribute data | 2015–2019 | Tonghua Statistical Yearbook |
| 2 | Local financial revenue | Attribute data | 2015–2019 | Tonghua Statistical Yearbook |
| 3 | Relief agencies’ capacity | Attribute data | 2015–2019 | Tonghua Statistical Yearbook |
| Indicator | Class | Collapse Count | Total Count | ICM |
|---|---|---|---|---|
| Slope angle | 0–5 | 5 | 32,898 | −0.4099 |
| 5–10 | 12 | 68,537 | −0.2682 | |
| 10–15 | 20 | 51,643 | 0.5256 | |
| 15–20 | 12 | 38,386 | 0.3115 | |
| >20 | 3 | 35,653 | −1.0010 | |
| Slope aspect | North | 0 | 1296 | 0.0000 |
| Northeast | 1 | 12,326 | −1.0375 | |
| East | 2 | 25,050 | −1.0535 | |
| Southeast | 14 | 48,,583 | 0.2300 | |
| South | 12 | 51519 | 0.0172 | |
| Southwest | 19 | 46,038 | 0.5892 | |
| West | 3 | 30,587 | −0.8477 | |
| Northwest | 1 | 11,718 | −0.9869 | |
| Multi-year average precipitation | <720 | 5 | 39,165 | −0.5841 |
| 720–730 | 11 | 35,490 | 0.3029 | |
| 730–740 | 21 | 44,830 | 0.7159 | |
| 740–750 | 10 | 48,315 | −0.1009 | |
| >750 | 5 | 59,321 | −0.9993 | |
| Lithology | Q | 6 | 62,666 | −0.8718 |
| γ | 11 | 10,226 | 1.5472 | |
| K + J | 3 | 12,000 | 0.0879 | |
| Ar | 10 | 90,418 | −0.7276 | |
| Q + Z | 2 | 10,027 | −0.1379 | |
| β | 5 | 23,725 | −0.0829 | |
| ∈ + O + Z | 15 | 18,059 | 1.2886 | |
| Distance from fault | 0–500 | 18 | 56,250 | 0.3348 |
| 500–1000 | 10 | 27,686 | 0.4559 | |
| 1000–2000 | 7 | 44,551 | −0.3765 | |
| 2000–3000 | 11 | 28,746 | 0.5136 | |
| >3000 | 6 | 69,888 | −0.9809 | |
| Landform type | Fluvial terrace | 6 | 34,499 | −0.2749 |
| Undulating terrace | 5 | 30,078 | −0.3201 | |
| Denudation of eroded hill | 9 | 23,872 | 0.4988 | |
| Tectonic low hill | 22 | 49,696 | 0.6594 | |
| Tectonic moderate hill | 6 | 61,991 | −0.8610 | |
| Lava low terrace | 2 | 10,751 | −0.2076 | |
| Lava plateau | 2 | 16,234 | −0.6197 | |
| Distance from river | 0–100 | 32 | 33,744 | 1.4212 |
| 100–300 | 3 | 10,748 | 0.1981 | |
| 300–600 | 7 | 17,049 | 0.5841 | |
| 600–1000 | 6 | 19,992 | 0.2707 | |
| >1000 | 4 | 145,588 | −2.1202 | |
| Distance from road | 0–100 | 33 | 44,349 | 1.1787 |
| 100–300 | 3 | 15,005 | −0.1355 | |
| 300–600 | 4 | 19,397 | −0.1046 | |
| 600–1200 | 7 | 33,720 | −0.0979 | |
| >1200 | 5 | 114,650 | −1.6582 | |
| Vegetation type | Hemerophyte | 18 | 42,454 | 0.6162 |
| Broadleaf forest | 15 | 69,491 | −0.0589 | |
| Meadow | 7 | 21,029 | 0.3742 | |
| Mixed forest | 12 | 94,147 | −0.5857 | |
| NDVI | 0–0.3 | 20 | 32,809 | 0.9793 |
| 0.3–0.55 | 4 | 24,824 | −0.3513 | |
| 0.55–0.65 | 21 | 50,226 | 0.6022 | |
| 0.65–0.75 | 4 | 38,058 | −0.7786 | |
| 0.75–1 | 3 | 81,204 | −1.8241 | |
| Mining point density | 0–5 | 14 | 104,598 | −0.5369 |
| 5–9 | 15 | 66,194 | −0.0103 | |
| 9–13 | 14 | 35,987 | 0.5301 | |
| 13–21 | 7 | 14,501 | 0.7459 | |
| 21–31 | 2 | 5830 | 0.4044 | |
| Total area | 52 | 227,121 |
| Target Layer (A) | Criterion Layer (B) | A–B Judgement Matrix | A–B Weight | Indicator Layer (C) | B–C Judgement Matrix | B–C Weight | A–C Weight (Wi) | |||||
|---|---|---|---|---|---|---|---|---|---|---|---|---|
| Collapse hazard (1.0000) | Geography | 1 | 1/3 | 1/7 | 0.081 | Slope angle | 1 | 3 | 3 | 1/2 | 0.2947 | 0.0239 |
| Slope aspect | 1/3 | 1 | 1/3 | 1/5 | 0.0781 | 0.0063 | ||||||
| Vegetation type | 1/3 | 3 | 1 | 1/3 | 0.1537 | 0.0124 | ||||||
| NDVI | 2 | 5 | 3 | 1 | 0.1537 | 0.0383 | ||||||
| Geology | 3 | 1 | 1/5 | 0.1884 | Lithology | 1 | 3 | 3 | 0.5936 | 0.1118 | ||
| Distance from fault | 1/3 | 1 | 1/2 | 0.1571 | 0.0296 | |||||||
| Landform type | 1/3 | 2 | 1 | 0.2493 | 0.047 | |||||||
| Disaster-causing factors | 7 | 5 | 1 | 0.7306 | Multi-year average precipitation | 1 | 5 | 3 | 7 | 0.5638 | 0.4119 | |
| Distance from river | 1/5 | 1 | 1/3 | 3 | 0.1178 | 0.0861 | ||||||
| Distance from road | 1/3 | 3 | 1 | 5 | 0.2634 | 0.1924 | ||||||
| Mining point density | 1/7 | 1/3 | 0.2 | 1 | 0.0550 | 0.0402 | ||||||
| Indicator | Class | Judgement Matrix | Weight (Wij) | |||||||
|---|---|---|---|---|---|---|---|---|---|---|
| Slope angle | 0–5 | 1 | 1/3 | 1/3 | 1/4 | 1/3 | 0.06386 | |||
| 5–10 | 3 | 1 | 1/3 | 1/3 | 1/3 | 0.10497 | ||||
| 10–15 | 3 | 3 | 1 | 1/3 | 3 | 0.25278 | ||||
| 15–20 | 4 | 3 | 3 | 1 | 3 | 0.41551 | ||||
| >20 | 3 | 3 | 1/3 | 1/3 | 1 | 0.16289 | ||||
| Slope aspect | North | 1 | 1 | 1/5 | 1/7 | 1/8 | 1/9 | 1/3 | 1/2 | 0.02632 |
| Northeast | 1 | 1 | 1/3 | 1/5 | 1/7 | 1/6 | 1/2 | 1 | 0.03591 | |
| East | 5 | 3 | 1 | 1/3 | 1/4 | 1/4 | 2 | 2 | 0.09014 | |
| Southeast | 7 | 5 | 3 | 1 | 1/2 | 2 | 4 | 4 | 0.22180 | |
| South | 8 | 7 | 4 | 2 | 1 | 3 | 5 | 7 | 0.33640 | |
| Southwest | 9 | 6 | 4 | 1/2 | 1/3 | 1 | 2 | 3 | 0.17164 | |
| West | 3 | 2 | 1/2 | 1/4 | 1/5 | 1/2 | 1 | 4 | 0.07541 | |
| Northwest | 2 | 1 | 1/2 | 1/4 | 1/7 | 1/3 | 1/4 | 1 | 0.04237 | |
| Vegetation type | Hemerophyte | 1 | 4 | 1/2 | 5 | 0.37499 | ||||
| Broadleaf forest | 1/4 | 1 | 1/2 | 1 | 0.12538 | |||||
| Meadow | 2 | 2 | 1 | 3 | 0.39248 | |||||
| Mixed forest | 1/5 | 1 | 1/3 | 1 | 0.10715 | |||||
| NDVI | 0–0.3 | 1 | 1 | 1/3 | 1/3 | 1/4 | 0.08391 | |||
| 0.55–0.65 | 1 | 1 | 1/3 | 1/2 | 2 | 0.13792 | ||||
| 0.3–0.55 | 3 | 3 | 1 | 1 | 4 | 0.35182 | ||||
| 0.65–0.75 | 3 | 2 | 1 | 1 | 3 | 0.30628 | ||||
| 0.75–1 | 4 | 1/2 | 1/4 | 1/3 | 1 | 0.12007 | ||||
| Lithology | Q | 1 | 1/2 | 4 | 1 | 2 | 3 | 1/5 | 0.12901 | |
| γ | 2 | 1 | 7 | 1 | 3 | 4 | 1/2 | 0.21439 | ||
| K + J | 1/4 | 1/7 | 1 | 1/3 | 1/2 | 3 | 1/5 | 0.05090 | ||
| Ar | 1 | 1 | 3 | 1 | 2 | 4 | 1/4 | 0.14705 | ||
| Q + Z | 1/2 | 1/3 | 2 | 1/2 | 1 | 2 | 1/3 | 0.08317 | ||
| β | 1/3 | 1/4 | 1/3 | 1/4 | 1/2 | 1 | 1/3 | 0.04333 | ||
| ∈ + O + Z | 5 | 2 | 5 | 4 | 3 | 3 | 1 | 0.33215 | ||
| Distance from fault | 0–500 | 1 | 3 | 1/2 | 1/2 | 2 | 0.19789 | |||
| 500–1000 | 1/3 | 1 | 1/3 | 1/2 | 1/2 | 0.08911 | ||||
| 1000–2000 | 2 | 3 | 1 | 2 | 2 | 0.34454 | ||||
| 2000–3000 | 2 | 2 | 1/2 | 1 | 1 | 0.20961 | ||||
| >3000 | 1/2 | 2 | 1/2 | 1 | 1 | 0.15885 | ||||
| Landform type | Fluvial terrace | 1 | 1/3 | 1/5 | 1/4 | 1/2 | 3 | 4 | 0.08124 | |
| Undulating terrace | 3 | 1 | 1/2 | 1 | 2 | 4 | 3 | 0.18835 | ||
| Denudation of eroded hill | 5 | 2 | 1 | 3 | 5 | 4 | 4 | 0.34318 | ||
| Tectonic low hill | 4 | 1 | 1/3 | 1 | 3 | 2 | 5 | 0.19120 | ||
| Tectonic moderate hill | 2 | 1/2 | 1/5 | 1/3 | 1 | 3 | 2 | 0.09903 | ||
| Lava low terrace | 1/3 | 1/4 | 1/4 | 1/2 | 1/3 | 1 | 1 | 0.05027 | ||
| Lava plateau | 1/4 | 1/3 | 1/4 | 1/5 | 1/2 | 1 | 1 | 0.04673 | ||
| Multi-year average precipitation | <720 | 1 | 3 | 4 | 3 | 4 | 0.44926 | |||
| 720–730 | 1/3 | 1 | 2 | 1 | 1/2 | 0.13347 | ||||
| 730–740 | 1/4 | 1/2 | 1 | 1/2 | 1/3 | 0.07666 | ||||
| 740–750 | 1/3 | 1 | 2 | 1 | 1/2 | 0.13347 | ||||
| >750 | 1/4 | 2 | 3 | 2 | 1 | 0.20713 | ||||
| Distance from river | 0–100 | 1 | 3 | 2 | 2 | 4 | 0.37497 | |||
| 100–300 | 1/3 | 1 | 1/2 | 1/2 | 2 | 0.12081 | ||||
| 300–600 | 1/2 | 2 | 1 | 1 | 3 | 0.21536 | ||||
| 600–1000 | 1/2 | 2 | 1 | 1 | 3 | 0.21536 | ||||
| >1000 | 1/4 | 1/2 | 1/3 | 1/3 | 1 | 0.07350 | ||||
| Distance from road | 0–100 | 1 | 3 | 2 | 1/2 | 4 | 0.28286 | |||
| 100–300 | 1/3 | 1 | 1/2 | 1/4 | 2 | 0.10469 | ||||
| 300–600 | 1/2 | 2 | 1 | 1 | 3 | 0.21437 | ||||
| 600–1200 | 2 | 4 | 1 | 1 | 3 | 0.32492 | ||||
| >1200 | 1/4 | 1/2 | 1/3 | 1/3 | 1 | 0.07316 | ||||
| Mining point density | 0–5 | 1 | 3 | 2 | 3 | 0.5 | 0.27758 | |||
| 5–9 | 1/3 | 1 | 1/2 | 1/2 | 1/2 | 0.09473 | ||||
| 9–13 | 1/2 | 2 | 1 | 1/3 | 1/2 | 0.12500 | ||||
| 13–21 | 1/3 | 2 | 3 | 1 | 1/3 | 0.16494 | ||||
| 21–31 | 2 | 2 | 2 | 3 | 1 | 0.33774 | ||||
| Indicator | Class | CI | Indicator | Class | CI |
|---|---|---|---|---|---|
| Slope angle | 0–5 | −0.00980 | Distance from river | 0–100 | 0.12236 |
| 5–10 | −0.00641 | 100–300 | 0.01706 | ||
| 10–15 | 0.01256 | 300–600 | 0.05029 | ||
| 15–20 | 0.00744 | 600–1000 | 0.02330 | ||
| >20 | −0.02392 | >1000 | −0.18255 | ||
| Slope aspect | North | 0.00000 | Distance from road | 0–100 | −0.31904 |
| Northeast | −0.00654 | 100–300 | −0.01884 | ||
| East | −0.00664 | 300–600 | −0.02012 | ||
| Southeast | 0.00145 | 600–1200 | −0.02608 | ||
| South | 0.00011 | >1200 | 0.22677 | ||
| Southwest | 0.00371 | Vegetation type | Hemerophyte | 0.00764 | |
| West | −0.00534 | Broadleaf forest | −0.00073 | ||
| Northwest | −0.00628 | Meadow | 0.00464 | ||
| Multi-year average precipitation | <720 | −0.24059 | Mixed forest | −0.00726 | |
| 720–730 | 0.12476 | NDVI | 0–0.3 | 0.03751 | |
| 730–740 | 0.29487 | 0.3–0.55 | 0.02307 | ||
| 740–750 | −0.04157 | 0.55–0.65 | −0.01345 | ||
| >750 | −0.41161 | 0.65–0.75 | −0.02982 | ||
| Lithology | Q | −0.09747 | 0.75–1 | −0.06986 | |
| γ | 0.17298 | Mining point density | 0–5 | −0.02159 | |
| K + J | 0.00983 | 5–9 | −0.00041 | ||
| Ar | −0.08135 | 9–13 | 0.02131 | ||
| Q + Z | −0.01542 | 13–21 | 0.02999 | ||
| β | −0.00926 | 21–31 | 0.01626 | ||
| ∈ + O + Z | 0.14407 | Distance from fault Distance from fault | 0–500 | 0.00991 | |
| Landform type | Fluvial terrace | −0.01292 | 500–1000 | 0.01350 | |
| Undulating terrace | −0.01505 | 1000–2000 | −0.01114 | ||
| Denudation of eroded hill | 0.02344 | 2000–3000 | 0.01520 | ||
| Tectonic low hill | 0.03099 | >3000 | −0.02904 | ||
| Tectonic moderate hill | −0.04047 | 0–500 | 0.00991 | ||
| Lava low terrace | −0.00976 | ||||
| Lava plateau | −0.02913 |
Disclaimer/Publisher’s Note: The statements, opinions and data contained in all publications are solely those of the individual author(s) and contributor(s) and not of MDPI and/or the editor(s). MDPI and/or the editor(s) disclaim responsibility for any injury to people or property resulting from any ideas, methods, instructions or products referred to in the content. |
© 2023 by the authors. Licensee MDPI, Basel, Switzerland. This article is an open access article distributed under the terms and conditions of the Creative Commons Attribution (CC BY) license (https://creativecommons.org/licenses/by/4.0/).
Share and Cite
Lu, Z.; Yu, C.; Liu, H.; Zhang, J.; Zhang, Y.; Wang, J.; Chen, Y. Application of AHP-ICM and AHP-EWM in Collapse Disaster Risk Map** in Huinan County. ISPRS Int. J. Geo-Inf. 2023, 12, 395. https://doi.org/10.3390/ijgi12100395
Lu Z, Yu C, Liu H, Zhang J, Zhang Y, Wang J, Chen Y. Application of AHP-ICM and AHP-EWM in Collapse Disaster Risk Map** in Huinan County. ISPRS International Journal of Geo-Information. 2023; 12(10):395. https://doi.org/10.3390/ijgi12100395
Chicago/Turabian StyleLu, Zengkang, Chenglong Yu, Huanan Liu, Jiquan Zhang, Yichen Zhang, Jie Wang, and Yanan Chen. 2023. "Application of AHP-ICM and AHP-EWM in Collapse Disaster Risk Map** in Huinan County" ISPRS International Journal of Geo-Information 12, no. 10: 395. https://doi.org/10.3390/ijgi12100395