Article

Comparative Transcriptomic Analysis of Gossypium hirsutum Fiber Development in Mutant Materials (xin w 139) Provides New Insights into Cotton Fiber Development

1
Research Institute of Economic Crops, **njiang Academy of Agricultural Sciences, Urumqi 830091, China
2
Engineering Research Centre of Cotton, Ministry of Education/College of Agriculture, **njiang Agricultural University, 311 Nongda East Road, Urumqi 830052, China
*
Authors to whom correspondence should be addressed.
These authors contributed equally to this work.
Plants 2024, 13(8), 1127; https://doi.org/10.3390/plants13081127
Submission received: 28 February 2024 / Revised: 2 April 2024 / Accepted: 13 April 2024 / Published: 17 April 2024
(This article belongs to the Special Issue Advances in Cotton Genomics, Genetics and Breeding)

Abstract

:
Cotton is the most widely planted fiber crop in the world, and improving cotton fiber quality has long been a research hotspot. The development of cotton fibers is a complex process that includes four consecutive and overlap** stages, and although many studies on cotton fiber development have been reported, most of the studies have been based on cultivars that are promoted in production or based on lines that are used in breeding. Here, we report a phenotypic evaluation of Gossypium hirsutum based on immature fiber mutant (xin w 139) and wild-type (**n W 139) lines and a comparative transcriptomic study at seven time points during fiber development. The results of the two-year study showed that the fiber length, fiber strength, single-boll weight and lint percentage of xin w 139 were significantly lower than those of **n W 139, and there were no significant differences in the other traits. Principal component analysis (PCA) and cluster analysis of the RNA-sequencing (RNA-seq) data revealed that these seven time points could be clearly divided into three different groups corresponding to the initiation, elongation and secondary cell wall (SCW) synthesis stages of fiber development, and the differences in fiber development between the two lines were mainly due to developmental differences after twenty days post anthesis (DPA). Differential expression analysis revealed a total of 5131 unique differentially expressed genes (DEGs), including 290 transcription factors (TFs), between the 2 lines. These DEGs were divided into five clusters. Each cluster functional category was annotated based on the KEGG database, and different clusters could describe different stages of fiber development. In addition, we constructed a gene regulatory network by weighted correlation network analysis (WGCNA) and identified 15 key genes that determined the differences in fiber development between the 2 lines. We also screened seven candidate genes related to cotton fiber development through comparative sequence analysis and qRT–PCR; these genes included three TFs (GH_A08G1821 (bHLH), GH_D05G3074 (Dof), and GH_D13G0161 (C3H)). These results provide a theoretical basis for obtaining an in-depth understanding of the molecular mechanism of cotton fiber development and provide new genetic resources for cotton fiber research.

1. Introduction

Cotton is a highly significant fiber crop that is extensively cultivated worldwide. Over the years, there has been a strong focus on enhancing the quality of cotton fibers, which has emerged as a prominent area of research. Cotton breeders have been actively engaged in develo** and cultivating germplasm resources that not only yield high quantities but also possess exceptional fiber quality [1,
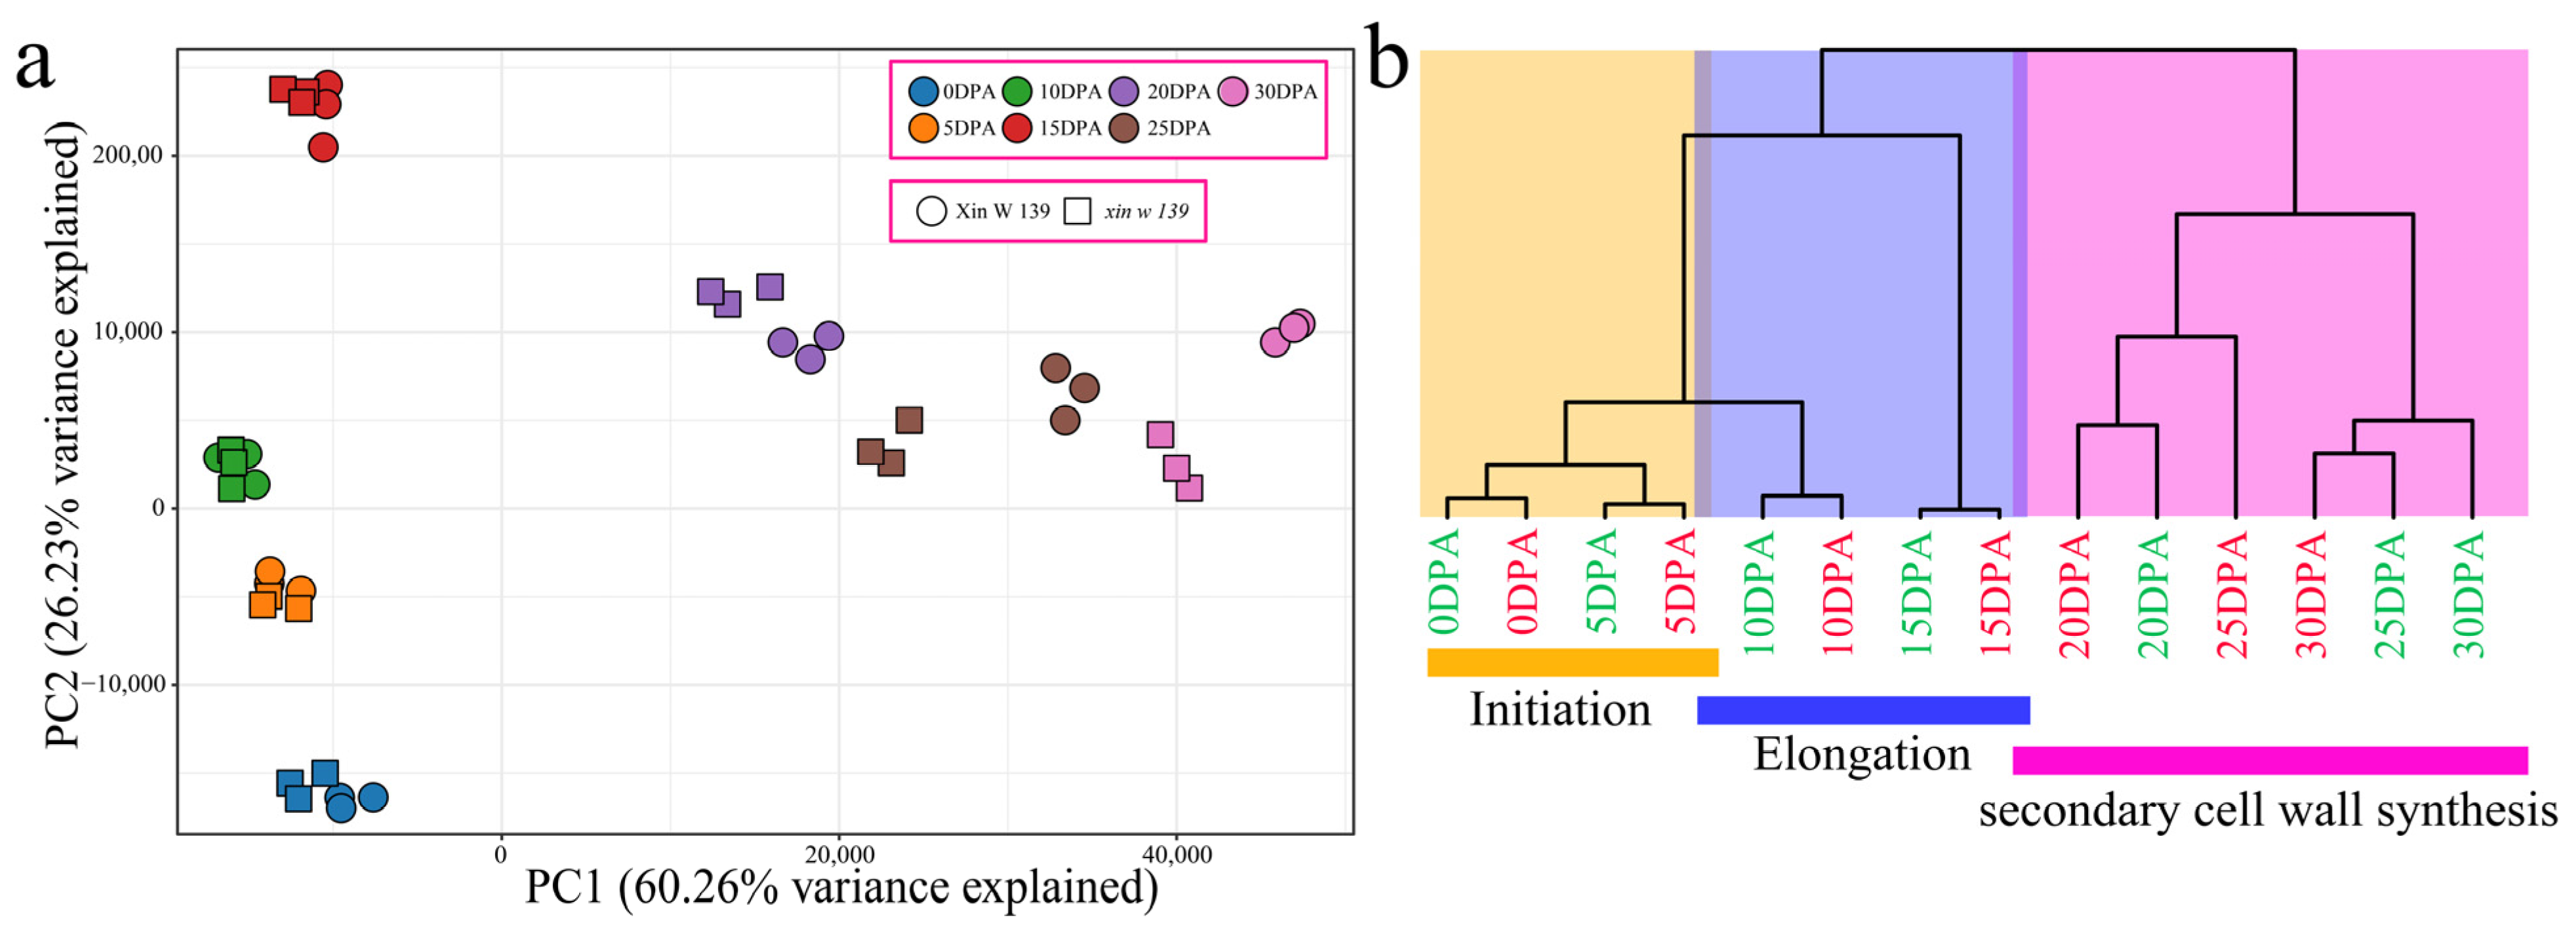
2]. Cotton fiber development is a complex process that occurs in four consecutive and overlap** stages. These stages include fiber initiation, elongation, thickening of the secondary cell wall, and maturation. Fiber initiation occurs from three days before flowering to three days post anthesis (DPA). Elongation occurs from 3 to 16 DPA. During this period, the cotton fibers undergo significant elongation as they grow in length. The secondary cell wall (SCW) stage typically spans from 16 to 40 DPA. During this phase, the cotton fibers undergo SCW deposition, resulting in increased fiber diameter and strength. The thickening of the SCW is an important process in enhancing the overall quality and strength of cotton fibers. The final stage of cotton fiber development is maturation, which occurs from 40 to 50 DPA [3]. The number of fibroblast-differentiated protrusions affects the number of mature fibers to a certain extent, and the progression of rapid elongation through primary wall synthesis determines the length of the mature fibers. Cellulose is deposited in the SCW, and the cell wall is thickened during the thickening period of the SCW stage [4,5,6]. Scientists are working to elucidate the key regulatory mechanisms involved in fiber development, including fibroblast differentiation, cell wall synthesis, and cellulose biosynthesis [7,8,9]. Cotton fibers develop from ovule epidermal cells, and improving cotton fiber quality has long been a research hotspot. The creation and breeding of germplasm resources with high yields and excellent fiber quality has also become a long-term research direction and goal for cotton breeders [1,2]. Studying the regulatory mechanism of cotton fiber cell elongation and secondary wall development is highly important for improving the cotton yield and fiber quality.
In recent years, there has been significant progress in sequencing technologies, leading to their widespread use and continuous optimization. This has resulted in a growing body of evidence highlighting the crucial role of RNA transcriptional regulation in plant growth and development [10]. Transcriptome sequencing (RNA-seq), one of the most commonly used second-generation high-throughput sequencing methods, has been widely used in the study of cotton fibers [11,12]. Through transcriptomics, many key regulatory pathways and gene expression patterns associated with fiber development have been revealed [13,14,15]. These findings have helped identify the key genes that control fiber development and have provided important insights for improving cotton fibers. Through RNA-seq of 0–35 DPA fibers of PimaS-7 and 5917, 4 candidate genes related to fiber strength were identified [16]. RNA-seq analysis at different stages of fiber development (7, 14, and 26 DPA) in the Coker 312 cotton variety allowed the identification of transcription factors and functional genes associated with this process. These genes encode proteins involved in various functional and metabolic pathways, including those involved in catalytic activity, carbohydrate metabolism, cell membrane and organelle functions, and signal transduction [17]. Analysis of the RNA-seq data at 10 and 20 DPA from fibers from 4 wild cotton species and 5 domesticated cotton species showed that wild cotton plants allocate more resources to the stress response pathway and that acclimation may lead to a reprogramming of resource allocation in the direction of increasing fiber growth via regulation of the stress response network [18]. Through RNA-seq analysis of the offspring of the ** stages. Most related studies have been based on cultivars that are promoted in production or based on lines that are used in breeding; especially, there are few reports on natural mutants [25,26,
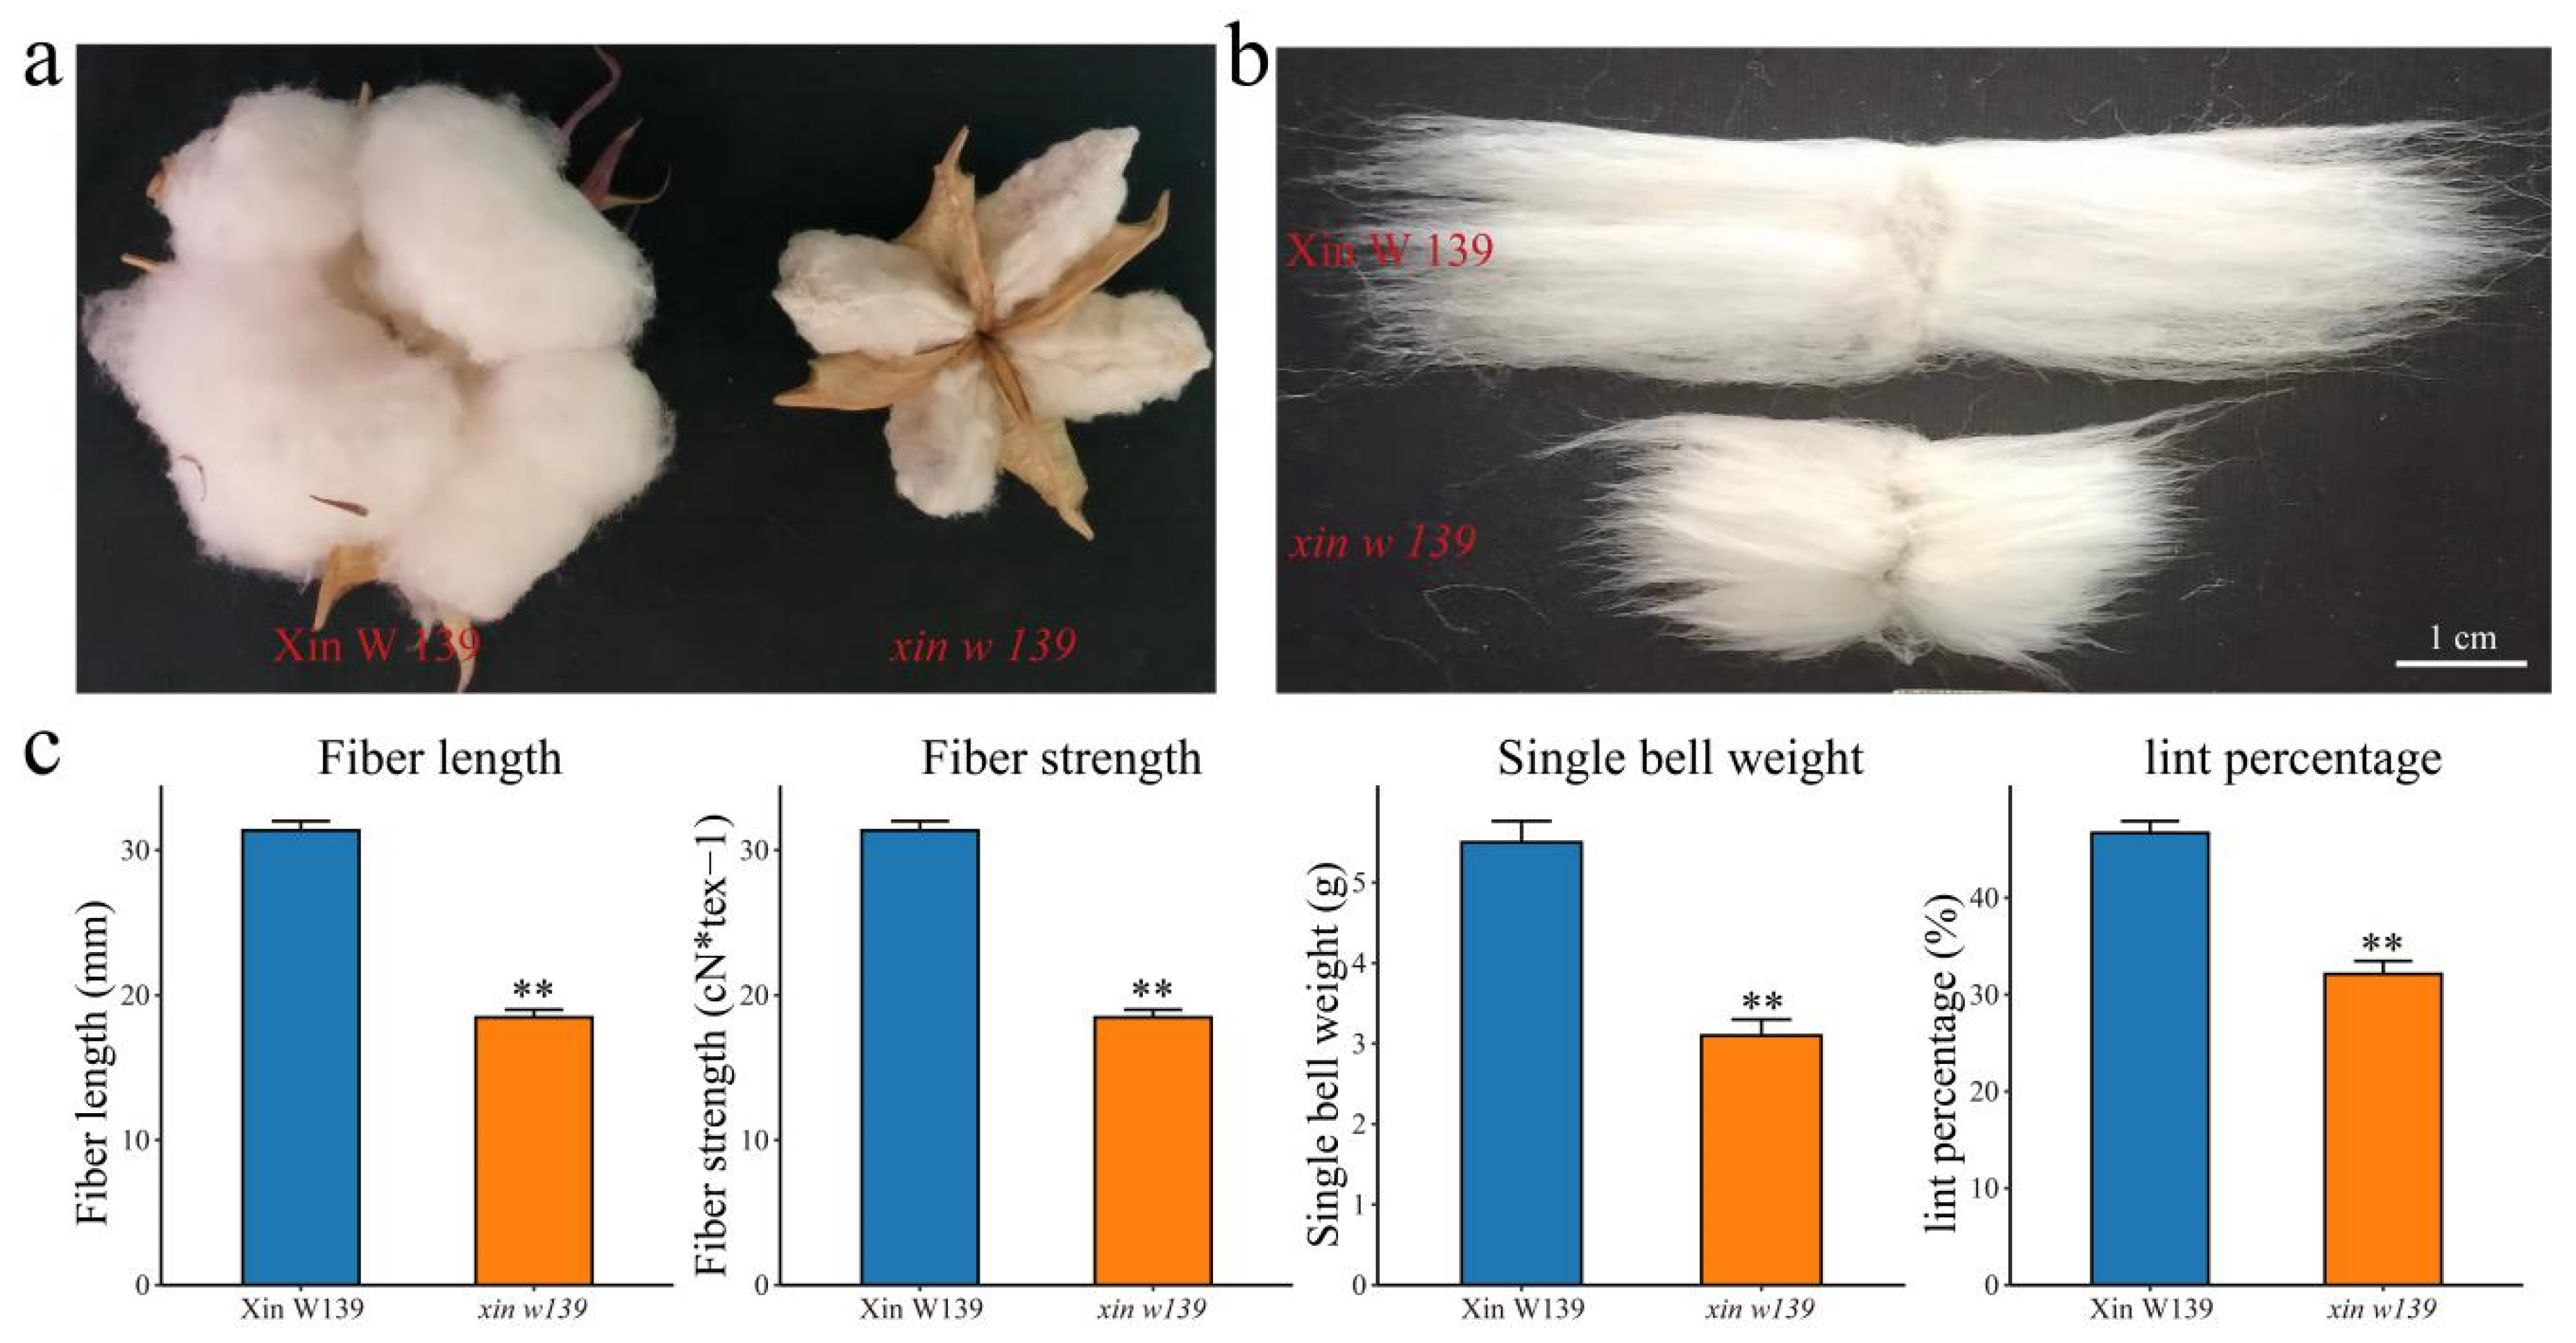
27]. Here, we performed phenotypic evaluation and comparative transcriptomic studies at seven time points during cotton fiber development in immature fiber mutant (xin w 139) and wild-type (** of the im mutant revealed that the gene encoding the PPR protein (Gh_A03G0489) is related to the immature fiber phenotype of the im mutant [37]. Although the expression levels of Gh_A03G0489 were significantly different between TM-1 and IM during the SCW period, the expression levels were relatively low [37]. The PPR gene family is the largest gene family identified to date [38]. They mainly act on mitochondria or chloroplasts to regulate organelle genes at the post-transcriptional level, thereby affecting plant growth and development [38]. We identified 523 genes encoding PPR proteins among the DEGs, and the expression levels in both lines were generally low (FPKM < 2). Notably, we found that two genes encoding PPR proteins (GH_D11G0868 and GH_A05G0653) exhibited a greater than four-fold change in expression during the SCW period (Table S3). Mei et al. reported that GH_A05G0653 was expressed mainly in the A subgenome of 4 G. hirsutum varieties at 20 DPA but showed no difference among the 3 G. barbadense varieties [39]. We also found that the expression of GH_A05G0653 in 
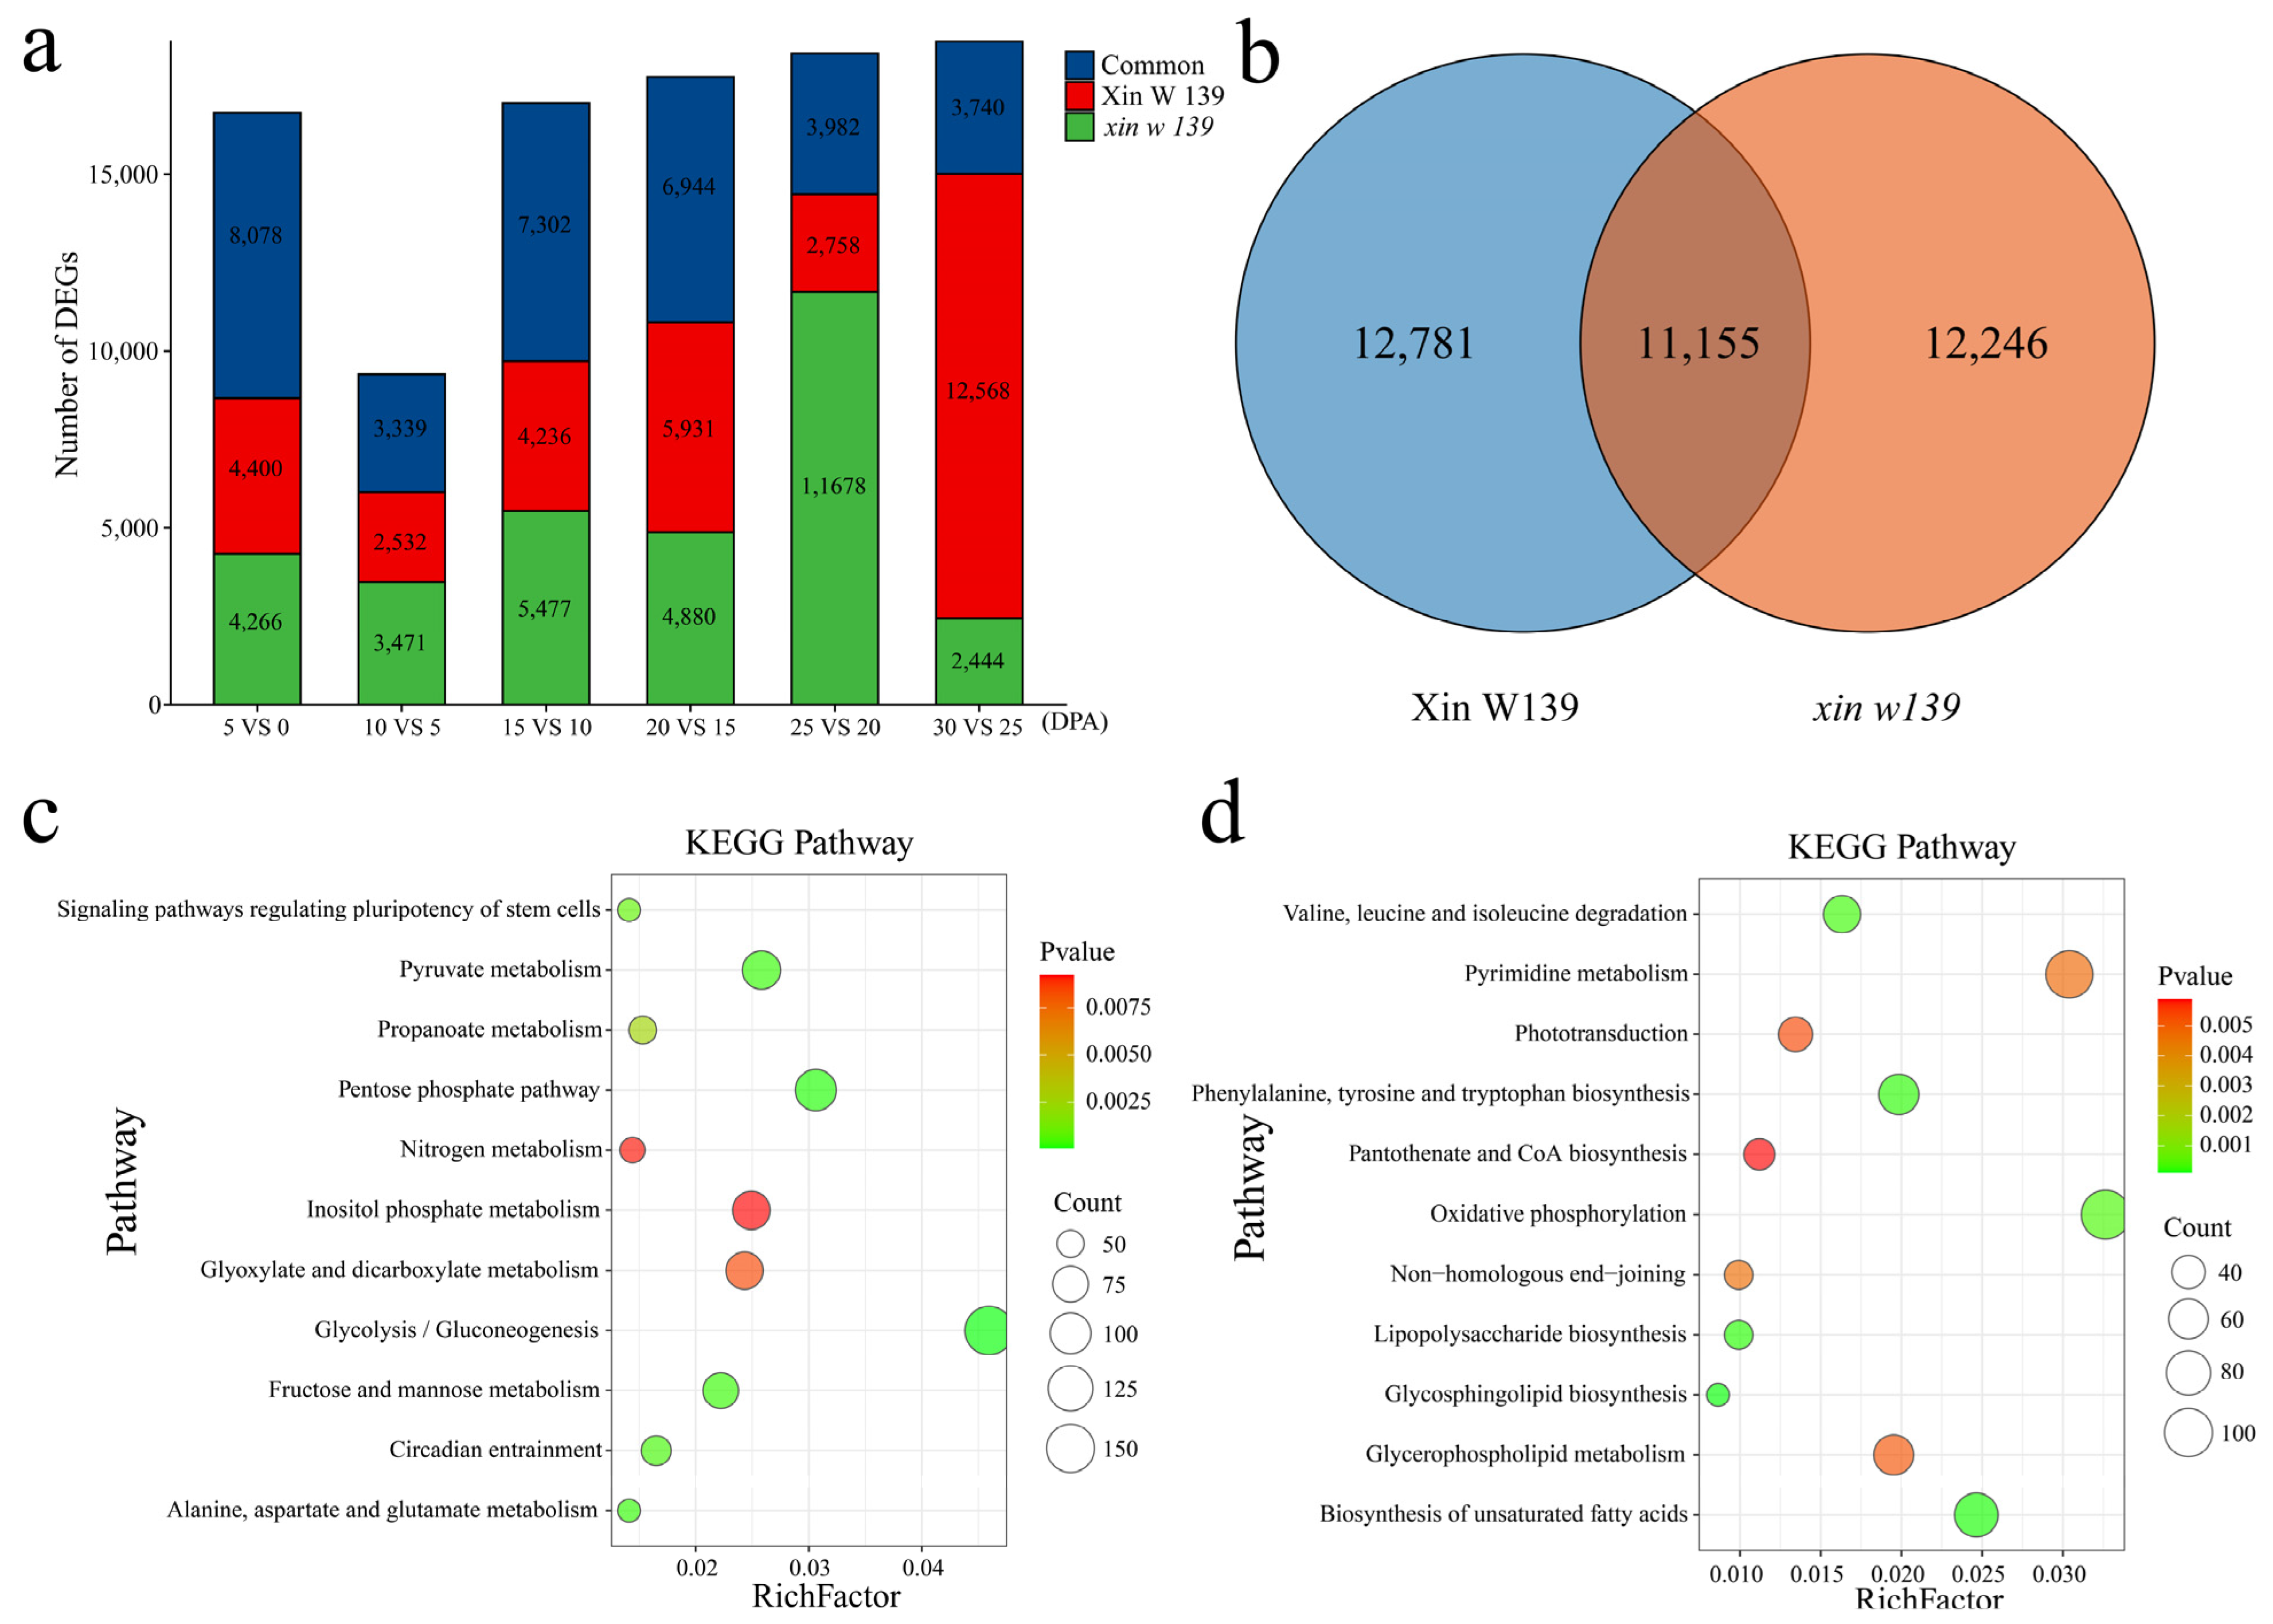
xin w 139 at 20 DPA was greater than that in ** signaling pathway, the pentose phosphate pathway. The pentose phosphate pathway produces NADPH, and NADPH is involved in fatty acid synthesis [47]. The expression of the ethylene synthesis gene GhACO1 was upregulated after the addition of very long-chain fatty acids (VLCFAs) in vitro, which increased the ethylene content in cotton fibers, thereby promoting the elongation of cotton fibers [48]. A recent study showed that BRs regulate the synthesis of GhKCS-mediated VLCFAs through GhBES1, promoting fiber elongation [49]. We found that the DEGs in xin w 139 were annotated to the biosynthesis of the unsaturated fatty acids pathway, suggesting that the difference in fiber length between the two lines may be regulated by the expression of genes involved in the metabolic pathways of unsaturated fatty acids. VLCFAs, via enhanced UDP-l-rhamnose and UDP-d-galacturonic acid biosynthesis, can also increase the elongation of cotton fibers, which may also regulate fiber elongation through the sphingolipid biosynthesis pathway [1]. However, the contribution of VLCFAs to fiber strength has not been reported. Due to the significant difference in fiber length and fiber strength between the two lines, we suspect that the pentose phosphate pathway contributes to both the lightness and length of the fibers; this hypothesis still needs to be verified, but our results can provide important information for subsequent studies.

4. Materials and Methods

4.1. Plant Materials

In this study, a fiber development mutant was found for the line **n W 139, which was selected for breeding at the Institute of Economic Crops of **njiang Academy of Agricultural Sciences in 2018 and named xin w 139 (see Figure 1a,b for the phenotype and fiber analysis of **n W 139 and xin w 139 after flocculation in 2022). The agronomic traits (plant height and number of fruiting branches), yield traits (number of bolls per plant, weight per boll and coating) and fiber quality traits (fiber length and fiber strength) of the **n W 139 and xin w 139 lines were determined in Manas County, Changji city, **njiang, in 2022 and in Toutai township, Wusu city, **njiang, in 2023. For the field experiment, 1 row of each cultivar was planted; each plot was 5 m long, the row spacing was 0.35 m, the plant spacing was 0.10 m, and the management measures were the same as those used in the local conventional field. The cotton bolls on the day of flowering were labeled 0 DPA and they were sampled at 11 a.m. at 0, 5, 10, 15, 20, 25 and 30 DPA. During the sampling, the cotton husk was quickly peeled off within 1 min of peaching, and the fibers were removed with tweezers and immediately placed in liquid nitrogen for cryopreservation (6 replicates of each sample, 3 for RNA-seq and 3 for qRT–PCR).

4.2. RNA Extraction, cDNA Library Preparation, and Sequencing

RNA extraction was performed using the TRIzol method, and the quality of the extracted RNA was assessed via 1% agarose gel electrophoresis [50]. The extracted total RNA was subsequently transported to the Maiwei Metabolism Company (Wuhan, China) on dry ice for sequencing, after which the extracted RNA was fragmented using a PCR plate with a magnetic plate holder. Reverse transcription of the fragmented mRNA to cDNA was performed using Superscript II and random primers (Invitrogen, Carlsbad, CA, USA). The RNA-seq library preparations were sequenced on an Illumina (San Diego, CA, USA) HiSeq 2500/X platform, and 150 bp paired-end reads were generated. The library fragments were purified with an AMPure XP system (Beckman Coulter, Beverly, MA, USA). Then, 3 µL of USER Enzyme (NEB, Ipswich, MA, USA) was incubated with size-selected, adaptor-ligated cDNA at 37 °C for 15 min, followed by 5 min at 95 °C, before PCR. Then, PCR was performed with Phusion High-Fidelity DNA polymerase, universal PCR primers and Index (X) Primer. Finally, the PCR products were purified (AMPure XP system), and the library quality was assessed on an Agilent Bioanalyzer 2100 system. Fastp software (version 0.23.4) was used to remove the adapter sequences and filter out low-mass reads and reads with more than 5% poly-N sequences to obtain clean reads that could be used for the subsequent analysis [51]. The genome (https://www.cottongen.org/species/Gossypium_hirsutum/ZJU-AD1_v2.1, accessed on 3 January 2024) of upland cotton TM-1 was used as a reference, HISAT2 was used for the read alignment, and String Tie was used to quantify the reads in the alignment [52,53].

4.3. Analysis of DEGs

The fragments per kilobase of exon per million fragments mapped (FPKM) is a measure that quantifies gene expression levels. The number of reads per million that aligned to exonic regions was calculated and normalized by the length of the exonic regions and the total number of mapped reads. The gene expression levels in this study were determined using the FPKM method. The fold change in gene expression was calculated using EdgeR 4.0 software based on the number of clean reads obtained from the gene alignment [54]. An FDR ≦ 0.01 and a |log2-fold change| ≧ 1 were used as the standards for screening differentially expressed genes (DEGs) [55]. KEGG is a database resource for understanding high-level functions and utilities of biological systems, such as cells, organisms and ecosystems, from molecular-level information, especially large-scale molecular datasets generated by genome sequencing and other high-throughput experimental technologies (http://www.genome.jp/kegg/, accessed on 5 January 2024). We used KOBAS software 3.0.3 to test the statistical enrichment of differentially expressed genes in the KEGG pathways. The DEG sequences were submitted to PlantTFDB (http://planttfdb.cbi.pku.edu.cn/, accessed on 5 January 2024) for TF prediction.

4.4. Construction of Co-Expression Networks

The expression profile of the DEGs was determined by dynamic branching cleavage using the R language WGCNA package; the weighting coefficient was close to 0.8 β, the correlation coefficient requirement was met, and β = 9 was selected as the weighting coefficient in this study [56]. The automatic network builder Blockwise Modules was used to construct the network to obtain gene co-expression modules. The number of genes contained in each module was unequal, and the modules with a similarity of 0.75 were combined with minModuleSize = 30 and Merge Cut Height = 0.25 as the standards. The correlation coefficient between the characteristic vector module eigengene (ME) of the module and the different time points of fiber development of the two lines was calculated. Visualization of the co-expression networks was performed using Cytoscape (version 3.10.1) software [57].

4.5. SNP/Indel Analysis

Based on the HISAT2 alignment of the reads of each sample to the reference genome sequence, the SNPs/indels were identified using GATK (version 3.2-2) software [58]. The GATK identification criteria were as follows: (1) no more than 3 consecutive single-base mismatches were present in the 35 bp range and (2) the SNP quality values that were standardized by a sequence depth greater than 2.0. SNP/Indel loci were annotated using SnpEff software (version 3.6) to annotate regions of the genome (gene upstream, downstream, exon, or intron regions) based on the location of the variant locus on the reference genome as well as the gene location information on the reference genome [59].

4.6. qRT–PCR

The total RNA was extracted using the RNAprep Pure Polysaccharide Polyphenol Plant Total RNA Isolation Kit from Tiangen (Bei**g, China). The concentration of each RNA sample was measured using a NanoDrop 2000 spectrophotometer from Thermo Fisher Scientific (Waltham, MA, USA). cDNA was synthesized through reverse transcription of the RNA using the M-MLV RTase cDNA Synthesis Kit from TaKaRa (Kyoto, Japan). qRT–PCR analysis was conducted on a Bio-Rad CFX96 real-time PCR system from Mannheim Roche Diagnostics GmbH (Mannheim, Germany), with iTaq Universal SYBR Green Supermix from Takara Bio, Inc., in a reaction volume of 20 μL. For the qRT–PCR analysis, the following reaction program was used: an initial pre-denaturation step at 95 °C for 30 s, followed by 40 cycles of denaturation at 95 °C for 5 s, annealing at 60 °C for 5 s, and extension at 72 °C for 34 s. The relative quantitative analysis of the qRT–PCR results was performed using the 2−ΔΔCt method [60]. The Ct value of the internal reference gene was subtracted from the Ct value of the target gene to obtain the ΔCt. The mean ΔCt value of the control group (0 DPA) was subtracted from each ΔCt of the treatment group to obtain the ΔΔCt. The final expression level was calculated via the 2−ΔΔCt method. The internal reference gene used was GhUBQ7, and each experiment was conducted with three biological replicates. All the primers utilized in this study can be found in Table S1.

5. Conclusions

In conclusion, we used RNA-seq data from seven time points for natural mutant and wild-type lines to provide a reliable dataset for studying cotton fiber development. We not only identified 20 DPA as the key period for FS and length development but also identified several important regulatory pathways involved in fiber development by identifying the DEGs and TFs between lines. Cluster analysis was performed to divide the DEGs into clusters that could describe different stages of fiber development. In addition, seven candidate genes related to cotton fiber development, including three TFs, were screened by WGCNA, sequence comparative analysis and qRT–PCR. However, the exact role of these genes and markers in upland cotton fiber development has yet to be determined. Our results provide a theoretical basis for obtaining an in-depth understanding of the molecular mechanism of cotton fiber development and provide new genetic resources for cotton fiber research.

Supplementary Materials

The following supporting information can be downloaded at https://mdpi.longhoe.net/article/10.3390/plants13081127/s1, Figure S1. Statistical analysis of the plant height, number of fruiting branches and number of bolls of the ** Li), J.Z. and A.A. Collected public datasets and performed the experiments: C.L. (Chun** Li), J.Z., Z.L., Y.Y. and J.M. Analyzed the data: C.L. (Chun** Li), J.Z. and C.L. (Chengxia Lai). Wrote the manuscript: C.L. (Chun** Li) and J.Z. Revised the manuscript: C.L. (Chun** Li), J.Z., J.M. and A.A. All authors have read and agreed to the published version of the manuscript.

Funding

This work was supported by the Major Science and Technology Project of ** in cotton. BMC Genom. 2017, 18, 427. [Google Scholar] [CrossRef] [PubMed]
  • Li, S.; Geng, S.; Pang, B.; Zhao, J.; Huang, Y.; Rui, C.; Cui, J.; Jiao, Y.; Zhang, R.; Gao, W. Revealing Genetic Differences in Fiber Elongation between the Offspring of Sea Island Cotton and Upland Cotton Backcross Populations Based on Transcriptome and Weighted Gene Coexpression Networks. Genes 2022, 13, 954. [Google Scholar] [CrossRef] [PubMed]
  • Jiao, Y.; Long, Y.; Xu, K.; Zhao, F.; Zhao, J.; Li, S.; Geng, S.; Gao, W.; Sun, P.; Deng, X.; et al. Weighted Gene Co-Expression Network Analysis Reveals Hub Genes for Fuzz Development in Gossypium hirsutum. Genes 2023, 14, 208. [Google Scholar] [CrossRef] [PubMed]
  • Duan, Y.; Chen, Q.; Chen, Q.; Zheng, K.; Cai, Y.; Long, Y.; Zhao, J.; Guo, Y.; Sun, F.; Qu, Y. Analysis of transcriptome data and quantitative trait loci enables the identification of candidate genes responsible for fiber strength in Gossypium barbadense. G3 2022, 12, jkac167. [Google Scholar] [CrossRef] [PubMed]
  • Yang, J.; Gao, L.; Liu, X.; Zhang, X.; Wang, X.; Wang, Z. Comparative transcriptome analysis of fiber and nonfiber tissues to identify the genes preferentially expressed in fiber development in Gossypium hirsutum. Sci. Rep. 2021, 11, 22833. [Google Scholar] [CrossRef] [PubMed]
  • Yoo, M.J.; Wendel, J.F. Comparative evolutionary and developmental dynamics of the cotton (Gossypium hirsutum) fiber transcriptome. PLoS Genet. 2014, 10, e1004073. [Google Scholar] [CrossRef] [PubMed]
  • Zhang, J.; Mei, H.; Lu, H.; Chen, R.; Hu, Y.; Zhang, T. Transcriptome Time-Course Analysis in the Whole Period of Cotton Fiber Development. Front. Plant Sci. 2022, 13, 864529. [Google Scholar] [CrossRef]
  • Kim, H.J.; Tang, Y.; Moon, H.S.; Delhom, C.D.; Fang, D.D. Functional analyses of cotton (Gossypium hirsutum L.) immature fiber (im) mutant infer that fiber cell wall development is associated with stress responses. BMC Genom. 2013, 14, 889. [Google Scholar] [CrossRef]
  • Wang, C.; Lv, Y.; Xu, W.; Zhang, T.; Guo, W. Aberrant phenotype and transcriptome expression during fiber cell wall thickening caused by the mutation of the Im gene in immature fiber (im) mutant in Gossypium hirsutum L. BMC Genom. 2014, 15, 94. [Google Scholar] [CrossRef] [PubMed]
  • Wang, C.; Zhang, T.; Guo, W. The im mutant gene negatively affects many aspects of fiber quality traits and lint percentage in cotton. Crop Sci. 2013, 53, 27–37. [Google Scholar] [CrossRef]
  • Thyssen, G.N.; Fang, D.D.; Zeng, L.; Song, X.; Delhom, C.D.; Condon, T.L.; Li, P.; Kim, H.J. The Immature Fiber Mutant Phenotype of Cotton (Gossypium hirsutum) Is Linked to a 22-bp Frame-Shift Deletion in a Mitochondria Targeted Pentatricopeptide Repeat Gene. G3 2016, 6, 1627–1633. [Google Scholar] [CrossRef] [PubMed]
  • Zou, C.; Wang, Q.; Lu, C.; Yang, W.; Zhang, Y.; Cheng, H.; Feng, X.; Prosper, M.A.; Song, G. Transcriptome analysis reveals long noncoding RNAs involved in fiber development in cotton (Gossypium arboreum). Sci. China Life Sci. 2016, 59, 164–171. [Google Scholar] [CrossRef] [PubMed]
  • ** cotton fibers. Plant Cell 2013, 25, 4421–4438. [Google Scholar] [CrossRef]
  • Zhang, M.; Zheng, X.; Song, S.; Zeng, Q.; Hou, L.; Li, D.; Zhao, J.; Wei, Y.; Li, X.; Luo, M.; et al. Spatiotemporal manipulation of auxin biosynthesis in cotton ovule epidermal cells enhances fiber yield and quality. Nat. Biotechnol. 2011, 29, 453–458. [Google Scholar] [CrossRef]
  • Zhang, S.; Jiang, Z.; Chen, J.; Han, Z.; Chi, J.; Li, X.; Yu, J.; ** with HISAT2 and HISAT-genotype. Nat. Biotechnol. 2019, 37, 907–915. [Google Scholar] [CrossRef] [PubMed]
  • Hu, Y.; Chen, J.; Fang, L.; Zhang, Z.; Ma, W.; Niu, Y.; Ju, L.; Deng, J.; Zhao, T.; Lian, J.; et al. Gossypium barbadense and Gossypium hirsutum genomes provide insights into the origin and evolution of allotetraploid cotton. Nat. Genet. 2019, 51, 739–748. [Google Scholar] [CrossRef]
  • Robinson, M.D.; McCarthy, D.J.; Smyth, G.K. edgeR: A Bioconductor package for differential expression analysis of digital gene expression data. Bioinformatics 2010, 26, 139–140. [Google Scholar] [CrossRef]
  • Liu, S.; Wang, Z.; Zhu, R.; Wang, F.; Cheng, Y.; Liu, Y. Three Differential Expression Analysis Methods for RNA Sequencing: Limma, EdgeR, DESeq2. J. Vis. Exp. 2021, 18, e62528. [Google Scholar]
  • Langfelder, P.; Horvath, S. WGCNA: An R package for weighted correlation network analysis. BMC Bioinform. 2008, 9, 559. [Google Scholar] [CrossRef] [PubMed]
  • Auer, F.; Kramer, F. RCX-an R package adapting the Cytoscape Exchange format for biological networks. Bioinform. Adv. 2022, 2, vbac020. [Google Scholar] [CrossRef]
  • Do Valle, Í.F.; Giampieri, E.; Simonetti, G.; Padella, A.; Manfrini, M.; Ferrari, A.; Papayannidis, C.; Zironi, I.; Garonzi, M.; Bernardi, S.; et al. Optimized pipeline of MuTect and GATK tools to improve the detection of somatic single nucleotide polymorphisms in whole-exome sequencing data. BMC Bioinform. 2016, 17 (Suppl. 12), 341. [Google Scholar] [CrossRef] [PubMed]
  • Cingolani, P.; Platts, A.; Wang, L.L.; Coon, M.; Nguyen, T.; Wang, L.; Land, S.J.; Lu, X.; Ruden, D.M. A program for annotating and predicting the effects of single nucleotide polymorphisms, SnpEff: SNPs in the genome of Drosophila melanogaster strain w1118; iso-2; iso-3. Fly 2012, 6, 80–92. [Google Scholar] [CrossRef]
  • Livak, K.J.; Schmittgen, T.D. Analysis of relative gene expression data using real-time quantitative PCR and the 2−ΔΔCT Method. Methods 2001, 25, 402–408. [Google Scholar] [CrossRef]
  • Figure 1. (a) Phenotypes of **n W 139 and xin w 139 after maturation. (b) Phenotype of the length of mature fibers of **n W 139 and xin w 139. Bar = 1 cm. (c) Statistical analysis of the fiber length, fiber strength, single-boll weight and lint percentage of **n W 139 and xin w 139. Significant differences were determined by a t test using a one-way ANOVA (** p < 0.01).
    Figure 1. (a) Phenotypes of **n W 139 and xin w 139 after maturation. (b) Phenotype of the length of mature fibers of **n W 139 and xin w 139. Bar = 1 cm. (c) Statistical analysis of the fiber length, fiber strength, single-boll weight and lint percentage of **n W 139 and xin w 139. Significant differences were determined by a t test using a one-way ANOVA (** p < 0.01).
    Plants 13 01127 g001
    Figure 2. (a) PCA of 42 RNA-seq samples. (b) Cluster dendrogram showing three different developmental stages of cotton fibers: initiation, elongation and secondary wall synthesis (the green font represents **n W 139, and the red font represents xin w 139).
    Figure 2. (a) PCA of 42 RNA-seq samples. (b) Cluster dendrogram showing three different developmental stages of cotton fibers: initiation, elongation and secondary wall synthesis (the green font represents **n W 139, and the red font represents xin w 139).
    Plants 13 01127 g002
    Figure 3. (a) Histogram showing the number of specific and common DEGs in the two lines. (b) Venn diagram of all the DEGs in **n W 139 and xin w 139. (c) KEGG enrichment analysis of all the DEGs in **n W 139. (d) KEGG enrichment analysis of all the DEGs in xin w 139.
    Figure 3. (a) Histogram showing the number of specific and common DEGs in the two lines. (b) Venn diagram of all the DEGs in **n W 139 and xin w 139. (c) KEGG enrichment analysis of all the DEGs in **n W 139. (d) KEGG enrichment analysis of all the DEGs in xin w 139.
    Plants 13 01127 g003
    Figure 4. Expression pattern and functional enrichment analysis of DEGs in the lines. The right side shows the KEGG annotation results of each cluster, showing the top 5 pathways with the smallest p values.
    Figure 4. Expression pattern and functional enrichment analysis of DEGs in the lines. The right side shows the KEGG annotation results of each cluster, showing the top 5 pathways with the smallest p values.
    Plants 13 01127 g004
    Figure 5. (a) Number of DEGs at different stages of fiber development between the lines. (b) Venn diagram of the number of DEGs between and inside the lines; the lines inside represent the DEGs between the same line and different DPAs, and the lines between lines represent the DEGs between the same DPAs of **n W 139 and xin w 139. (c) Line-specific KEGG enrichment analysis of the DEGs. (d) Histogram of the percentage of the line-specific DEGs among the TFs.
    Figure 5. (a) Number of DEGs at different stages of fiber development between the lines. (b) Venn diagram of the number of DEGs between and inside the lines; the lines inside represent the DEGs between the same line and different DPAs, and the lines between lines represent the DEGs between the same DPAs of **n W 139 and xin w 139. (c) Line-specific KEGG enrichment analysis of the DEGs. (d) Histogram of the percentage of the line-specific DEGs among the TFs.
    Plants 13 01127 g005
    Figure 6. Specific expression of DEGs between lines, expression patterns and functional enrichment analysis. The right side shows the KEGG annotation results of each cluster, showing the top 5 pathways with the smallest p values.
    Figure 6. Specific expression of DEGs between lines, expression patterns and functional enrichment analysis. The right side shows the KEGG annotation results of each cluster, showing the top 5 pathways with the smallest p values.
    Plants 13 01127 g006
    Figure 7. (a) Hierarchical clustering tree of genes based on the co-expression network analysis. (b) Heatmap of correlations and significance between the modules and different periods of fiber development. (c) Gene co-expression network within the red module. (d) Gene co-expression network within the tan module. (e) Gene co-expression network within the pink module.
    Figure 7. (a) Hierarchical clustering tree of genes based on the co-expression network analysis. (b) Heatmap of correlations and significance between the modules and different periods of fiber development. (c) Gene co-expression network within the red module. (d) Gene co-expression network within the tan module. (e) Gene co-expression network within the pink module.
    Plants 13 01127 g007
    Figure 8. SNP/Indel information and expression profiling of 7 candidate genes between **n W 139 and xin w 139. The results are presented as the means ± SDs (n = 3, * p < 0.05, ** p < 0.01).
    Figure 8. SNP/Indel information and expression profiling of 7 candidate genes between **n W 139 and xin w 139. The results are presented as the means ± SDs (n = 3, * p < 0.05, ** p < 0.01).
    Plants 13 01127 g008
    Disclaimer/Publisher’s Note: The statements, opinions and data contained in all publications are solely those of the individual author(s) and contributor(s) and not of MDPI and/or the editor(s). MDPI and/or the editor(s) disclaim responsibility for any injury to people or property resulting from any ideas, methods, instructions or products referred to in the content.

    Share and Cite

    MDPI and ACS Style

    Li, C.; Zhao, J.; Liu, Z.; Yang, Y.; Lai, C.; Ma, J.; Aierxi, A. Comparative Transcriptomic Analysis of Gossypium hirsutum Fiber Development in Mutant Materials (xin w 139) Provides New Insights into Cotton Fiber Development. Plants 2024, 13, 1127. https://doi.org/10.3390/plants13081127

    AMA Style

    Li C, Zhao J, Liu Z, Yang Y, Lai C, Ma J, Aierxi A. Comparative Transcriptomic Analysis of Gossypium hirsutum Fiber Development in Mutant Materials (xin w 139) Provides New Insights into Cotton Fiber Development. Plants. 2024; 13(8):1127. https://doi.org/10.3390/plants13081127

    Chicago/Turabian Style

    Li, Chun**, Jieyin Zhao, Zhongshan Liu, Yanlong Yang, Chengxia Lai, Jun Ma, and Alifu Aierxi. 2024. "Comparative Transcriptomic Analysis of Gossypium hirsutum Fiber Development in Mutant Materials (xin w 139) Provides New Insights into Cotton Fiber Development" Plants 13, no. 8: 1127. https://doi.org/10.3390/plants13081127

    Note that from the first issue of 2016, this journal uses article numbers instead of page numbers. See further details here.

    Article Metrics

    Back to TopTop