Modern Scientific Visualizations on the Web


Machine Psychology Lab, Department of Computer Science, University of Massachusetts, Boston, MA 02125, USA
*
Author to whom correspondence should be addressed.
Informatics 2020, 7(4), 37; https://doi.org/10.3390/informatics7040037
Submission received: 8 August 2020
/
Revised: 9 September 2020
/
Accepted: 11 September 2020
/
Published: 24 September 2020
(This article belongs to the Special Issue Feature Paper in Informatics)
Abstract
:Modern scientific visualization is web-based and uses emerging technology such as WebGL (Web Graphics Library) and WebGPU for three-dimensional computer graphics and WebXR for augmented and virtual reality devices. These technologies, paired with the accessibility of websites, potentially offer a user experience beyond traditional standalone visualization systems. We review the state-of-the-art of web-based scientific visualization and present an overview of existing methods categorized by application domain. As part of this analysis, we introduce the Scientific Visualization Future Readiness Score (SciVis FRS) to rank visualizations for a technology-driven disruptive tomorrow. We then summarize challenges, current state of the publication trend, future directions, and opportunities for this exciting research field.
1. Introduction
Web-based visualizations allow consumers to access information and data by visiting a website. This way of distribution is, in many ways, superior to traditional software applications that require download and installation. Further, it facilitates scientific collaboration through sharing data and results among researchers, and being web-based also allows for the silent deployment of data and code updates. The latter is especially important in times of continuous growth of datasets.
We expect the field of scientific visualization in the web browser to play an increasingly important role. This gain in popularity requires research on scalable algorithms for renderings on clients and mobile devices [1]. Many successful visualizations of the last decade already support web-based display such as ParaViewWeb [2], ViSUS [3], and XML3D [4]. However, obstacles related to web-based visualizations include insufficient computational resources, storage restrictions, network latency, and low internet bandwidth. Current research tackles these problems and tries to optimize usability and the user experience beyond the comfort of easy global access and cross-platform deployment. Specifications about scientific visualizations in engineering, medicine, biology, and life sciences include mostly volumetric data. These volumetric datasets are regular and irregular samples of vector and scalar fields [5]. Volumetric data in the web browser often renders using the popular JavaScript API WebGL 2.0 that enables interactive graphics rendering with programmable shaders [6]. By introducing the Hyper Text Markup Language 5 (HTML5) canvas element in 2014 for easy manipulations of 2D and 3D visualizations with JavaScript, WebGL grew in popularity [7]. We provide a detailed analysis and discussion of recent WebGL developments for distinct scientific disciplines in Section 6.
WebGL supports two- and three-dimensional renderings. Developers can design complex scenes with textures, meshes, and different shaders. The popularity of HTML5 and especially WebGL led to an extensive cross-browser and cross-platform compatibility of WebGL since 2011. WebGL, as an implementation of OpenGL, allows graphics processing unit (GPU)-based rendering and acceleration without any third-party browser plugins. Before WebGL, developers used Java applets to create rich visualizations. However, these applets required a sometimes complicated Java installation on the client. Another contender was Flash, which also allows interactive graphics in the web browser. However, the maintenance of different runtimes and the increasing popularity of WebGL contributed to the extinction of these technologies. Moreover, WebGL provides easy prototy** and fast rendering for interactive content, and the advantages of graphics standards and shader languages [8]. Another benefit is the availability of GPU-capabilities in the browser environment, which allows the use of hardware-accelerated 3D graphics for client-side rendering.
Overall, WebGL plays a crucial role in today’s visualization community. In this survey, we present the state-of-the-art techniques used in web-based scientific visualization and discuss modern approaches for scientific application across disciplines.
2. Survey Scope and Structure
The term scientific visualization, a sub-field of computer graphics, describes interdisciplinary visualization of three-dimensional scientific phenomena. Examples are visualizations for medical, biological, meteorological, geological, and architectural purposes that aim to render surfaces, volumes, and many others realistic. Occasionally, scientific visualizations include dynamics and time-dependent data [9].
For the scope of this review, we classify data into two large categories: spatial and non-spatial data. Spatial data includes space-describing characteristics such as location, distance, size, and orientation, e.g., longitude–latitude and x-y-z coordinates. Non-spatial data does not contain any spatial references. Scientific visualization (SciVis) mostly targets spatial data, whereas information visualization (InfoVis) commonly targets non-spatial data or abstract, non-scientific purposes. In this survey, we focus on scientific spatial data visualizations in 3D. However, authors sometimes combine scientific and information visualization. For example, non-spatial data like metadata in tables, plots, graphs, or texts can support three-dimensional volumetric medical or biological data.
Our survey focuses on open source visualizations that use WebGL. While some software libraries target explicitly scientific visualizations, developers often build off general WebGL rendering frameworks, e.g., Three.js [10]. To set the stage for presenting state-of-the-art scientific visualizations, we first describe standard visualization techniques and technicalities of graphical web-based rendering. In this context, Section 4 discusses the importance of data and related handling implications. Section 5 then presents recently published papers categorized by their scientific domain. We also review generic cross-scientific tools to enhance and support scientific visualization on the web. We then discuss existing scientific visualization works, identify the current state of publication trends, and present directions for future work in Section 6.
Scientific Visualization (SciVis) Future Readiness Score
To quantify the preparedness of scientific visualizations regarding state-of-the-art technology, we introduce the SciVis Future Readiness Score (FRS). This score includes selected key performance indicators, which are technical features that estimate how well a visualization may succeed in the rapidly changing world of computational infrastructure. The standardized SciVis Future Readiness Score allows researchers to compare visualizations across domains. Specifically, we evaluate the overall codebase of a visualization with five subcategories: (a) code availability, (b) regular updates, (c) useful documentation, (d) user and developer support, and (e) WebGL version. We also examine the used client-server infrastructure, whether the visualization includes responsive design, virtual and augmented reality capabilities, and the chosen software license. We first score each performance indicator individually and then calculate a weighted average for the final SciVis FRS score. As part of this state-of-the-art report, we calculate the SciVis FRS for the presented applications, projects, libraries, and frameworks reviewed in this survey as follows:
This formula results in a SciVis FRS between 0 and 1, and a higher score indicates a better future preparedness for a visualization. The SciVis FRS for each tool can be found in Table 1. We calculate each feature as a score between 0 and 1. This represents either a binary ranking such as code available with yes (1) or no (0), and documentation available yes (1) or no (0), or a weighted ranking such as WebGL version 1.0 encoded as 0.5 and the more recent WebGL version 2.0 encoded as 1. For client-server infrastructure, we rank as follows; fully client (1), cloud-based (1), client-server (0.5), and server (0). Responsive design, and virtual and augmented reality scores are both binaries as well.
3. Representation Types and Techniques in Web-Based Visualization
Here, we describe fundamental and basic concepts in computer graphics and the technical aspects of visualizations.The visualization process consists of several steps to transform raw data into a final visualization [11]. Recent technological developments allow visual computer graphic techniques to be enabled in the browser. These techniques are often implemented with WebGL, a plugin-free Javacript API for rendering 2D and 3D visualizations with support of the graphical processing unit (GPU). The actual process of rendering using the GPU is a process where 3D data is converted into a 2D image on a screen [7]. Rendering distinguishes between the categories surface and volume rendering. In the following section, we describe surface and volume rendering and how web-based rendering works.
3.1. Surface and Volume Rendering
Surface rendering offers different techniques and algorithms in computer graphics, such as raycasting, ray tracing, radiosity (finite element modeling), scanline rendering, rasterization, and others. When rendering, the reflected light on a surface depends on material properties like reflection, absorption, or transmission, described by ambient, diffuse, and specular characteristics [12]. One of the most popular and frequently used rendering techniques is raycasting. Ray casting calculates the points of intersection with the surface of an object and can be a very compute-intensive operation when visualizing large volumes at interactive rates [1]. This is often the case for scientific data. A specific algorithm of raycasting is ray marching, where iterative marching along the ray is performed to find intersections with the surface of solid geometries. Often implemented in a fragment shader, these image-based approaches process each pixel independently and allow performance and quality enhancements [1].
Furthermore, ray tracing allows sophisticated graphical renderings. Compared to raycasting, this technique additionally includes secondary and tertiary rays in the fragment shader. Sometimes, local lighting—reflected or refracted light—and shadows can be used to render the object. The ray-tracing method generates sharp images by determining precise ray directions from the object’s geometry [13,14]. Another rendering technique in computer graphics is radiosity. The method computes the inter-reflection of light within diffuse environments and the global illumination of the environment independent of the viewer position [12]. In general, ray tracing and radiosity are more complex to produce but can deliver photorealistic results [7].
Besides the implementation of different approaches for rendering surfaces, a large amount of visualization performs volume rendering. A volume is commonly represented as a set of images. Consequently, volume rendering is a technique that composes two-dimensional slices of images into a three-dimensional volumetric data set. The source of this volumetric data is usually three-dimensional data, for instance, from computer simulations or medical CT and MR scanners. For a useful visualization, imaging from different viewpoints and adding different shapes enhances surfaces, density or opacity of objects and scenes [5,15]. As volume rendering is often used in medical applications, web-based rendering techniques that use textures are common, such as XTK [16]. Ray-casting based on the GPU is still the state-of-the-art technique for rendering volumetric datasets [1,17].
3.2. Rendering in the Browser
Over the last years, new technologies such as WebGL and HTML5 Canvas enable hardware accelerated renderings directly in the web browser. This allows fully client-side applications that do not require a server component. However, server-side rendering infrastructure is still commonly used as well, but both methods have advantages and disadvantages. The main difference is that client-side rendering allows for real-time user interaction with a trade-off of higher computational workload [18].
Overall, rendering techniques in the web browser were individually classified in recent papers. Shi et al. [18] proposed to distinguish between model-based and image-based rendering. Model-based remote rendering transmits all 3D data or models from the server to the client. In contrast, image-based rendering implies that the server does 3D graphics rendering, and the resulting images are transmitted to the client. Image-based rendering is, therefore, a more lightweight computation on the client-side. Discher et al. [19] distinguish here between a thick client, similarly to Shi et al.’s model-based rendering, and a thin client, such as the image-based rendering. Similarly, Raji et al. [20] distinguish the implementation of scientific visualizations in data-space or image-space. A data-space implementation is, for example, loading a dataset into the browser and rendering it with frameworks and libraries such as WebGL or VTK.js [21]. In contrast, an exemplary image-based implementation is ParaView’s ArcticViewer [22], a mobile-friendly web visualization command-line tool using JavaScript or NodeJS. The goal is to improve the in-browser user experience by serving on-demand prerendered images of datasets. Nevertheless, these prerenderings can generate high numbers of images that might not be used by the user at all [20]. Evans et al. [7] proposed another classification for remote rendering approaches and named them graphics commands, pixels, and primitives or vectors, and combined techniques. Graphics commands are described by intercepted low-level draw calls to the GPU that are passed to the client, where pixels are basic rendering methods of the full image by the server then displayed by the client. Primitive or vectors use feature extraction techniques on the server-side to obtain vector data that are rendered by the client. Last, combined techniques were proposed by multiple scientific visualization tools, for example, ParaViewWeb [2] as a multi-platform to access ParaView’s rendering cluster within the browser [7].
Early approaches to visualize 3D content in the web used two ISO standards, VRML and X3D, as file or scene formats. Then, the rendering relied on these declarative markup approaches, such as the extensible 3D graphics standards X3D [23], X3DOM [24], and XML3D [4], which enable 3D graphics content creation to be more accessible for the web developer within HTML5 [7]. X3DOM extends to code the X3D standard directly in the browser with plugin-free 3D capabilities and interacts as front-end and back-end system with the possibility to integrate AJAX [5,7]. Last, the XML3D standard is an HTML5 extension utilizing the DOM for direct scene hierarchy building and manipulation [25]. These 3D graphics standards are still used in a variety of reviewed publications and visualization projects. Additionally, some tools exploit CPU-based two-dimensional rendering with the use of the XML-based file format Scalable Vector graphics (SVG), whereas HTML5’s canvas element is used for drawing with WebGL, frequently by integrating the power of the GPU. GPU-based rendering in the browser is exploited by polygon-based approaches or raycasting techniques, as described in Section 3.1. Meshes are thereby generated and passed to the client and uploaded to the GPU for polygon-based rendering. However, other techniques stream the meshes from a server. For example, WebGL offers GPU-based raycasting, which is beneficial for producing high-quality images and reducing the amount of data transfer to save the CPU-GPU bandwidth [17]. WebGL’s rendering pipeline consists only of two programmable stages of the graphics pipeline: the vertex shader and the fragment shader. Within the WebGL context, the main computation fulfilled by the vertex shader is processed to generate fragments, which are the input for the fragment shader. The fragment shader determines, for instance, the final color of a pixel in the visualization. As the increasing popularity of the WebGL API, many WebGL-based engines, libraries, and frameworks have been developed. One of the most frequently used in various application fields is Three.js, which is a JavaScript API for rendering and animating three-dimensional models in the browser [10].
3.3. Virtual and Augmented Reality in the Web
The broader availability in Virtual Reality (VR) or Augmented Reality (AR) applications within recent years has also led to the use of VR and AR as display environments for browser-based visualizations. This modern form of direct user interaction with 3D content offers both new opportunities and challenges for developers. Besides the rendering of regular 2D and 3D data within the browser, a growing amount of tools, libraries, and frameworks recently support the possibility of using the WebVR technology. Including a virtual reality or augmented reality displaying environment in browser-based visualizations primarily depends on the necessity and use of cases in the scientific area and the possible availability of hardware such as headsets or glasses. The web needs to be well equipped for ensuring high-quality virtual reality experiences and low-latency communication. By the end of 2019, WebVR (https://immersive-web.github.io/webvr/spec/1.1/) has been declared as deprecated and is being replaced with the WebXR Device API (https://immersive-web.github.io/webxr/). WebXR supports both AR and VR, where the acronym XR should refer to the spectrum of hardware, applications, and techniques used for Virtual reality, Augmented reality, and other related technologies (https://www.w3.org/TR/webxr/). WebVR or WebXR can be implemented in different ways in the browser. The web framework A-Frame (https://aframe.io/) is one of the most popular and straightforward options to create a WebVR-compatible 3D scene directly within a plain HTML file without installation of plugins and without the need to understand new JavaScript code. A-Frame is a JavaScript client-based text/tag system and enables client-side virtual reality environments and applications that run in a web browser [26]. Developed by the Mozilla Virtual Reality group, A-Frame also has one of the largest VR communities.
4. Data and File Formats
Notably, the growth of so-called “Big Data” and advances in cloud computing shifted many applications away from using local scientific data storage. For outsourcing advantages of visualizations in the web browser, this “Big Data” needs to be compact in memory while still being efficient in usage. The goal of web-based rendering of extensive scientific data involves maintaining speed, performance, and quality. Consequently, it requires powerful approaches in terms of data structures, compression, storage or reduction, etc. For interactive web-based visualization, efficient data handling is an important aspect. While data reduction is a significant strategy to render large datasets in the browser, these methods involve, for instance, filtering or sampling, model-based abstraction, binned aggregation, or hybrid reduction methods [27]. Another fundamental method that needs to be considered is data preprocessing, which mostly includes tasks such as data normalization (e.g., statistics, image processing, and graph analysis). In the visualization process introduced by Haber and McNabb [11], data enrichment and enhancement are the first transformation steps that need to be done. For example, we can first apply some forms of interpolations in the data, cleaning, noise reductions, filtering, or smoothing operations. After the preprocessing stage, we map the visualization as an abstract object from the derived data described by attributes like geometry, color, time, luminosity, surface material, transparency, etc., and render the visualization in the last step to produce a displayable image [1,11]. As discussed in Section 2, we classified data into two categories—spatial and aspatial, where the latter is primarily used for information visualization and spatial data mostly for scientific visualizations. In scientific visualization, popular data types are volumetric data, vector field data, and particle-based data [28]. The scientific data usually comes from varieties of sources like images from microscopes or medical equipment and machines, sensors, or other computer simulations. In terms of data, appropriate file formats can have a high impact on rendering quality and performance. The most common file formats for visualizing scientific data on the web are OBJ (Wavefront file format specification) and STL (STereoLithography) [29] for three-dimensional purposes.
5. Scientific Applications of Web-Based Visualization
In this section, we categorize recent web-based visualization application into the most represented scientific application domains. Beside providing a description of technical and implementation details for the reviewed state-of-the-art papers in each specific field, we show an overview of these applications in Table 1. Moreover, we provide a resource that allows other researchers to perform data mining on all analyzed papers and find additional details regarding our calculations of the SciVis Future Readiness Score: https://github.com/mpsych/SciVis-Web.
5.1. Medical Applications
Web visualization in medical sciences can have useful advantages in offering computing resources to hospitals and clinics without much computational power [46]. Moreover, another use case for web-based visualization of medical data is remote medicine and distributed diagnosis [47]. Compared to other scientific disciplines, medical imaging is one of the most challenging and can lead to computing-intensive visualization scenarios due to the need for high-quality images, scalability, and interaction possibilities in visualization tools [5]. Another growing field is the popularity of visualization web tools for medical education of students, especially exploiting graphical 3D web technologies within human anatomy education, see, for example, in [35,95,96,97,98,99]. More on medical education application can be found in Preim and Saalfeld’s review [100]. A real-time surgical training system developed by Mani and Li [31] targeted further educational purposes using WebGL and X3D.
In 2017, Halle et al. [35] published the Open Anatomy Browser within Brigham Women’s Hospital’s Open Anatomy Project intending to democratize medical knowledge and share data for students, doctors, researchers, and the general public. The tool is a web-based atlas viewer showing 3D anatomical models, including image cross-selections of labeled structures and collaborative tools. The browser is created with Google’s Angular web framework, such as AngularUI (https://angular.io/), and incorporates the 3D models with WebGL and Three.js. An example screenshot from the project’s website is illustrated in Figure 1.
As medical visualization is often concerned with medical images from computer tomography (CT) or magnetic resonance (MR) scanners, creating 3D visualization of medical data is classified into surface extraction and volume rendering [101]. Especially volume data is commonly rendered using GPU support, which was shown by Congote et al. [5] as one of the earliest publications on implementing WebGL for medical data sets in 2011. The authors concluded that WebGL is a valid and promising technology for interactive visualizations. This was proved in the following years by an increasing number of publications in the medical field using WebGL visualization. Jacinto et al. introduced another early-stage image-based approach for medical applications [102] using VTK on the server-side while the Three.js framework is on the client-side [10] for visualization and segmentation of medical images. A client-server platform for the visualization and analysis of the 3D fractal dimension of MRI data was proposed by Jiminez et al. [103]. Marion and Jomier [104] developed a system that allows users to visualize 3D datasets online without external plugins and demonstrated their system on the 3D virtual anatomies modeled from medical images of anonymous patients. In 2012, researchers were already interested in visualizing 3D volumetric data with WebGL on mobile devices acting as thin clients and discovering approaches to render those 3D structures, for example, the work of Noguera et al. [105] and the volume visualizations of medical data sets by Movania and Feng [30] on the computer, tablets, and mobile devices. All these medical visualization possibilities have been developed over the years and improved by WebGL’s stable release 2.0 in 2017. Similarly, this approach was succeeded by Qiao et al. [37] with a website for rapidly viewing, processing, and reconstructing large-scale 3D medical volumes on the mobile internet. As of today, in the medical imaging field, Digital Imaging and Communications (DICOM) is still the de facto standard and is often accompanied by large amounts of metadata with related information about the patient or medical procedures [106]. Visualizing DICOM computer tomography (CT) images by using WebGL was presented by Hou et al. [107] in 2015 with server-side GPU acceleration, and most recently in a new web-based tool by Mullie et al. [45]. The latter developed a web toolkit CoreSlicer, for analytics morphomics in Computed tomography (CT) scans, and took advantage of WebGL’s GPU acceleration as well. One of the few web-based visualizations without WebGL was presented by Min et al. [41] in 2018. Their medical image viewer written in Java for telemedicine includes 3D functions, e.g., volume rendering and surface rendering for regions of interest and a fly-through function. These 3D features allow a more accurate and efficient diagnosis. The application accesses a medical image database remotely, while surface rendering is based on the extraction of edges or contours of 2D tomographic images and constructs triangular patches. The 3D model is rendered with the Marching Cube Algorithm [108] generating vertices data and normal data. Other web-based medical visualization approaches of the last years have mainly integrated with WebGL. In 2019, Moraes et al. [46] described and analyzed a web-based distributed system for interactive visualization of medical volumes by using a server structure for data preparation and then interpret the data on the client-side with WebGL and Three.js. The authors showed their results on a regular desktop browser and Android and iOS mobile devices. The authors aim to integrate their visualization into their previously developed software for reconstructing CT and MRI images called InVesalius (https://invesalius.github.io/). Another valuable publication was recently presented by Zhang [47,48] for web-based medical data visualization and for improving network-based collaboration. The technology of the software platform is based on MySQL, Node.js, and shader code with GPU-based WebGL by develo** a new raycasting algorithm. For the rendering of 3D medical images, the author used a novel graphics lighting and specular shading algorithm for enhancing features of interest, such as a post-color attenuated voxel classification algorithm and lighting effect. A visualization is shown in Figure 2.
Furthermore, intersections between medicine and biology exist in biomedical applications. They typically focus on visualizations that enable rendering of particle systems by raycasting and volumes with ray-marching [8]. We will review these recent publications in Section 5.2.
In the last years, an enormous number of visualization techniques, software, and tools has been developed for neuroscientific purposes and might be one of the broadest fields among medical imaging applications. Research within the neuroscientific field consists in large parts of brain imaging to understand the functioning of the human brain. Analyzing the brain has become an emerging topic in recent years. Mainly due to the large size of data, e.g., different types of Electroencephalography (EEG), CT, or MRI (Magnetic resonance imaging), the application of novel approaches is necessary. A variety of papers in scientific web-based visualization implement the powerful JavaScript library X toolkit (XTK) [16], which offers WebGL rendering for neuroimaging data and supports a vast amount of neuroimaging formats like DICOM, NIFTI (Neuroimaging Informatics Technology Initiative), MGH or MGZ formats from the Massachusetts General Hospital, Nearly Raw Raster Data (NRRD), VTK PolyData, Freesurfer meshes, STL, and TrackVis, as well as label maps, color tables, and surface overlays and many more. Besides the popular X toolkit, BrainBrowser [34] is another JavaScript library based on WebGL built to visualize 3D surface and volumetric neuroimaging data in any modern web browser without requiring plugins. The framework can be integrated into any web-based platform and uses WebWorker, a canvas-based viewer allowing slice-by-slice traversal of 3D or 4D volumetric data. Supported neuroimaging data formats by BrainBrowser are, for example, MNI OBJ, Freesurfer binary, and Freesurfer ASC, custom JSON-based formats.
SliceDrop [32] is a web-based viewer for medical imaging data, including volume rendering and axis-aligned slice views. The medical image data are, therefore, dropped into the browser or selected from a file picker. SliceDrop eliminates security issues by letting the data stay in the local client context, thereby not uploading it onto a remote website. Later, MedView [38] was presented with the idea of a newer version of SliceDrop [32]. The authors of MedView implemented a web-based software for real-time collaborative neuroimage visualization. XTK [16] was used for the client solution, where each client has all the data, whereas the ViewerJS library (https://github.com/FNNDSC/viewerjs) and the Google Drive Realtime API were used for remote collaboration. Ashwini and Kwon [109] published another exemplary tool that implemented its graphical user interface with the popular XTK library. The authors acquired teravoxel-sized 3D neuronal and microvascular brain images and developed an image processing pipeline for real-time 3D visualization that allows researchers to collaborate.
In 2017, a full pipeline for working with massive connectomics datasets was introduced with the BUTTERFLY middleware [36], which was developed in collaboration with neuroscientists. The large data were compressed a priori with an specifically tailored compression method for fast transmission between server and browser client. BUTTERFLY integrates various web-based solutions for data management and storage as well as semantic queries, integrates 2D and 3D visualizations with interactive editing, and graph-based analysis. Notably, the 3DXP viewer renders the 3D visualization of neuron geometries with the X3DOM WebGL library [24] and has a user interface with keyframe recording (see Figure 3).
Before the release of WebGL 2.0 and its performance upgrades, Ledoux et al. [39] presented Fiberweb, a web tool for visualizing dMRI and tractography data of NIFTI and TrackVis files, using WebGL and Three.js. Most recently, the interactive web-based tool FiberStars [49] was introduced to visualize large 3D MRI and tractography data sets within the browser, complemented by displaying detailed two-dimensional data and meta data attached to each file. FiberStars is based on VTK.js [21] for processing the data files as well as Facebook’s open source framework React.js (https://reactjs.org/) for the user interface. React.js provides simple usability to explore and analyze the data interactively. Similarly to BUTTERFLY, the authors proposed the compression of the large brain imaging data sets for efficient storage [110].
Besides the use of CT and different types of MRIs in neuroscience, researchers are interested in neurobiological data, such as large-scale voxel-level connectivity data or gene expression collections in the brain. The web-based visualization of this neurobiological data was targeted by BrainTrawler [44], an analytics framework for an iterative exploration of heterogeneous big brain data. BrainTrawler allows real-time exploration of data and relates it to the hierarchical structure of conventional anatomical atlases. The framework’s technological aspects are implemented with classical volume rendering such as multi-planar reformation to visualize volumetric data in its original spatial, anatomical environment.
Furthermore, the integration of augmented or virtual reality in medical visualization can be a valuable feature for surgical planning and clinical applications. Virag et al. [33] have shown early applications for using augmented reality with WebGL, Three.js, and WebRTC (Web Real-Time Communication) accessing the camera and rendering an image remotely. WebRTC provides web-based real-time communication without the use of further plug-ins. The authors also used JSARToolKit, a JavaScript augmented reality library that allows the video tracking of a physical marker. The thought of using VR for neuroimaging purposes was followed in 2018 with the web-based application NeuroCave by Keiriz et al. [40] for visualizing structural and functional connectome datasets in virtual reality environments (see Figure 4). The authors used Three.js for the 3D scenes and GPU hardware architecture. Another approach for a web-based virtual reality environment in medical visualization was taken by Kokelj [43], again by combining WebGL with WebVR. The authors included Med3D [42], an open source web-based 3D medical data visualization framework, and integrated volumetric raycasting of 3D scalar data. Hadjar et al. [92] applied their WebVR approach to openly available health data from web portals. The WebVR-based system paired the A-Frame framework with Node.js, a low-level environment for executing JavaScript on server-side. The authors were able to run their visualization in all main browsers and mobile devices.
5.2. Biology, Chemistry, and Molecular Visualizations
Molecular or particle data visualizations emerge from various scientific fields such as physics, life science, or chemistry. Consequently, they are presented in the following as an interdisciplinary section together with biological and chemical web-based applications. Molecules or particles are visualized directly, consisting of one or multiple atoms. Mostly, each atom is represented as a sphere with a center, a radius, and a different color depending on the type of atom [111]. Molecular or particle data can either be an abstract static model or consist of dynamic data. Exploring and analyzing data sets with high numbers of molecules or particles, and thereby maintaining a high-quality interactive visualization is a challenging problem. However, interactive rendering can facilitate the analysis and exploration of these data sets [28].
Popular JavaScript libraries for the visualization of particle data originated from the field of molecular sciences, primarily WebGL-based viewers, such as LiteMol [63], MolMil [60], NGL [66,67], SpiderMol [112], 3DMol.js [56], and PV [50]. The NGL viewer (http://proteinformatics.charite.de/ngl) [66,67] is accompanied by its compressed binary file format [113]. Most of these libraries are based on WebGL, where NGL and PV are both based on Three.js. Each of these molecular visualization libraries yields advantages and disadvantages depending on the users’ respecting implementation context. For instance, the frameworks JSmol [51], 3Dmol.js [56], and Web3DMol [64] are concerned with pure 3D representations of the molecular structure, but the editing of molecules in 3D is not possible. However, this feature was included by the WebGL-based tool ChemDoodle [55] for editing the structure of the molecule, similarly to the WebGL-based molecule visualizer Chemozart [54]. Another example is Kekule.js [114], which is not based on WebGL but allows the user to detect, search, and compare molecule structures such as 2D-to-3D conversions. Most of these reviewed works are primarily embeddable libraries but are also available as full web apps.
Shi et al. [64] mention that PV and 3DMol.js are not diverse compared to alternative tools in terms of representation and functionality. On the other hand, NGL might not be flexible enough for molecular representation by showing distinct parts of a protein in different modes. Nevertheless, further memory-efficient and scalable extensions for the WebGL-based molecular viewer NGL were introduced in 2018. Mwalongo et al. [17] points out that none of these existing molecular viewers provide modern rendering techniques to visualize dynamic data. This is especially due to polygon-based rendering that limits quality and scalability for molecules with high numbers of atoms. An additional difficulty is that for each dynamic change, large amounts of triangle data need to be uploaded to the GPU. To target this challenge, Mwalongo et al. [17] present a web-based visualization for dynamic molecular data based on WebGL GPU-based raycasting where each sphere represents an atom [17]. The authors implemented the client-side code by using a WebSocket connection to the server to obtain the raw visualization data. WebGL is used for GPU-based raycasting techniques to render the objects and enables them to render millions of atoms in the browser. An example of Mwalongo’s approach is displayed in Figure 5 with a capsid of papillomavirus consisting of 1.3 million atoms.
Li et al. [53] take advantage of their WebGL protein-ligand viewer by exploiting stereoscopic 3D effects such as anaglyph, parallax barrier, and oculus rift. The latter provides a lightweight possibility to use virtual reality using a headset.
Researchers in life science are interested in investigating time-resolved motions of biological macromolecules by dynamic molecular technologies. In 2018, the interactive streaming and visualization of dynamic 3D molecules were pursued by the HTMoL platform [68] and another similar project called MDsrv [115]. While HTMol uses GPU acceleration, both tools MDsrv and HTMoL allow interactive dynamic web-based visualizations of dynamic molecular trajectories through intuitive graphical user interfaces (GUIs) but require the users to set up their servers [116]. MegaMol is another framework that was proposed for particle-based visualization with a client-server approach by establishing a WebSocket server with the capability of visualizing MD simulations on the web. The framework focuses on prototy** and research, and is suitable for large scientific data sets and remote visualization. Although it was originally developed for particle-based data sets as a standalone desktop application, in 2006 Gralka et al. [69] recently introduced new algorithms and techniques of MegaMol for web and remote visualization by using WebGL. MegaMol is supporting STL and glTF formats and rendering the data with GPU-based raycasting. Moreover, different web applications specialized for molecular science are analyzed in a paper by Abriata [117], such as Martinez et al. [118]. Hildebrand et al. [116] discuss a further detailed review of molecular dynamic simulation viewers. The importance of HTML5 and WebGL for macromolecular visualizations and computer-aided drug design is reviewed by Yuan et al. [119].
Despite a large amount of effort that has been taken towards molecule visualization using life science web applications, implementations in other biological and chemical contexts showed a more hesitant growth and development. In general, a high number of applications in the biological and bioinformatics field, such as the presented molecule viewers, focus on providing visualizations based on structure data that is available through biological databases, such as the Protein Data Bank (PDB) [120,121] or the Nucleic Acid Database (NDB) [122]. These source databases can easily be accessed as they are open source. For example, many tools apply the previously presented molecule viewers in combination with other data analysis tools. Web3DNA has been published by Li et al. [123] to visualize 3D nucleic acid-containing structures, relying on the JSmol [51] framework to visualize the 3D models. A further example is the Cancer3D tool [124], which combines 2D and 3D plots to analyze 3D patterns of cancer mutations out of cancer subset data. Besides the 2D exploration of cancer data, where the authors used their previously developed Protael viewer [125], they integrated an interactive analysis of 3D patterns for cancer mutations in cancer subsets by using the 3DMol [56] framework.
BioWeb3D [52] was an early approach using WebGL and Three.js for biological 3D data visualization applications. The tool allows simultaneous visualization of multiple large datasets as JSON, XML, or CSV files. It aims to support the interpretation of biological data, especially for unknown patterns in the data or untrained researchers. A tool with a similar name in the bioinformatics context presented in 2016, is Bio3D-web [59]. The authors introduced an online application for analyzing the sequence, structure, and heterogeneity of protein families with the possibility for researchers to analyze structural dynamics and evolution to predict protein dynamics. The tool is based on the Bio3D R-package from 2014 and uses Shiny’s (Shiny, http://shiny.rstudio.com) reactive online web application framework. The application visualizes a protein’s interactive 3D structure and is complemented with additional 2D plots like PCA, correlations analysis, dendrograms, ranks, chemical components, etc.
Analyzing genome and protein sequences is a highly research-intensive area that has yielded a variety of visualization software and tools. The HiC-3D Viewer [62] was developed as a WebGL-based tool to explore HiC genomics and gene sequences in 3D. The authors used the Three.js library to display large genomes, while the server-side was implemented with a Python and Flask framework. An illustration of the user interface can be found in Figure 6. A further tool, called CmPIweb, was presented by Kovanci et al. [61], providing visualizations and analysis of protein and gene localizations within cells (see Figure 6). The tool was initially developed based on Java but alternatively presented as a web-based visualization version using PHP, Three.js, and the D3.js library (https://d3js.org/).
Recently, Zhou et al. [65] proposed Omicsnet, a novel platform built upon WebGL and Three.js, for visualizing biological networks in 3D space for different organisms. Network-based approaches in biological sciences have increased in importance to examine interconnections of molecular entities, for example, protein–protein interactions to understand biological systems. Comparable non-web-based tools for biological network visualization were either downloadable standalone desktop programs or needed the installation of plugins. Omicsnet allows the user to create different types of molecular interaction networks and explore them in 3D space by uploading one or multiple lists of molecules such as genes, proteins, microRNAs, transcription factors, metabolites, graphs files, and many more into the browser. An example of Omicsnet can be found in Figure 7.
Moreover, virtual reality approaches have been taken in the life science field as well, for example, 3D-Lab [57]. 3D-Lab was developed as a collaborative web-based platform for automatic 3D molecular modeling and data sharing to facilitate drug discovery and design. The authors enhanced their platform by an open source virtual reality tool called Molecular Rift [58].
Recently, Cassidy et al. [71] presented their tool ProteinVR for molecular visualization. In contrast to other VR molecular visualization programs, which have to be downloaded as a standalone desktop program, the authors developed their program fully web-based. They used the diverse Babylon.js (https://www.babylonjs.com/) library, which is mainly used in gaming contexts.
5.3. Physics
The publishing field in physics applications spans a wide space, from engineering to mechanical sciences, from simple to professional tools or biophysical to chemophysical, and as an intersection to other scientific fields. Thereby, applications mainly depend on the complexity of the experiment or task and can help to optimize the design and engineering of experiments. However, similarly to the molecular visualizations presented in Section 5.2, physical sciences can be concerned with the visualization of particles or atoms. For instance, Chandler et al. [73] proposed a WebGL-enabled visualization of smoothed particle hydrodynamics (SPH) simulations. This fluid simulation method performs computations on a moving set of particles with physical properties depending on the selected fluid. The authors used two interactive volume rendering methods, direct octree rendering, and conversion to a uniform grid.
Most recently, Figueras et al. presented QMwebJS [80], which consists of a Particle Creator and Particle Visualizer both build upon Three.js, Stat.js, dat.GUI, and CCapture. QMwebJS allows the visualization of the temporal evolution of 3D distributions such as creating, editing, and exporting 3D models based on a particle sampling method. Wavefunctions are represented as a collection or cloud of points to a certain time. Figure 8 shows QMwebJS on the right. Preceding QMwebJS, the authors developed another WebGL-based tool, QMBlender [126], which focuses on particle-based visualizations of 3D quantum wave function dynamics and is an add-on module for the open source tool Blender (https://www.blender.org/) for 3D modeling, rendering, and animation [127]. Besides the use in creating animations and gaming, Blender is a popular framework in scientific visualization contexts but still requires local download. Kent et al. [128] showed the use of Blender for 3D graphics in several scientific fields. Other examples of scientific visualizations that build on Blender have been taken in biology for visualizing cell membranes [129], fluid solutions [130], astrophysical visualization [131], and similar applications to the presented methods on molecular dynamics visualization [132]. However, most of these scientific visualization approaches still require the download of Blender, but addons can enable export to web browser-compatible formats.
Significant projects in particle physics such as collision experiments at CERN (European Organization for Nuclear Research) with the Large Hadron Collider required advanced visualization methods and were visualized with their own developed framework iSpy WebGL [74]. The researchers aimed to visualize events, detected and reconstructed by experiments at CERN, using Three.js with a client-side application (https://github.com/cms-outreach/ispy-webgl). Besides producing images and animations of the collision events of particles for the public, the authors integrated a stereo view. They applied Virtual Reality with Google’s Cardboard (https://arvr.google.com/cardboard/) but plan the integration of the WebVR API as well in the future (see Figure 9 left).
Another web-based physics application was developed in 2019 by Kaboudian et al. [79] for investigating complexity and nonlinear dynamics in solitons and fractals. This library especially renders 1D and 2D visualizations but was also used to visualize 3D wave simulation data sets. The authors developed their computing paradigm by using WebGL along with their developed library Abubu.js by the use of vertex and fragment shader code.
Diblen et al. [76] applied their open science platform SPOT on multidimensional data sets, for instance, on a data set for dark matter models. The authors targeted multiple scientific disciplines besides physics to enable secure data sharing on their platform. The framework allows users to edit visualizations, interactively store data in the cloud, and, although it is not based on WebGL, it offers OpenGL accelerated rendering with GPU. However, Diblen et al. focus primarily on the visualization of 2D graphics.
Furthermore, Computer-Aided Design solutions (CAD) are an important part of prototy**, engineering, and physical simulations. However, in this article they are only briefly reviewed in terms of scientific visualizations as these tools are primarily used in the industry. Most of these browser-based visualizations have not yet been implemented with WebGL, yielding the potential for future research. A free browser-based tool, called OpenJSCAD [133], offers a JavaScript interface for programmatic modeling of 2D and 3D designs directly in the browser, similarly to VRMath2 [75], a tool based on X3D and X3DOM. The latter was originally developed for educational purposes in STEM fields, but use cases in various scientific fields were also identified. The authors presented a prototype for virtual reality with Cardboard VR but targeted the WebVR API’s implementation in the future (see Figure 9 right). Recently, Lupinetti et al. [77] proposed their work for CAD models based on WebGL technology with an application to visualize and enhance CAD assembly models.
Similar 3D online content processors, but not only for 3D CAD models, address specifically triangle and hexahedral meshes. For example, the HexaLab project [78], which interactively generates and displays hexahedral meshes for physics applications is based on WebGL. Those hex meshes contain complex internal structures and can be better explored with real-time visualization. Similarly, MeshLabJS (https://github.com/cnr-isti-vclab/meshlab) allows editing 3D models represented as triangle meshes in the browser [72]. MeshLabJS supports many formats such as PLY, STL, OFF, OBJ, 3DS, VRML, and X3D and runs the C++ code compiled into JavaScript.
Beyond these applications, a large part of visualizations in physics takes part in astrophysics. Astrophysical imaging visualizations and simulations are concerned with massive amounts of complex data and require high computational performance and memory. Terabytes of data sometimes originate from telescope observations across the electromagnetic spectrum making the storage and management of raw data such as the visualization of the processed data a challenge [128]. The importance of observations within astrophysics and astronomy led to the growing development and use of web-portals in recent years [134]. Dykes et al. describe that the lack of 3D visualization on the web for cosmology is a computational expense. Those large theoretical datasets require high-performance computing resources for visualizations, which is a remaining challenge for visualization solely in the browser. While web-based astronomy is often performed with ParaviewWeb as a client-server approach [2], Dykes et al. use Splotch [135] as visualization engine, an open source scientific visualization framework, to build a client-server tool, as shown in Figure 10. The authors use dat.GUI (https://github.com/dataarts/dat.gui) and various filters to investigate the properties of galaxies. For a review of these web-based approaches for astrophysical observatories, the reader is referred to Dykes et al. [134]. In general, the current state-of-the-art web-visualizations for astronomy and cosmological data try to map large multi-resolution images within the browser environment using JavaScript mainly in 2D, for example, Bertin et al. [136]. Nevertheless, three-dimensional rendering approaches and the possibility of user interaction are necessary to explore and analyze the data successfully. The worldwide telescope (WWT) [137] offers a scientific data visualization platform as WebGL-powered application, which acts as a virtual sky in a 3D environment. The users can explore the sky across the electromagnetic spectrum with data from NASA’s Great Observatories; explore planetary surfaces and elevation maps, solar system bodies, and asteroids to view stars; and import their data and images. An example is illustrated in Figure 10.
Pomarède et al. [138,139] presented useful web-based visualizations using Sketchfab to study and create maps of the universe or cosmos. Sketchfab (https://sketchfab.com/) is a WebGL-based platform, tool, and community for 3D models and textures, providing VR interfaces. Moreover, the community of Sketchfab consists of 3D artists and developers who share their creations online for other users. Pomarède et al. used the platform to create visualizations of cosmic flows and velocity to map the distribution of matter in the universe for a better understanding of galaxy motions and to improve the discovery process for astrophysicists. The visualizations can be found in Figure 11.
5.4. Geographical Visualizations
The massive amounts of Earth data in previously reviewed topics on galaxies and planets intersect with use cases for geographical map**s and rendering. In general, geographical, meteorological, and ecological visualizations are concerned with spatial or spatial-temporal data. They are one of the most common data types and have large application fields, releasing a heterogeneous collection of different Web3D systems. Geospatial data includes, for example, aerial imagery, such as satellite, radar, or LiDAR data, as well as 3D city models and GPS data, digital terrain models, or point clouds. Moreover, so-called geographic information systems (GIS) can easily handle geospatial data, but are frequently not able to run in the browser. However, client-side rendering of 2D geospatial data can be applied with frameworks such as Leaflet (https://leafletjs.com/) or OpenLayers (https://openlayers.org/), whereas 3D rendering of geo-data is rather less implemented on the web. Nevertheless, new applications are developed for specific use cases in the browser environment, and a large amount of these are based on WebGL.
Feng et al. [140] introduced one of the first 3D geo-visualization systems using WebGL in 2011. WebGL served as a powerful rendering engine but the applicability in practice was only limited due to the complex server structure. OpenWebGlobe [141] rapidly followed this approach with a virtual globe solution with large scale rendering and imagery data display for custom applications. Similarly, WebGL Globe (https://experiments.withgoogle.com/chrome/globe), an open platform for geographic data visualization based on Three.js, was developed by the Google Data Arts Team. The platform supports data in JSON format where the users can create their virtual globe.
In 2013, Cesium.js [142] was released, remaining one of the most popular WebGL libraries for 3D geospatial web visualization until today. Cesium.js supports a vast amount of data formats and allows fast rendering. Kraemer et al. [143] compared the usefulness of Cesium.js, X3DOM, and Three.js for geospatial applications in a case study. The authors elaborate that each of the three frameworks yields advantages and disadvantages, such as different requirements and target groups. Cesium.js, for example, aims directly geographical applications and is advantageous for spatial reference systems handling geospatial coordinates and data. This advantage of geo-specific support is not given by Three.js, which needs further extension by other libraries. On the other hand, Three.js is flexible, offers direct access to WebGL, has a large community, a broad range of applications, and allows streaming of massive point clouds. Even if X3DOM has geo-specific support within X3D, it includes only a few coordinate reference systems. In the case study, Kraemer et al. showed that X3DOM did not meet the requirements in their use cases [143].
The advantages of Cesium.js for creating a virtual globe were exploited by generating interactive geological and environmental visualizations, for instance, by Mueller et. al [82] in the GPlates Web Portal (http://portal.gplates.org/). This portal allows fast, interactive visualization of geophysical and geological data sets, which are draped over terrain models. The authors used beside the WebGL powered library Cesium.js, also JQuery, and implemented their portal with a cloud-based infrastructure with Amazon-Cloud [82]. Moreover, Cesium.js is a possibility for loading and visualizing large-scale urban 3D models. This approach was followed by Miao et al. [144]. 3D geographic scenes visualizations based on WebGL supported the implementation of a digital city roaming system. The authors converted the 3D scene models to glTF (GL Transmission Format) and demonstrated their system on the city model of New York City.
Especially research on climate or meteorological data and their visualization have emerged in the last decades. Researchers have also been more concerned with climate warming, ecological, and environmental issues. PolarGlobe is another example of a web-based platform based on Cesium.js, enabling the three-dimensional visualization of multidimensional, time-varying climate data on a virtual globe [85]. The server takes care of dimension reduction, linear transformation, and video encoding, while the browser restores the data and visualizes it with GPU-based client-rendering via WebGL. The authors used lossy video compression techniques for improving the transmission of a significant amount of time series data over the web and realize real-time data rendering. The user interface with interactive climate visualizations of the Earth is shown in Figure 12.
Additional frameworks visualizing climate, meteorological, and environmental data have been proposed. With the release of WebGL in 2011 as new standard for 3D graphics rendering in the browser, Congote et al. [5] demonstrated one of the first applications visualizing meteorology data. The authors applied volume rendering on a medical imaging and weather radar data sets, the latter represented as 2D images scanned from the surrounding atmosphere. The authors aimed to visualize volumetric data with WebGL and created an interactive visualization of the radar data to different points in time. A further scientific visualization can be found for environmental science, recently proposed by Liu et al. [88]. The authors presented a method for interactive three-dimensional visualization of air pollutants. Their advanced technology is based on Three.js and can display other scientific datasets such as meteorological or hydrology data. Single pollution particles are visualized, and the pollutant density can be estimated.
Another challenge in web-based rendering is the motion effects of spatial objects. However, Cesium.js offers several types of animation and motion, but yet no interactive motion is possible. For more information and a detailed table on currently available WebGL visualization frameworks, libraries, and projects for geospatial capabilities, the reader is referred to Evangelidis et al. [86]. The authors investigate the functionalities involving both animation and moving capabilities of 3D models. The software tool provides dynamic creation of user-defined virtual geospatial worlds, including user-selected animated and moving 3D models [86].
Some geospatial data types are point clouds, for example, applied as streamable 3D content. Point clouds facilitate the representation of real-world objects and environments. Technologies acquire them with LiDAR, radar, aerial, and digital cameras [87]. Most recently, Discher et al. [19] presented their web-based interactive system of massive 3D point clouds with WebGL. The authors distinguished between thick and thin clients. On thin clients, the images are rendered with the server component and only displayed in the client, in contrast to a thick client where the rendering process takes part in the client with Cesium.js. The server-side rendering for thin clients was based on OpenGL, glbinding (https://github.com/cginternals/glbinding) and GLFW (https://www.glfw.org/index.html). Displaying 2D models as well as stereoscopic panoramas of the geographic scene was implemented with Three.js and WebVR Polyfill (https://github.com/immersive-web/webvr-polyfill) to enable WebVR on any device [19].
Moreover, some forms of geographical visualizations are concerned with marine or ocean data. Besides many other types of geological visualizations, the previously described web portal GPlates [82] demonstrated the visualization of seafloor plans, as seen in Figure 13. Further tools that primarily focus on web visualization of oceanography can be found in [89,145]. Resch et al. [145] used WebGL for visualizing 4D marine geo-data in a client-server approach. They describe the implementation of time-dependent geo-data. Furthermore, the authors discuss challenges and requirements, especially for implementing spatial-temporal data on the web. Comparatively, EddyViz [89] used Three.js for their software to visualize natural phenomena such as ocean eddies and water circulation in 3D (see Figure 13 left). These visualizations can be helpful for scientists or students in oceanography, meteorology, and environmental sciences.
Another field with intersections of geographical science is archaeology. During the last years, various high-quality 3D archaeological representations on the web have been developed. In 2016, Galeazzi et al. [146] presented the ADS 3D Viewer, a web-based visualization tool for the management and analysis of archaeological 3D data. The viewer relies on the 3D Heritage Online Presenter (3DHOP) (http://www.3dhop.net/), a free WebGL-based library for 3D web-based rendering using multi-resolution encoding [81]. 3DHOP has been integrated in several cultural heritage and archaeological projects. This approach was followed in 2019 by Boutsi et al. [90], develo** a web-based cultural heritage visualization platform with multi-resolution models from large-scale archaeological sites and complex historical assets complemented with supportive multimedia content. The authors used 3D and 2D cultural and geospatial data along with data compression and GPU support. Besides the rendering with WebGL and Three.js, the platform uses the 3DHOP framework as well.
A few years ago, web-based Virtual Reality was implemented as an efficient and fast way to represent architectural and archaeological objects for cultural heritage by Koeva et al. [83,84]. The authors integrated VR in a web-portal with high-resolution spherical panoramas, maps, frame images, and GPS coordinates for cultural heritage.
5.5. Cross Scientific Toolkits Supporting Scientific Visualization
Most scientific visualizations are developed for a specific use case and allow only a restricted application in other areas. In contrast, other publications on web-based tools or software have a general character and enable the implementation across different domains and use cases. One popular example is ParaViewWeb, proposed by Jourdain et al. [2] in 2011. ParaViewWeb is a data analysis and visualization platform as well as a JavaScript library powered by the VTK framework. It is nowadays in use for multiple scientific purposes and in many Kitware, Inc. web projects (https://www.paraview.org/web). It can even be implemented for mobile devices by applying ParaView’s ArcticViewer (https://kitware.github.io/arctic-viewer/index.html).
Another cross scientific tool is Tapestry, presented by Raji et al. [20], a decoupled architecture to implement scientific visualization as a microservice within an open source platform. For interactive visualizations backed with server computation, cloud computing was applied with Amazon Web Services (AWS). Taspestry can help other researchers to easily integrate their visualization into lightweight web pages. Previously, the authors developed a method for encapsulating and embedding interactive 3D volume rendering into standard web pages [147]. Particularly for scientific purposes, the incorporation of visualizations in informative websites can be a valuable addition to make research-based content more accessible to a broader audience.
Furthermore, a high number of publications aimed to support collaborative web visualizations and data sharing. Recently, Voxer [93], a platform for creating, customizing, and sharing scientific visualizations, has been introduced by Yang et al. The system decouples the user interface from system space and encapsulates data processing and the rendering as a web-service. Voxer provides a user interface for domain experts to create and customize different visualization pipelines responding to their specific requirements. The authors rendered 3D volume data with OSPray [148], a fast CPU-based ray-tracing framework, VTK for the back-end, and React.js for the front-end.
Another 3D collaborative editor using WebGL and WebRTC was presented by Desprat et al. [91]. The authors targeted interactivity and real-time updates within 3D scenes visualization and a small asynchronous message system, primarily to overcome the difficulties related to real-time network collaboration of shared 3D models. By exploiting WebGL for the client, the users are allowed to edit the 3D scenes. The data transmission is exchanged and updated by using WebRTC (Web Real-Time Protocol) (https://webrtc.org/). The authors evaluated their application based on three experiments and concluded to handle more significant scenes using adaptive rendering and enhancing data streaming in future work. While remote streaming is still a remaining challenge in today’s web-based visualization, it has already been tackled to be improved by several techniques. Previously, before WebGL version 2.0, Lavoué et al. [149] proposed a solution using a progressive compression algorithm for 3D graphic data with colors, by producing a binary format which allows decompression for data streaming in the web browser. Compression is a helpful feature for web-based visualization suffering from latency and heterogeneous client devices. Several of the presented publications in this review make use of the advantages of data compression [19,49,73,85,90,113]. Besides both the tool of Desprat et al. [91] and Virag et al.’s [33] medical implementation, the use of WebRTC can go beyond communication such as shown by Tamm et al. [150]. The authors used WebRTC for remote rendering with image and video streams and planned to implement a collaborative application in the future.
Recently, Matelsky et al. [94] introduced their Substrate package implemented with Python and Three.js for data visualization, communication, and code reuse across diverse research teams. The package allows scientists to rapidly build compelling three-dimensional scenes and visualizations. Furthermore, the authors developed a Python module to access and interact with their WebGL-based Substrate package within Python’s Jupyter environment and thereby not requiring the researcher to have any JavaScript or WebGL knowledge.
6. Discussion and Directions for Future Work
This review identifies geographical data with 3D maps and terrain visualization; molecular data viewers for biology or chemistry; and for the medical research field, brain imaging data, among the major scientific application fields for browser-based visualizations. Analyzing the future readiness for each application, we discovered many tools and frameworks mostly among molecular sciences yielding higher average scores than tools in other scientific domains. Visualization researchers have long been interested in a browser-based environment for molecular viewers despite the number of available desktop tools [111]. This might have led to the development of sophisticated state-of-the-art molecular viewers. In contrast, we can still determine a lack of 3D visualization abilities and tools for astronomy data that are web-capable [134]. We also note a strong remaining potential in further scientific disciplines to investigate options for develo** web-based visualizations or using existing open source approaches to support their research. The introduced future readiness score indicates promising applications in each domain, which can be used as interdisciplinary examples or built upon for future research. Furthermore, we estimate that primarily the open source character of web-based tools and the sharing of datasets will help the scientific community advance their research and contribute to more collaboration. Some of the reviewed publications are concerned with integrating real-time updates and fast data transmission for live collaboration. This offers the possibility for multiple users working in the same environment and has been implemented by some applications, such as WebRTC, or real-time APIs, such as Google Drive. Technical aspects of remote scientific visualization in the browser are still concerned with minimizing latency and improving rendering performance in the browser. Fast data transfer and streaming to the client by finding new ways for efficient data compression and encoding are fundamental for the visualization of large datasets. Depending on the type of dynamics and animations, interactive and scalable visualizations can also influence these technical aspects. Another factor in web-based visualization is the importance of choosing an appropriate infrastructure. The reviewed frameworks’ dominant infrastructure is a client-server approach with browser-side rendering and image transfer to the client. However, some of the reviewed tools use a full client or even a cloud-based infrastructure. Recently, client-based rendering might be the most promising infrastructure, especially for platform-independent interactive visualizations. With continuous improvements and lightweight visualization techniques, remote visualization might undergo a constant shift to completely browser-based rendering as well as new server-side technologies such as cloud computing. Further technical progress in this area can be convenient for thin clients, particularly mobile phones or tablets. Overall, we have found that ~70% of applications use responsive web design and aim to improve their visualization for multiple mobile devices. Nevertheless, implementing WebGL for browser-based tools has limitations on specific handheld devices. However, the attractiveness of using the browser on different devices expands. The number of WebGL-based applications is growing among scientific visualization, as they overcome most deficiencies of traditional tools.
In the following, we analyzed the use of WebGL in scientific publications. As WebGL was first introduced in 2011 and the stable release of WebGL 2.0 occurred in 2017, we focused on this timeline in our analysis. We executed a search with Google Scholar for each scientific application field analyzed in this paper. For each year since 2011, we noted the number of publications per scientific discipline and created a trend chart (see Figure 14). The line plotted in orange shows the papers, including the keywords Scientific visualization and WebGL. Overall, we can see an increasing trend of publications each year using WebGL, and we, therefore, expect web-based visualization to become progressively crucial for various scientific fields.
In terms of future work, the presented papers in this review include directions or possible improvements that can be made. At first, more massive scientific datasets require new solutions and techniques in data transmission between browser and server, compression methods, or data preprocessing. For example, Moraes et al. [46] suggest improvements in triangle mesh generation and that using automated tools could be impressive in the future. Zhang et al. [48] consider designing some advanced interpolation techniques for dealing with volumetric data and highlight the importance of user interactions for web-based visualization, allowing users to change features in user interfaces dynamically. Furthermore, the integration of new web technologies such as WebCL (Web Computing Language) for high-performance parallel computing (https://www.khronos.org/webcl/) of both central processing unit (CPU) and graphics processing unit (GPU) is an advantage for WebGL-based data rendering. MedView [38] pointed out the necessity of an overall improved mobile experience for the user. Other applications target future work by exploring web standard protocols such as Web-Sockets or WebRTC, for interactive web-based collaborative visualization or the development of new JavaScript modules to enable in-app video calls based on WebRTC. Moreover, deploying remote visualization software as cloud services in large cloud frameworks provides the possibility for services used by many simultaneous users. Further tools will focus on topics such as scalability and issues on the server-side, transferring larger datasets, supporting various rendering styles at different levels of detail, or investigating new compression algorithms for faster computing. Last, we reviewed multiple applications planning to work on integrating virtual or augmented reality, which will be an upcoming topic within the next years. By evaluating the future readiness of recent work, we found that using cross-platform web-based applications plays a crucial role, and each scientific research area yields pioneers with sophisticated open source state-of-the-art visualizations.
7. Conclusions
In this review, we have discussed a variety of state-of-the-art scientific visualizations implemented in the browser. High quality, useful remote visualizations of growing and more complex scientific data sets require new approaches, techniques, and algorithms. However, recent web-based visualization frameworks and tools occasionally suffer from latency and network bandwidth issues. Therefore, further research and improvements in new techniques and algorithms are needed to address these challenges. While some of the presented WebGL-based approaches use the possibility of GPU-accelerated rendering on both desktop computers and mobile devices, fully client-based rendering or novel compression algorithms can be up-and-coming methods for independent visualizations. Moreover, we found that WebGL is a continually increasing trend among 3D web-based visualizations in various scientific disciplines. Especially physics and medicine frequently exploit the advantages of WebGL, while other scientific fields such as chemistry and biology follow this publication trend with an increasing amount of publications each year. Finally, we explored the future readiness of individual software tools and frameworks. The future-readiness calls out for the need for open source research. It indicates new tendencies of implementing virtual or augmented reality within a web-based environment or the significance of responsive tools executable on different devices. Our discussion showed that several approaches still have limitations concerning rendering on thin clients such as mobile phones or tablets. Furthermore, virtual and augmented reality for the web is still in its beginnings and will emerge within the next years. Nevertheless, we believe that continuous technical progress and developments can push visualizations on the web to an even higher level and the browser to become one of the preferred platforms for scientific visualizations.
Author Contributions
L.F. wrote the manuscript with support from D.H., who supervised the findings of this work. All authors have read and agreed to the published version of the manuscript.
Funding
This research received no external funding.
Conflicts of Interest
The authors declare no conflict of interest.
Abbreviations
The following abbreviations are used in this manuscript.
| HTML5 | Hyper Text Markup Language 5 |
| WebGL | Web Graphics Library |
| WebXR | Web Cross Reality (augmented and virtual reality) |
| WebRTC | Web Real-Time Protocol |
References
- Beyer, J.; Hadwiger, M.; Pfister, H. State-of-the-art in GPU-based large-scale volume visualization. In Computer Graphics Forum; The Eurographs Association & John Wiley & Sons, Ltd.: Chichester, UK, 2015; Volume 34, pp. 13–37. [Google Scholar]
- Jourdain, S.; Ayachit, U.; Geveci, B. Paraviewweb, a web framework for 3d visualization and data processing. In Proceedings of the IADIS International Conference on Web Virtual Reality And Three-Dimensional Worlds, Freiburg, Germany, 27–29 July 2010; Volume 7, p. 1. [Google Scholar]
- Pascucci, V.; Scorzelli, G.; Summa, B.; Bremer, P.T.; Gyulassy, A.; Christensen, C.; Philip, S.; Kumar, S. The ViSUS visualization framework. In High Performance Visualization: Enabling Extreme-Scale Scientific Insight; Chapman and Hall/CRC: Boca Raton, FL, USA, 2012; pp. 401–414. [Google Scholar]
- Sons, K.; Klein, F.; Rubinstein, D.; Byelozyorov, S.; Slusallek, P. XML3D: Interactive 3D graphics for the web. In Proceedings of the 15th International Conference on Web 3D Technology, Los Angeles, CA, USA, 24–25 July 2010; pp. 175–184. [Google Scholar]
- Congote, J.; Segura, A.; Kabongo, L.; Moreno, A.; Posada, J.; Ruiz, O. Interactive Visualization of Volumetric Data With Webgl in Real-Time. In Proceedings of the 16th International Conference on 3D Web Technology, Paris, France, 20–22 June 2011; pp. 137–146. [Google Scholar]
- Marrin, C. Webgl Specification; Khronos WebGL Working Group: Beaverton, OR, USA, 2011; Volume 3. [Google Scholar]
- Evans, A.; Romeo, M.; Bahrehmand, A.; Agenjo, J.; Blat, J. 3D graphics on the web: A survey. Comput. Graph. 2014, 41, 43–61. [Google Scholar]
- Potenziani, M.; Callieri, M.; Dellepiane, M.; Scopigno, R. Publishing and Consuming 3D Content on the Web: A Survey. Found. Trends Comput. Graph. Vis. 2018, 10, 244–333. [Google Scholar] [CrossRef]
- Friendly, M.; Denis, D.J. Milestones in the History of Thematic Cartography, Statistical Graphics, and Data Visualization. Citeseer 2001, 32, 13. [Google Scholar]
- Cabello, R. Three.js. 2010. Available online: Https://threejs.org/ (accessed on 8 June 2020).
- Haber, R.B.; McNabb, D.A. Visualization idioms: A conceptual model for scientific visualization systems. Vis. Sci. Comput. 1990, 74, 93. [Google Scholar]
- Greenberg, D.P.; Cohen, M.F.; Torrance, K.E. Radiosity: A method for computing global illumination. Vis. Comput. 1986, 2, 291–297. [Google Scholar]
- Whitted, T. An improved illumination model for shaded display. In ACM Siggraph 2005 Courses; Association for Computing Machinery: New York, NY, USA, 2005; p. 4-es. [Google Scholar]
- Appel, A. Some techniques for shading machine renderings of solids. In Proceedings of the Spring Joint Computer Conference, Association for Computing Machinery, New York, NY, USA, 30 April–2 May 1968; pp. 37–45. [Google Scholar]
- Drebin, R.A.; Carpenter, L.; Hanrahan, P. Volume rendering. ACM Siggraph Comput. Graph. 1988, 22, 65–74. [Google Scholar]
- Haehn, D.; Rannou, N.; Ahtam, B.; Grant, E.; Pienaar, R. Neuroimaging in the browser using the x toolkit. Front. Neuroinform. 2014, 101. [Google Scholar]
- Mwalongo, F.; Krone, M.; Becher, M.; Reina, G.; Ertl, T. GPU-based remote visualization of dynamic molecular data on the web. Graph. Model. 2016, 88, 57–65. [Google Scholar]
- Shi, S.; Hsu, C.H. A survey of interactive remote rendering systems. ACM Comput. Surv. CSUR 2015, 47, 1–29. [Google Scholar] [CrossRef]
- Discher, S.; Richter, R.; Döllner, J. Concepts and techniques for web-based visualization and processing of massive 3D point clouds with semantics. Graph. Model. 2019, 104, 101036. [Google Scholar] [CrossRef]
- Raji, M.; Hota, A.; Hobson, T.; Huang, J. Scientific visualization as a microservice. IEEE Trans. Vis. Comput. Graph. 2018, 26, 1760–1774. [Google Scholar] [CrossRef] [PubMed]
- Kitware. Vtk.js. 2017. Available online: https://kitware.github.io/vtk-js/ (accessed on 5 June 2020).
- Kitware. ParaView ArcticViewer, The Ultimate Data Viewer. 2019. Available online: https://kitware.github.io/arctic-viewer/ (accessed on 22 July 2020).
- Daly, L.; Brutzman, D. X3D: Extensible 3D graphics standard [standards in a nutshell]. IEEE Signal Process. Mag. 2007, 24, 130–135. [Google Scholar]
- Behr, J.; Eschler, P.; Jung, Y.; Zöllner, M. X3DOM: A DOM-based HTML5/X3D integration model. In Proceedings of the 14th International Conference on 3D Web Technology, Darmstadt, Germany, 16–17 June 2009; Association for Computing Machinery: New York, NY, USA, 2009; pp. 127–135. [Google Scholar]
- Tamm, G.; Slusallek, P. Web-enabled Server-based and Distributed Real-time Ray-Tracing. In EGPGV; Eurographics Association: Goslar, DEU, 2016; pp. 55–67. [Google Scholar]
- Vullo, R.P.; Catalfamo, M.A. Dynamically Generating Virtual Reality Scenes Using Molly and A-Frame. In Proceedings of the International Conference on Internet Computing and Internet of Things (ICOMP’17), Las Vegas, NV, USA, 17–20 July 2017; pp. 21–24. Available online: https://csce.ucmss.com/cr/books/2017/LFS/CSREA2017/ICM3266.pdf (accessed on 20 July 2020).
- Liu, Z.; Jiang, B.; Heer, J. imMens: Real-time visual querying of big data. In Computer Graphics Forum; Wiley Online Library: Hoboken, NJ, USA, 2013; Volume 32, pp. 421–430. [Google Scholar]
- Falk, M.; Grottel, S.; Krone, M.; Reina, G. Interactive gpu-based visualization of large dynamic particle data. Synth. Lect. Vis. 2016, 4, 1–121. [Google Scholar] [CrossRef]
- Lee, G.h.; Nam, J.h.; Han, H.s.; Kwon, S.c. A Study on 3D File Format for Web-based Scientific Visualization. Int. J. Adv. Cult. Technol. 2019, 7, 243–247. [Google Scholar]
- Mobeen, M.M.; Feng, L. Mobile visualization of biomedical volume datasets. J. Internet Technol. Secur. Trans. 2012, 1, 52–60. [Google Scholar] [CrossRef]
- Mani, G.; Li, W. 3D web based surgical training through comparative analysis. In Proceedings of the 18th International Conference on 3D Web Technology, Sebastian, Spain, 20–22 June 2013; pp. 83–86. [Google Scholar]
- Haehn, D. Slice: Drop: Collaborative medical imaging in the browser. In ACM SIGGRAPH 2013 Computer Animation Festival; Association for Computing Machinery: New York, NY, USA, 2013; p. 1. [Google Scholar]
- Virag, I.; Stoicu-Tivadar, L.; Amăricăi, E. Browser-based medical visualization system. In Proceedings of the 2014 IEEE 9th IEEE International Symposium on Applied Computational Intelligence and Informatics (SACI), Timisoara, Romania, 15–17 May 2014; IEEE: Piscataway, NJ, USA, 2014; pp. 355–359. [Google Scholar]
- Sherif, T.; Kassis, N.; Rousseau, M.É.; Adalat, R.; Evans, A.C. BrainBrowser: Distributed, web-based neurological data visualization. Front. Neuroinform. 2015, 8, 89. [Google Scholar] [CrossRef] [PubMed] [Green Version]
- Halle, M.; Demeusy, V.; Kikinis, R. The open anatomy browser: A collaborative web-based viewer for interoperable anatomy atlases. Front. Neuroinform. 2017, 11, 22. [Google Scholar] [CrossRef] [Green Version]
- Haehn, D.; Hoffer, J.; Matejek, B.; Suissa-Peleg, A.; Al-Awami, A.K.; Kamentsky, L.; Gonda, F.; Meng, E.; Zhang, W.; Schalek, R.; et al. Scalable interactive visualization for connectomics. In Informatics; Multidisciplinary Digital Publishing Institute: Basel, Switzerland, 2017; Volume 4, p. 29. [Google Scholar]
- Qiao, L.; Chen, X.; Zhang, Y.; Zhang, J.; Wu, Y.; Li, Y.; Mo, X.; Chen, W.; ** framework for visualizations. Eur. Phys. J. Spec. Top. 2019, 227, 1817–1829. [Google Scholar] [CrossRef]
- Wang, J.; Youkharibache, P.; Zhang, D.; Lanczycki, C.J.; Geer, R.C.; Madej, T.; Phan, L.; Ward, M.; Lu, S.; Marchler, G.H.; et al. iCn3D, a web-based 3D viewer for sharing 1D/2D/3D representations of biomolecular structures. Bioinformatics 2020, 36, 131–135. [Google Scholar] [CrossRef] [Green Version]
- Cassidy, K.C.; Šefčík, J.; Raghav, Y.; Chang, A.; Durrant, J.D. ProteinVR: Web-based molecular visualization in virtual reality. PLoS Comput. Biol. 2020, 16, e1007747. [Google Scholar] [CrossRef]
- Cignoni, P.; Callieri, M.; Corsini, M.; Dellepiane, M.; Ganovelli, F.; Ranzuglia, G. MeshLab: An Open-Source Mesh Processing Tool. In Eurographics Italian Chapter Conference; Scarano, V., Chiara, R.D., Erra, U., Eds.; The Eurographics Association: Allaville, Switzerland, 2008. [Google Scholar] [CrossRef]
- Chandler, J.; Obermaier, H.; Joy, K.I. WebGL-Enabled Remote Visualization of Smoothed Particle Hydrodynamics Simulations; EuroVis: Geneve, Switzerland, 2015. [Google Scholar]
- McCauley, T. A browser-based event display for the CMS Experiment at the LHC using WebGL. J. Phys. Conf. Ser. 2017, 898, 072030. [Google Scholar] [CrossRef]
- Yeh, A. Programming driven 3D modeling on the web. In Proceedings of the 22nd International Conference on 3D Web Technology, Brisbane, Australia, 5–8 June 2017; pp. 1–9. [Google Scholar]
- Diblen, F.; Attema, J.; Bakhshi, R.; Caron, S.; Hendriks, L.; Stienen, B. SPOT: Open Source framework for scientific data repository and interactive visualization. SoftwareX 2019, 9, 328–331. [Google Scholar] [CrossRef]
- Lupinetti, K.; Cabiddu, D.; Giannini, F.; Monti, M. CAD3A: A web-based application to visualize and semantically enhance CAD assembly models. In Proceedings of the 2019 15th International Conference on Signal-Image Technology & Internet-Based Systems (SITIS), Sorrento, Italy, 26–29 November 2019; IEEE: Piscataway, NJ, USA, 2019; pp. 462–469. [Google Scholar]
- Bracci, M.; Tarini, M.; Pietroni, N.; Livesu, M.; Cignoni, P. HexaLab. net: An online viewer for hexahedral meshes. Comput. Aided Des. 2019, 110, 24–36. [Google Scholar] [CrossRef] [Green Version]
- Kaboudian, A.; Cherry, E.M.; Fenton, F.H. Large-scale interactive numerical experiments of chaos, solitons and fractals in real time via GPU in a web browser. Chaos Solitons Fractals 2019, 121, 6–29. [Google Scholar]
- Figueiras, E.; Olivieri, D.N.; Paredes, A.; Michinel, H. QMwebJS—An Open Source Software Tool to Visualize and Share Time-Evolving Three-Dimensional Wavefunctions. Mathematics 2020, 8, 430. [Google Scholar]
- Potenziani, M.; Callieri, M.; Dellepiane, M.; Corsini, M.; Ponchio, F.; Scopigno, R. 3DHOP: 3D heritage online presenter. Comput. Graph. 2015, 52, 129–141. [Google Scholar]
- Müller, R.D.; Qin, X.; Sandwell, D.T.; Dutkiewicz, A.; Williams, S.E.; Flament, N.; Maus, S.; Seton, M. The GPlates portal: Cloud-based interactive 3D visualization of global geophysical and geological data in a web browser. PLoS ONE 2016, 11, e0150883. [Google Scholar]
- Koeva, M.; Luleva, M.; Maldjanski, P. Integrating spherical panoramas and maps for visualization of cultural heritage objects using virtual reality technology. Sensors 2017, 17, 829. [Google Scholar]
- Koeva, M. 3D modelling and interactive web-based visualization of cultural heritage objects. Int. Arch. Photogramm. Remote Sens. Spat. Inf. Sci. 2016, 41, 297–303. [Google Scholar]
- Li, W.; Wang, S. PolarGlobe: A web-wide virtual globe system for visualizing multidimensional, time-varying, big climate data. Int. J. Geogr. Inf. Sci. 2017, 31, 1562–1582. [Google Scholar]
- Evangelidis, K.; Papadopoulos, T.; Papatheodorou, K.; Mastorokostas, P.; Hilas, C. 3D geospatial visualizations: Animation and motion effects on spatial objects. Comput. Geosci. 2018, 111, 200–212. [Google Scholar]
- Discher, S.; Richter, R.; Döllner, J. A scalable webGL-based approach for visualizing massive 3D point clouds using semantics-dependent rendering techniques. In Proceedings of the 23rd International ACM Conference on 3D Web Technology, Poznań, Poland, 20–22 June 2018; pp. 1–9. [Google Scholar]
- Liu, D.; Peng, J.; Wang, Y.; Huang, M.; He, Q.; Yan, Y.; Ma, B.; Yue, C.; **e, Y. Implementation of interactive three-dimensional visualization of air pollutants using WebGL. Environ. Model. Softw. 2019, 114, 188–194. [Google Scholar]
- Liu, L.; Silver, D.; Bemis, K. Visualizing three-dimensional ocean eddies in web browsers. IEEE Access 2019, 7, 44734–44747. [Google Scholar]
- Boutsi, A.M.; Ioannidis, C.; Soile, S. An Integrated Approach to 3D Web Visualization of Cultural Heritage Heterogeneous Datasets. Remote Sens. 2019, 11, 2508. [Google Scholar] [CrossRef] [Green Version]
- Desprat, C.; Jessel, J.P.; Luga, H. A 3D collaborative editor using WebGL and WebRTC. In Proceedings of the 20th International Conference on 3D Web Technology, Heraklion, Greece, 18–21 June 2015; pp. 157–158. [Google Scholar]
- Hadjar, H.; Meziane, A.; Gherbi, R.; Setitra, I.; Aouaa, N. WebVR based interactive visualization of open health data. In Proceedings of the 2nd International Conference on Web Studies, Samara, Russia, 26–27 November 2018; pp. 56–63. [Google Scholar]
- Yang, W.; Tao, Y.; Lin, H. Voxer—A platform for creating, customizing, and sharing scientific visualizations. J. Vis. 2019, 22, 1161–1176. [Google Scholar] [CrossRef]
- Matelsky, J.K.; Downs, J.; Cowley, H.P.; Wester, B.; Gray-Roncal, W. A substrate for modular, extensible data-visualization. Big Data Anal. 2020, 5, 1. [Google Scholar] [CrossRef] [Green Version]
- Qualter, J.; Sculli, F.; Oliker, A.; Napier, Z.; Lee, S.; Garcia, J.; Frenkel, S.; Harnik, V.; Triola, M. The biodigital human: A web-based 3D platform for medical visualization and education. Stud. Health Technol. Inform. 2012, 173, 359–361. [Google Scholar]
- Violante, M.G.; Vezzetti, E. Design and implementation of 3D Web-based interactive medical devices for educational purposes. Int. J. Interact. Des. Manuf. IJIDeM 2017, 11, 31–44. [Google Scholar] [CrossRef] [Green Version]
- Smit, N.; Hofstede, C.W.; Kraima, A.; Jansma, D.; deRuiter, M.; Eisemann, E.; Vilanova, A. The online anatomical human: Web-based anatomy education. Proc. Eurogr. Educ. Pap. 2016, 2016, 37–40. [Google Scholar]
- Petersson, H.; Sinkvist, D.; Wang, C.; Smedby, Ö. Web-based interactive 3D visualization as a tool for improved anatomy learning. Anat. Sci. Educ. 2009, 2, 61–68. [Google Scholar]
- Birr, S.; Mönch, J.; Sommerfeld, D.; Preim, U.; Preim, B. The LiverAnatomyExplorer: A WebGL-based surgical teaching tool. IEEE Comput. Graph. Appl. 2013, 33, 48–58. [Google Scholar]
- Preim, B.; Saalfeld, P. A survey of virtual human anatomy education systems. Comput. Graph. 2018, 71, 132–153. [Google Scholar]
- John, N.W. The impact of Web3D technologies on medical education and training. Comput. Educ. 2007, 49, 19–31. [Google Scholar] [CrossRef]
- Jacinto, H.; Kéchichian, R.; Desvignes, M.; Prost, R.; Valette, S. A web interface for 3D visualization and interactive segmentation of medical images. In Proceedings of the 17th International Conference on 3D Web Technology, Los Angeles, CA, USA, 4–5 August 2012; pp. 51–58. [Google Scholar]
- Jiménez, J.; López, A.; Cruz, J.; Esteban, F.J.; Navas, J.; Villoslada, P.; de Miras, J.R. A Web platform for the interactive visualization and analysis of the 3D fractal dimension of MRI data. J. Biomed. Inform. 2014, 51, 176–190. [Google Scholar] [CrossRef] [PubMed] [Green Version]
- Marion, C.; Jomier, J. Real-time collaborative scientific WebGL visualization with WebSocket. In Proceedings of the 17th International Conference on 3D Web Technology, Los Angeles, CA, USA, 4–5 August 2012; pp. 47–50. [Google Scholar]
- Noguera, J.M.; Jiménez, J.R. Visualization of Very Large 3D Volumes on Mobile Devices and WebGL. Available online: http://wscg.zcu.cz/WSCG2012/short/B71-full.pdf (accessed on 8 August 2020).
- Arbelaiz, A.; Moreno, A.; Kabongo, L.; García-Alonso, A. Volume visualization tools for medical applications in ubiquitous platforms. In eHealth 360; Springer: Berlin/Heidelberg, Germany, 2017; pp. 443–450. [Google Scholar]
- Hou, X.; Sun, J.; Zhang, J. A web-based solution for 3D medical image visualization. In Medical Imaging 2015: PACS and Imaging Informatics: Next Generation and Innovations; SPIE: Orlando, FL, USA, 2015; Volume 9418, p. 941810. [Google Scholar]
- Lorensen, W.E.; Cline, H.E. Marching cubes: A high resolution 3D surface construction algorithm. ACM Siggraph Comput. Graph. 1987, 21, 163–169. [Google Scholar] [CrossRef]
- Ashwini, A.; Kwon, J. Image processing pipeline for web-based real-time 3d visualization of teravoxel volumes. In Proceedings of the International Conference on Data Mining and Big Data, Shanghai, China, June 17–22, 2018; Springer: Berlin/Heidelberg, Germany, 2018; pp. 203–212. [Google Scholar]
- Haehn, D.; Franke, L.; Zhang, F.; Karayumak, S.C.; Pieper, S.; O’Donnell, L.; Rathi, Y. TRAKO: Efficient Transmission of Tractography Data for Visualization. ar**v 2020, ar**v:2004.13630. [Google Scholar]
- Mwalongo, F.; Krone, M.; Reina, G.; Ertl, T. State-of-the-Art Report in Web-based Visualization. In Computer Graphics Forum, Wiley Online Library; Eurographics Association: Geneve, Switzerland, 2016; Volume 35, pp. 553–575. [Google Scholar]
- Callieri, M.; Andrei, R.M.; Di Benedetto, M.; Zoppè, M.; Scopigno, R. Visualization methods for molecular studies on the web platform. In Proceedings of the 15th International Conference on Web 3D Technology, Los Angeles, CA, USA, 24–25 July 2010; pp. 117–126. [Google Scholar]
- Rose, A.S.; Bradley, A.R.; Valasatava, Y.; Duarte, J.M.; Prlić, A.; Rose, P.W. Web-based molecular graphics for large complexes. In Proceedings of the 21st International Conference on Web3D Technology, Anaheim, CA, USA, 22–24 July 2016; pp. 185–186. [Google Scholar]
- Jiang, C.; **, X.; Dong, Y.; Chen, M. Kekule. js: An open source javascript chemoinformatics toolkit. J. Chem. Inf. Model. 2016, 56, 1132–1138. [Google Scholar] [CrossRef] [PubMed]
- Tiemann, J.K.; Guixa-Gonzalez, R.; Hildebrand, P.W.; Rose, A.S. MDsrv: Viewing and sharing molecular dynamics simulations on the web. Nat. Methods 2017, 14, 1123–1124. [Google Scholar] [CrossRef]
- Hildebrand, P.W.; Rose, A.S.; Tiemann, J.K. Bringing molecular dynamics simulation data into view. Trends Biochem. Sci. 2019, 44, 902–913. [Google Scholar] [CrossRef] [Green Version]
- Abriata, L.A. Web apps come of age for molecular sciences. In Informatics; Multidisciplinary Digital Publishing Institute: Basel, Switzerland, 2017; Volume 4, p. 28. [Google Scholar]
- Martinez, X.; Krone, M.; Alharbi, N.; Rose, A.S.; Laramee, R.S.; O’Donoghue, S.; Baaden, M.; Chavent, M. Molecular graphics: Bridging structural biologists and computer scientists. Structure 2019, 27, 1617–1623. [Google Scholar] [CrossRef]
- Yuan, S.; Chan, H.S.; Hu, Z. Implementing WebGL and HTML5 in macromolecular visualization and modern computer-aided drug design. Trends Biotechnol. 2017, 35, 559–571. [Google Scholar] [CrossRef]
- Berman, H.M.; Westbrook, J.; Feng, Z.; Gilliland, G.; Bhat, T.N.; Weissig, H.; Shindyalov, I.N.; Bourne, P.E. The protein data bank. Nucleic Acids Res. 2000, 28, 235–242. [Google Scholar] [CrossRef] [Green Version]
- Burley, S.K.; Berman, H.M.; Christie, C.; Duarte, J.M.; Feng, Z.; Westbrook, J.; Young, J.; Zardecki, C. RCSB Protein Data Bank: Sustaining a living digital data resource that enables breakthroughs in scientific research and biomedical education. Protein Sci. 2018, 27, 316–330. [Google Scholar] [CrossRef] [Green Version]
- Berman, H.M.; Olson, W.K.; Beveridge, D.L.; Westbrook, J.; Gelbin, A.; Demeny, T.; Hsieh, S.H.; Srinivasan, A.; Schneider, B. The nucleic acid database. A comprehensive relational database of three-dimensional structures of nucleic acids. Biophys. J. 1992, 63, 751. [Google Scholar] [CrossRef] [Green Version]
- Li, S.; Olson, W.K.; Lu, X.J. Web 3DNA 2.0 for the analysis, visualization, and modeling of 3D nucleic acid structures. Nucleic Acids Res. 2019, 47, W26–W34. [Google Scholar] [CrossRef] [PubMed] [Green Version]
- Sedova, M.; Iyer, M.; Li, Z.; Jaroszewski, L.; Post, K.W.; Hrabe, T.; Porta-Pardo, E.; Godzik, A. Cancer3D 2.0: Interactive analysis of 3D patterns of cancer mutations in cancer subsets. Nucleic Acids Res. 2019, 47, D895–D899. [Google Scholar] [CrossRef] [PubMed] [Green Version]
- Sedova, M.; Jaroszewski, L.; Godzik, A. Protael: Protein data visualization library for the web. Bioinformatics 2016, 32, 602–604. [Google Scholar] [CrossRef] [Green Version]
- Figueiras, E.; Olivieri, D.; Paredes, A.; Michinel, H. QMBlender: Particle-based visualization of 3D quantum wave function dynamics. J. Comput. Sci. 2019, 35, 44–56. [Google Scholar] [CrossRef]
- Community, B.O. Blender—A 3D Modelling and Rendering Package; Blender Foundation; Stichting Blender Foundation: Amsterdam, The Netherlands, 2018. [Google Scholar]
- Kent, B.R. 3D Scientific Visualization With Blender; Morgan & Claypool Publishers: San Rafael, CA, USA, 2015. [Google Scholar]
- Ghaffar, M.; Biere, N.; Jäger, D.; Klein, K.; Schreiber, F.; Kruse, O.; Sommer, B. 3D modelling and visualisation of heterogeneous cell membranes in Blender. In Proceedings of the 11th International Symposium on Visual Information Communication and Interaction, Växjö, Sweden, 13–15 August 2018; pp. 64–71. [Google Scholar]
- Ihmsen, M.; Akinci, N.; Akinci, G.; Teschner, M. Unified spray, foam and air bubbles for particle-based fluids. Vis. Comput. 2012, 28, 669–677. [Google Scholar] [CrossRef]
- Naiman, J. AstroBlend: An astrophysical visualization package for Blender. Astron. Comput. 2016, 15, 50–60. [Google Scholar] [CrossRef] [Green Version]
- Rajendiran, N.; Durrant, J.D. Pyrite: A blender plugin for visualizing molecular dynamics simulations using industry-standard rendering techniques. J. Comput. Chem. 2018, 39, 748–755. [Google Scholar] [CrossRef]
- Rene, K.M.; Jeff Gay, M.M. OpenJSCAD. 2019. Available online: https://openjscad.org/ (accessed on 3 July 2020).
- Dykes, T.; Hassan, A.; Gheller, C.; Croton, D.; Krokos, M. Interactive 3D visualization for theoretical virtual observatories. Mon. Not. R. Astron. Soc. 2018, 477, 1495–1507. [Google Scholar] [CrossRef]
- Dolag, K.; Reinecke, M.; Gheller, C.; Imboden, S. Splotch: Visualizing cosmological simulations. New J. Phys. 2008, 10, 125006. [Google Scholar] [CrossRef]
- Bertin, E.; Pillay, R.; Marmo, C. Web-based visualization of very large scientific astronomy imagery. Astron. Comput. 2015, 10, 43–53. [Google Scholar]
- Rosenfield, P.; Fay, J.; Gilchrist, R.K.; Cui, C.; Weigel, A.D.; Robitaille, T.; Otor, O.J.; Goodman, A. AAS WorldWide telescope: A seamless, cross-platform data visualization engine for astronomy research, education, and democratizing data. Astrophys. J. Suppl. Ser. 2018, 236, 22. [Google Scholar]
- Pomarède, D.; Courtois, H.M.; Hoffman, Y.; Tully, R.B. Cosmography and data visualization. Publ. Astron. Soc. Pac. 2017, 129, 058002. [Google Scholar]
- Pomarede, D.; Hoffman, Y.; Courtois, H.M.; Tully, R.B. The Cosmic V-Web. Astrophys. J. 2017, 845, 55. [Google Scholar]
- Feng, L.; Wang, C.; Li, C.; Li, Z. A research for 3D WebGIS based on WebGL. In Proceedings of 2011 International Conference on Computer Science and Network Technology, Harbin, China, 24–26 December 2011; IEEE: Piscataway, NJ, USA, 2011; Volume 1, pp. 348–351. [Google Scholar]
- Loesch, B.; Christen, M.; Nebiker, S. OpenWebGlobe–an open source SDK for creating large-scale virtual globes on a WebGL basis. Int. Arch. Photogramm. Remote Sens. Spat. Inf. Sci. 2012, 39, B4. [Google Scholar] [CrossRef] [Green Version]
- Graphics, A. Cesium–WebGL Virtual Globe and Map Engine. 2013. Available online: https://cesium.com/cesiumjs/ (accessed on 17 June 2020).
- Krämer, M.; Gutbell, R. A case study on 3D geospatial applications in the web using state-of-the-art WebGL frameworks. In Proceedings of the 20th International Conference on 3D Web Technology, Heraklion, Greece, 18–21 June 2015; pp. 189–197. [Google Scholar]
- Miao, R.; Song, J.; Zhu, Y. 3D geographic scenes visualization based on WebGL. In Proceedings of the 2017 6th International Conference on Agro-Geoinformatics, Fairfax, VA, USA, 7–10 August 2017; IEEE: Piscataway, NJ, USA, 2017; pp. 1–6. [Google Scholar]
- Resch, B.; Wohlfahrt, R.; Wosniok, C. Web-based 4D visualization of marine geo-data using WebGL. Cartogr. Geogr. Inf. Sci. 2014, 41, 235–247. [Google Scholar]
- Galeazzi, F.; Callieri, M.; Dellepiane, M.; Charno, M.; Richards, J.; Scopigno, R. Web-based visualization for 3D data in archaeology: The ADS 3D viewer. J. Archaeol. Sci. Rep. 2016, 9, 1–11. [Google Scholar]
- Raji, M.; Hota, A.; Huang, J. Scalable web-embedded volume rendering. In Proceedings of the 2017 IEEE 7th Symposium on Large Data Analysis and Visualization (LDAV), Phoenix, AZ, USA, 2 October 2017; IEEE: Piscataway, NJ, USA, 2017; pp. 45–54. [Google Scholar]
- Wald, I.; Johnson, G.P.; Amstutz, J.; Brownlee, C.; Knoll, A.; Jeffers, J.; Günther, J.; Navrátil, P. Ospray-a cpu ray tracing framework for scientific visualization. IEEE Trans. Vis. Comput. Graph. 2016, 23, 931–940. [Google Scholar]
- Lavoué, G.; Chevalier, L.; Dupont, F. Streaming compressed 3D data on the web using JavaScript and WebGL. In Proceedings of the 18th international Conference on 3D Web Technology, San Sebastian, Spain, 20–22 June 2013; pp. 19–27. [Google Scholar]
- Tamm, G.; Slusallek, P. Plugin free remote visualization in the browser. In Visualization and Data Analysis 2015; SPIE/IS&T Electronic Imaging: San Francisco, CA, USA, 2015; Volume 9397, p. 939705. [Google Scholar]
Figure 1.
Screenshot of the Open Anatomy Browser with the 3D human head and neck atlas from the projects’ website https://www.openanatomy.org/ [35] showing bones and cartilage in different colors and a cross-sectional panel on the left.
Figure 1.
Screenshot of the Open Anatomy Browser with the 3D human head and neck atlas from the projects’ website https://www.openanatomy.org/ [35] showing bones and cartilage in different colors and a cross-sectional panel on the left.

Figure 2.
Rendered 3D medical images with WebGL-based raycasting algorithms showing different organs: (a) Image of the whole human heart with surrounding tissue, (b) heart without surrounding tissue but with a part of the bones inside the muscles, (c) thorax with the bone structure, and (d) only the bone structures. Source: [47].

Figure 3.
Interactive scenes with zoom, pan, and scroll visualize 3D polygonal mesh reconstructions of a connectomics data set in 3DXP with progressively rendered geometries: (a) Left image shows twenty neurons stretching through a 100 m volume. (b) Cell bodies (soma) and (c) left image shows a dendrite with two synaptic connections. URL: https://github.com/rhoana/3dxp. Source: [36].

Figure 4.
Investigating connectome data from different perspectives in NeuroCave. Left side shows the connectome in the anatomical space and the intrinsic space on the right with color legend right bottom. A neuroscientist is shown in the top of the image exploring the 3D data with a VR headset. Users are allowed to switch between standard and VR modes. Source: [40].

Figure 5.
Gallery with various example screenshots from different interactive web-based molecule viewers. Top from left to right: (1) NGL viewer [67] showing surface of HIV-1 colored by chainindex from http://proteinformatics.charite.de/ngl; (2) Mwalongo et al. [17] displays a papillomavirus with 1.3 M atoms; (3) Web3DMol showing a Myoglobin molecule from a seal [64], retrieved from https://web3dmol.net/; Bottom row from left to right: (1) iview [53] rendering a CCR5 chemokine receptor-HIV entry inhibitor maraviroc complex with the anaglyph effect using chromatically opposite colors for stereoscopic effect; (2) a molecule from PV [50]; (3) iCn3d displaying a tumor suppressor in spectrums color with DNA [70] from https://www.ncbi.nlm.nih.gov/Structure/icn3d/full.html.

Figure 6.
Left: The user interface of the HiC-3DViewer [62] shows chromatin interactions of a Yeast genome where intra- and inter-chromatin interactions are displayed in the form of white straight lines; Right: The user interface of CmPIweb [61] visualizes the citrate cycle and the glycolysis pathway inside an animal cell. The complete cell with pink opacity is shown in the center of the UI with additional glycolysis pathway on the left. Components of the cell like ribosomes, mitochondium, etc. can be selected on the left in different color schemes.

Figure 7.
A few captions from the gallery of the Omicsnet website [65] rendering large biological networks with Three.js. From left to right: (1) A three-dimensional composite network composed of around 2000 nodes and 4000 edges, with halo effect on seeds, enriched pathway highlighted in light blue. (2) Omicsnet showing a force-directed miRNA-gene target network. (3) Zoomed in view the network.

Figure 8.
Examples of web-based visualizations in particle physics. Left: Chandler et al. [73] showing WebGL-based rendering of the gravity-free collision of two spherical fluid elements in two different time steps. Right: Visualization of the decay of hydrogen with the tool QMwebJS [80].

Figure 9.
Examples of VR for physical applications on mobile phones. Left: iSpy WebGL [74] renders a collision event from CERN on a mobile phone in binocular mode. Right: Yeh et al. [75] showing the 3D stereoscopic virtual reality of a helium atom with their tool VRMath2.

Figure 10.
Left: Showing a lightcone visualized by Dykes et al. [134] with spectral energy distribution, where size and intensity are scaled by the stellar mass of the the full volume of 136,298 galaxies interactively at >30 FPS for visual emphasis. Right: Screenshot of the user interface from the World Wide Telescope at http://worldwidetelescope.org/webclient/ with images of our solar system and the sun in the center. The user can interactively explore the sky with different modes and telescope imagery in a 3D environment. Planets from our solar system are rendered with WebGL.

Figure 11.
Sketchfab animation from the work in [139] where colors represent velocities and flows of matter in the universe. Knots are highlighted with redder tones with accelerated motion and bluer tones for less motion of the matter. The image shows a large scale flow pattern in the Shapley Concentration (a supercluster containing the highest number of galaxies in our close universe). Galaxies are attracted by gravitational attractors and and move away from empty regions; More on https://sketchfab.com/pomarede.

Figure 12.
Left: Interactive visualization in the user interface of PolarGlobe showing wind speed on the Earths’ surface with rendered vector data. Screenshot from http://cici.lab.asu.edu/polarglobe/. Right: System demonstration of the graphic user interface of PolarGlobe indicating temperature data with animation and different modes. (a): Temperature in 2012 over the North Pole in panorama view of the Globe; (b1,b2): Animation of temperature data over Greenland in two different points of time; (c): Wind vector data of a winter cyclone; (d): Vertical profile visualization of temperatures; (e): Value picking of temperatures. Source: [85].

Figure 13.
Left: Sea floor map** from GPlates [82] showing the Marianna Arc in the Pacific Ocean. Right: Interface with dat.GUI showing Ocean eddies during the year 2007 close to a coastline. Various ocean eddies are categorized in different colors, yellow depicting cyclonic (water moving counterclockwise) eddies and purple depicting anti-cyclonic eddies (water moving clockwise). Scientist can identify that yellow/cyclonic eddies are more in the south, while purple ones are in primarily located in the north. Source: [89].

Figure 14.
Trend analysis tracking of publications using WebGL since 2011. For individual scientific fields the number of publications containing the keyword WebGL is plotted for each year.
Figure 14.
Trend analysis tracking of publications using WebGL since 2011. For individual scientific fields the number of publications containing the keyword WebGL is plotted for each year.


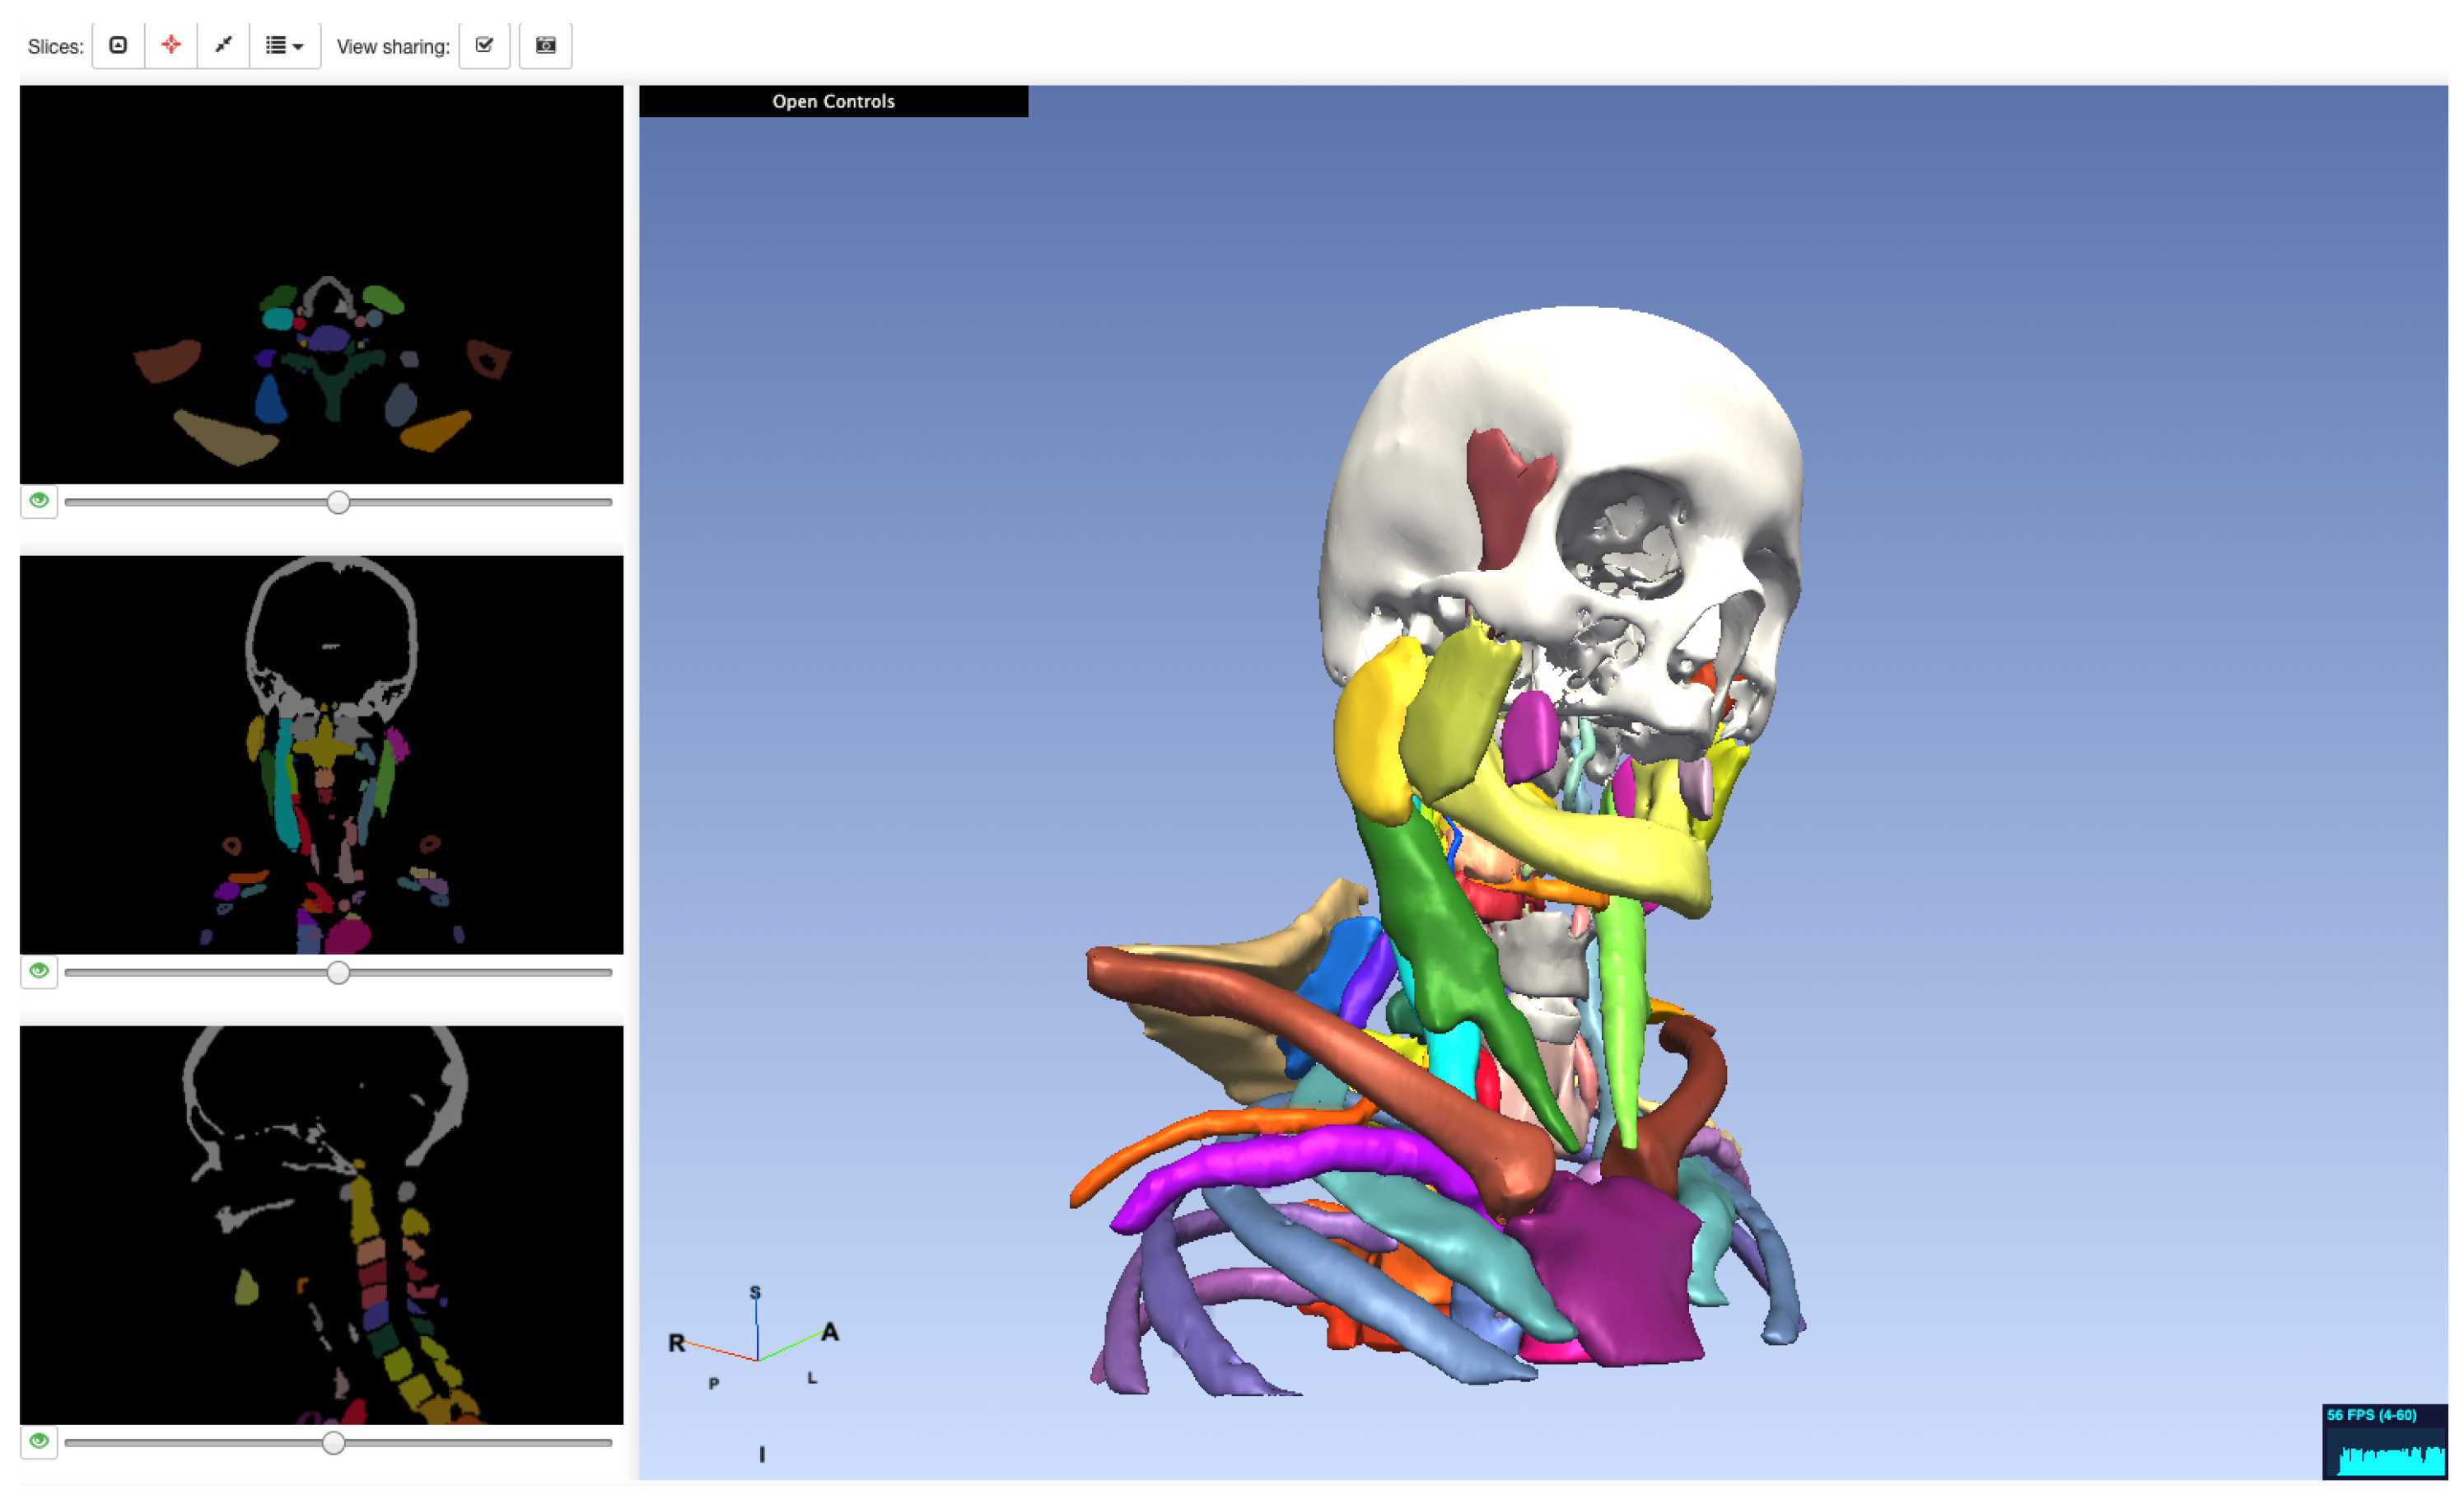
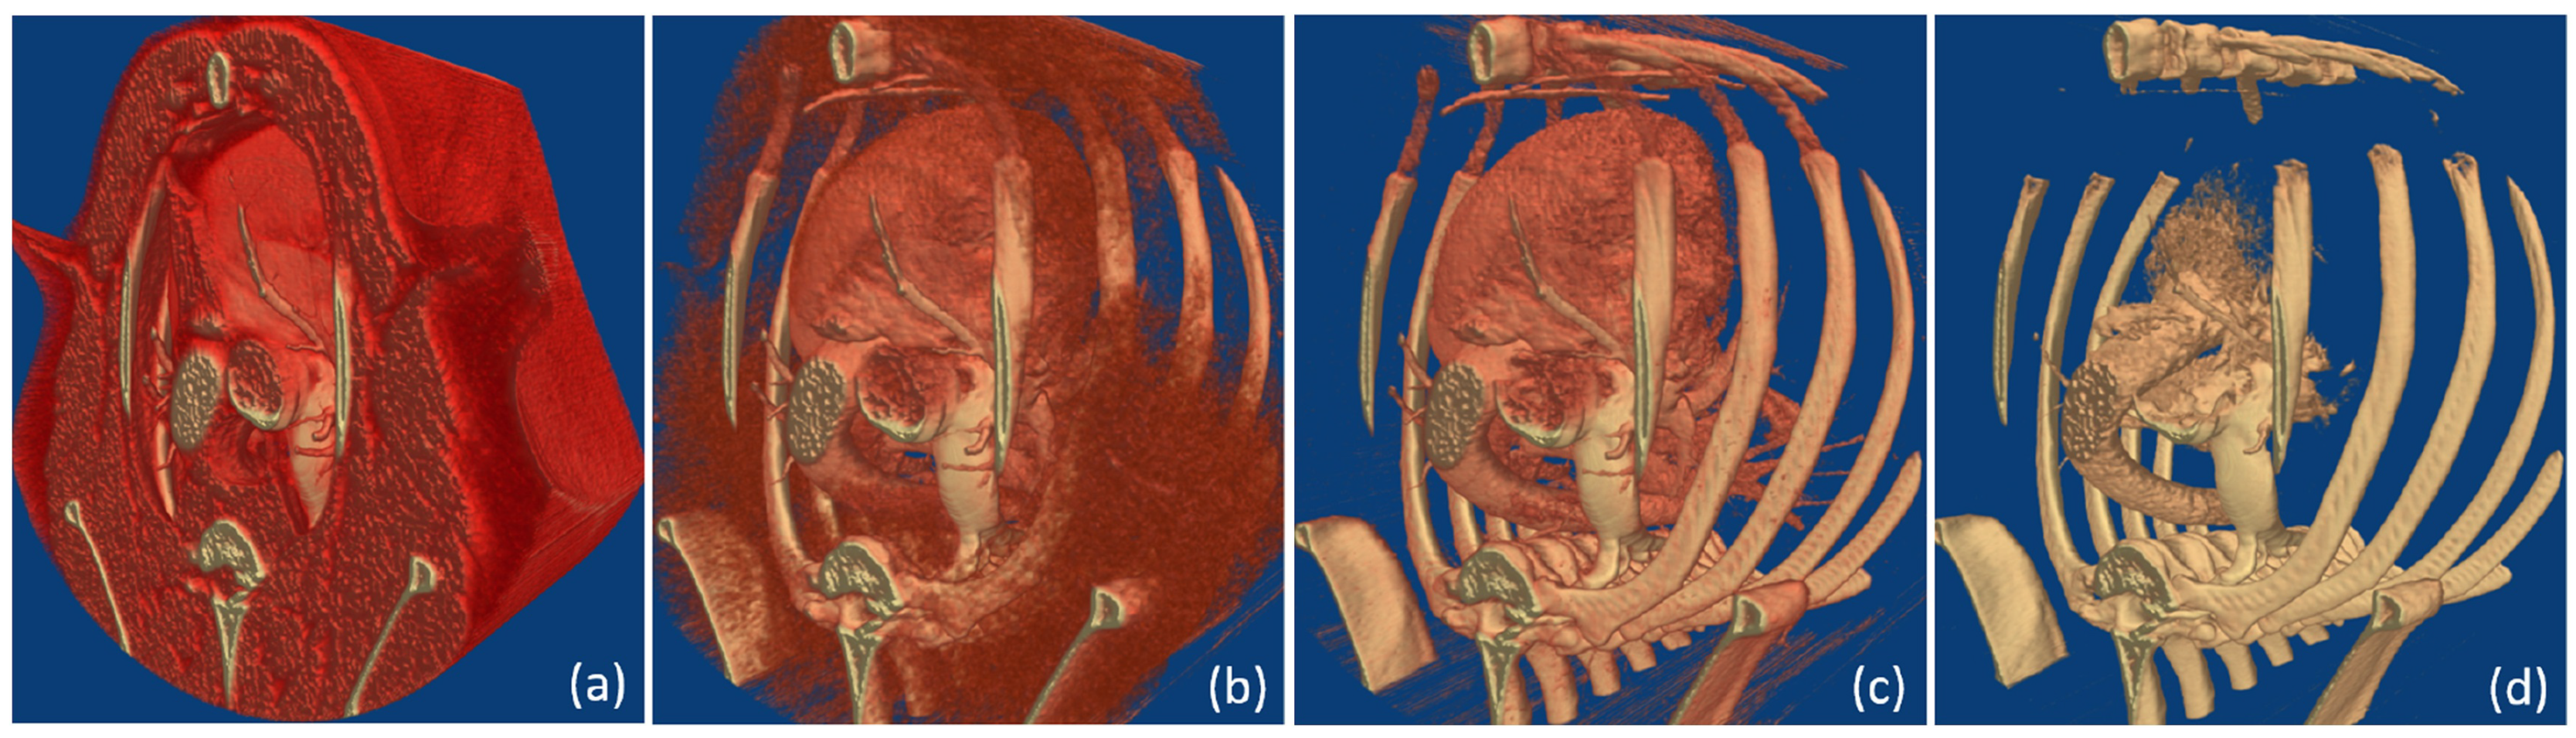
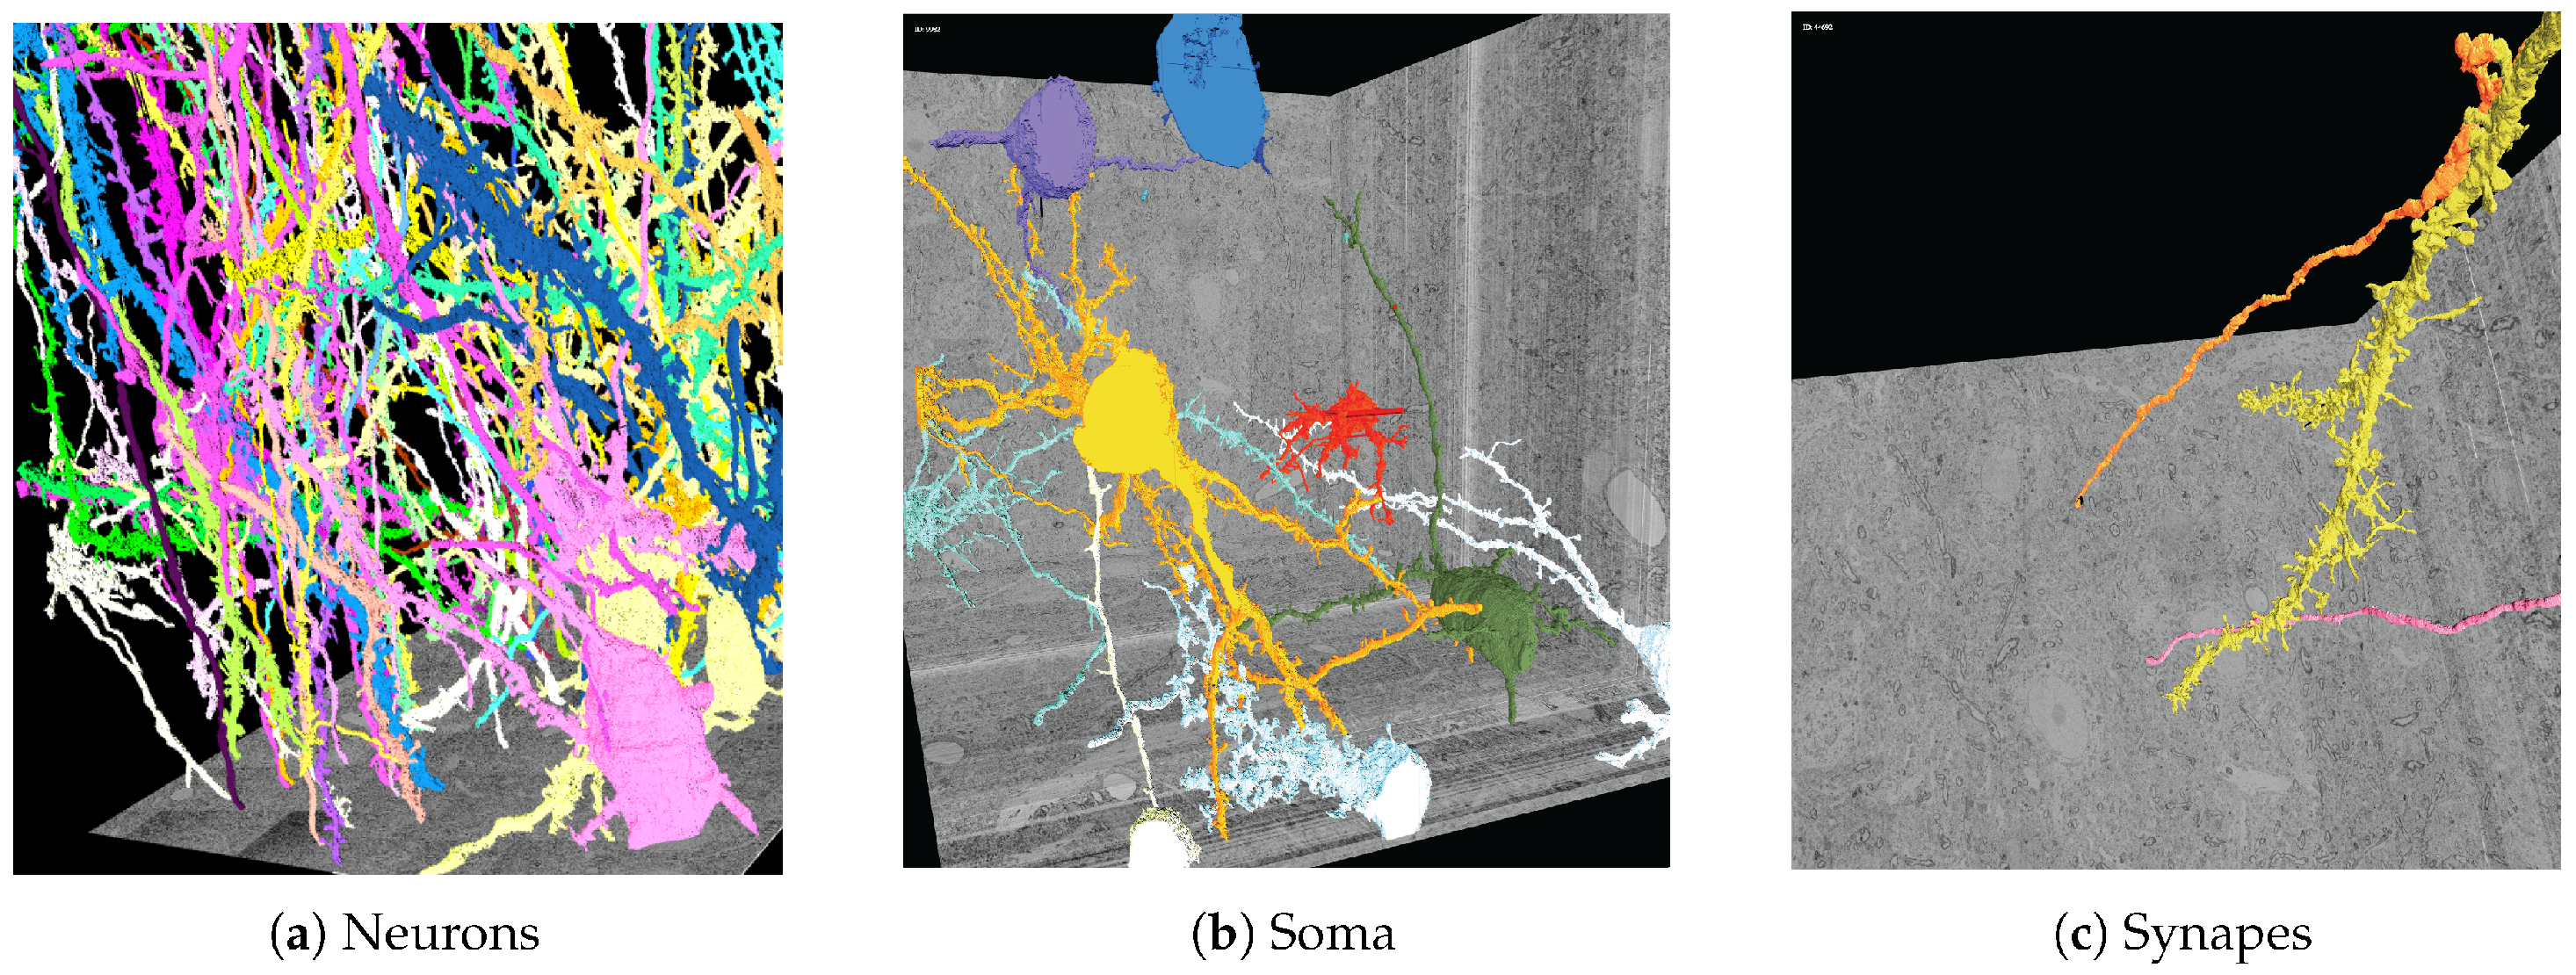
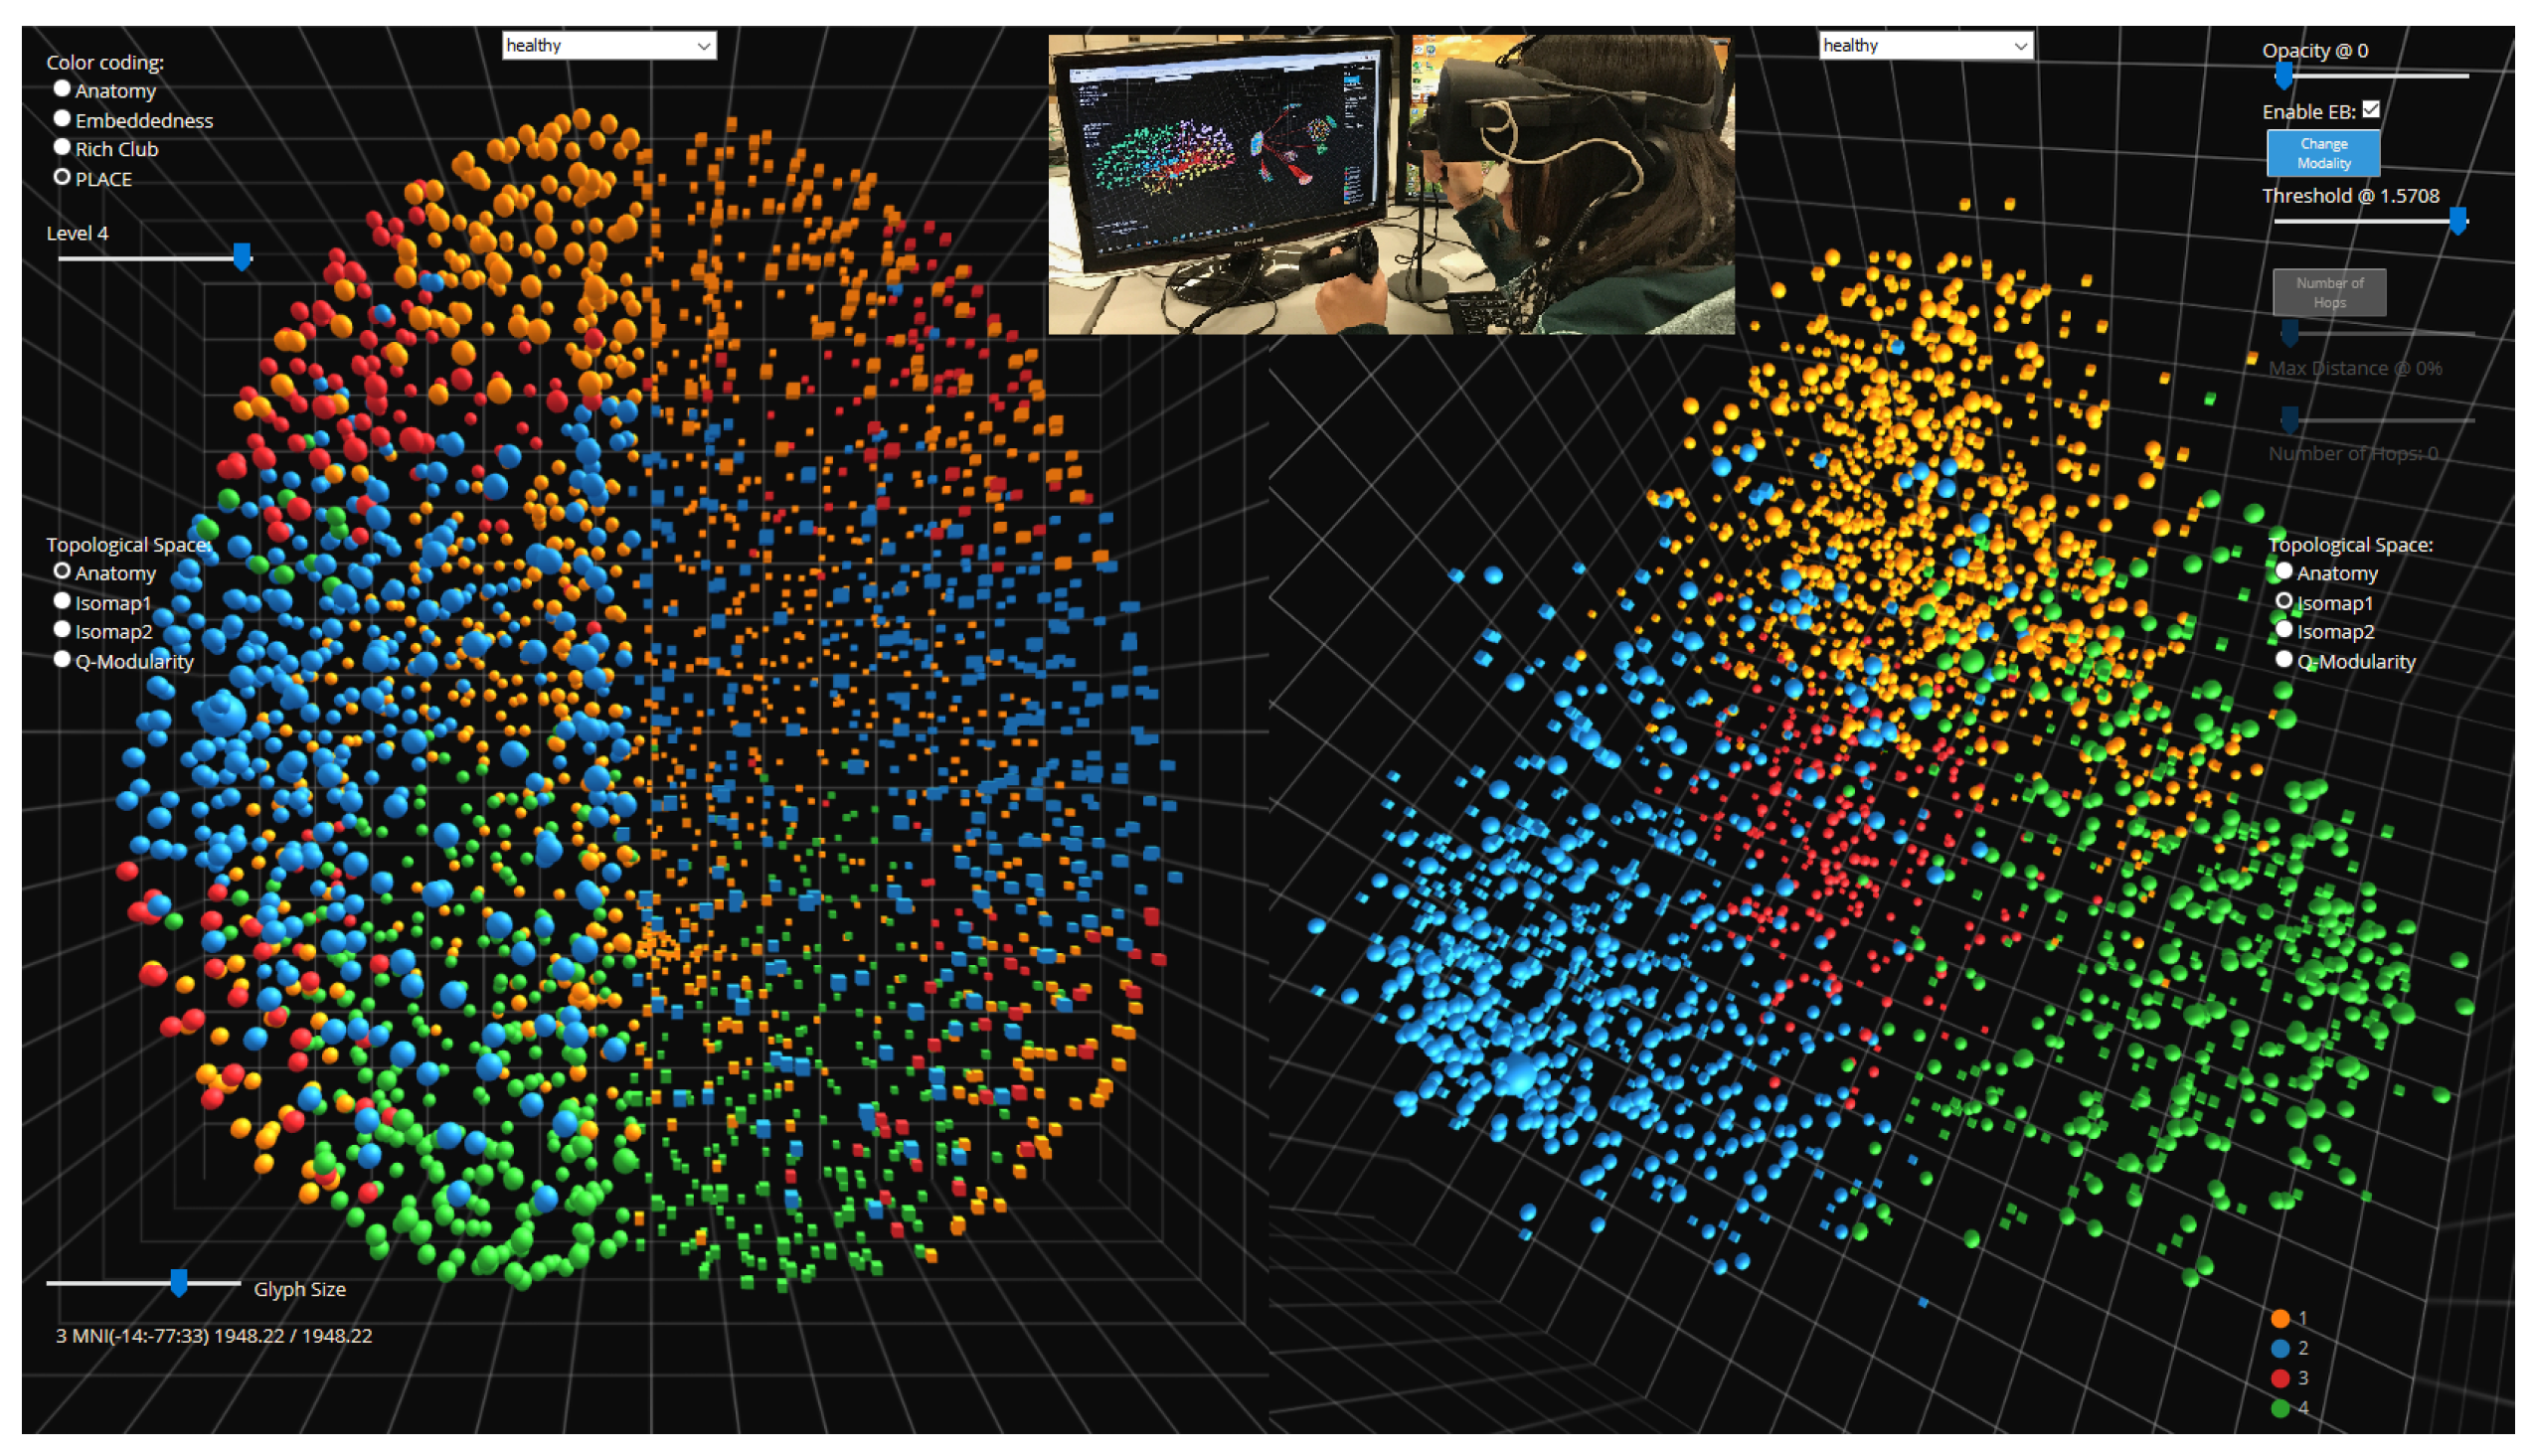
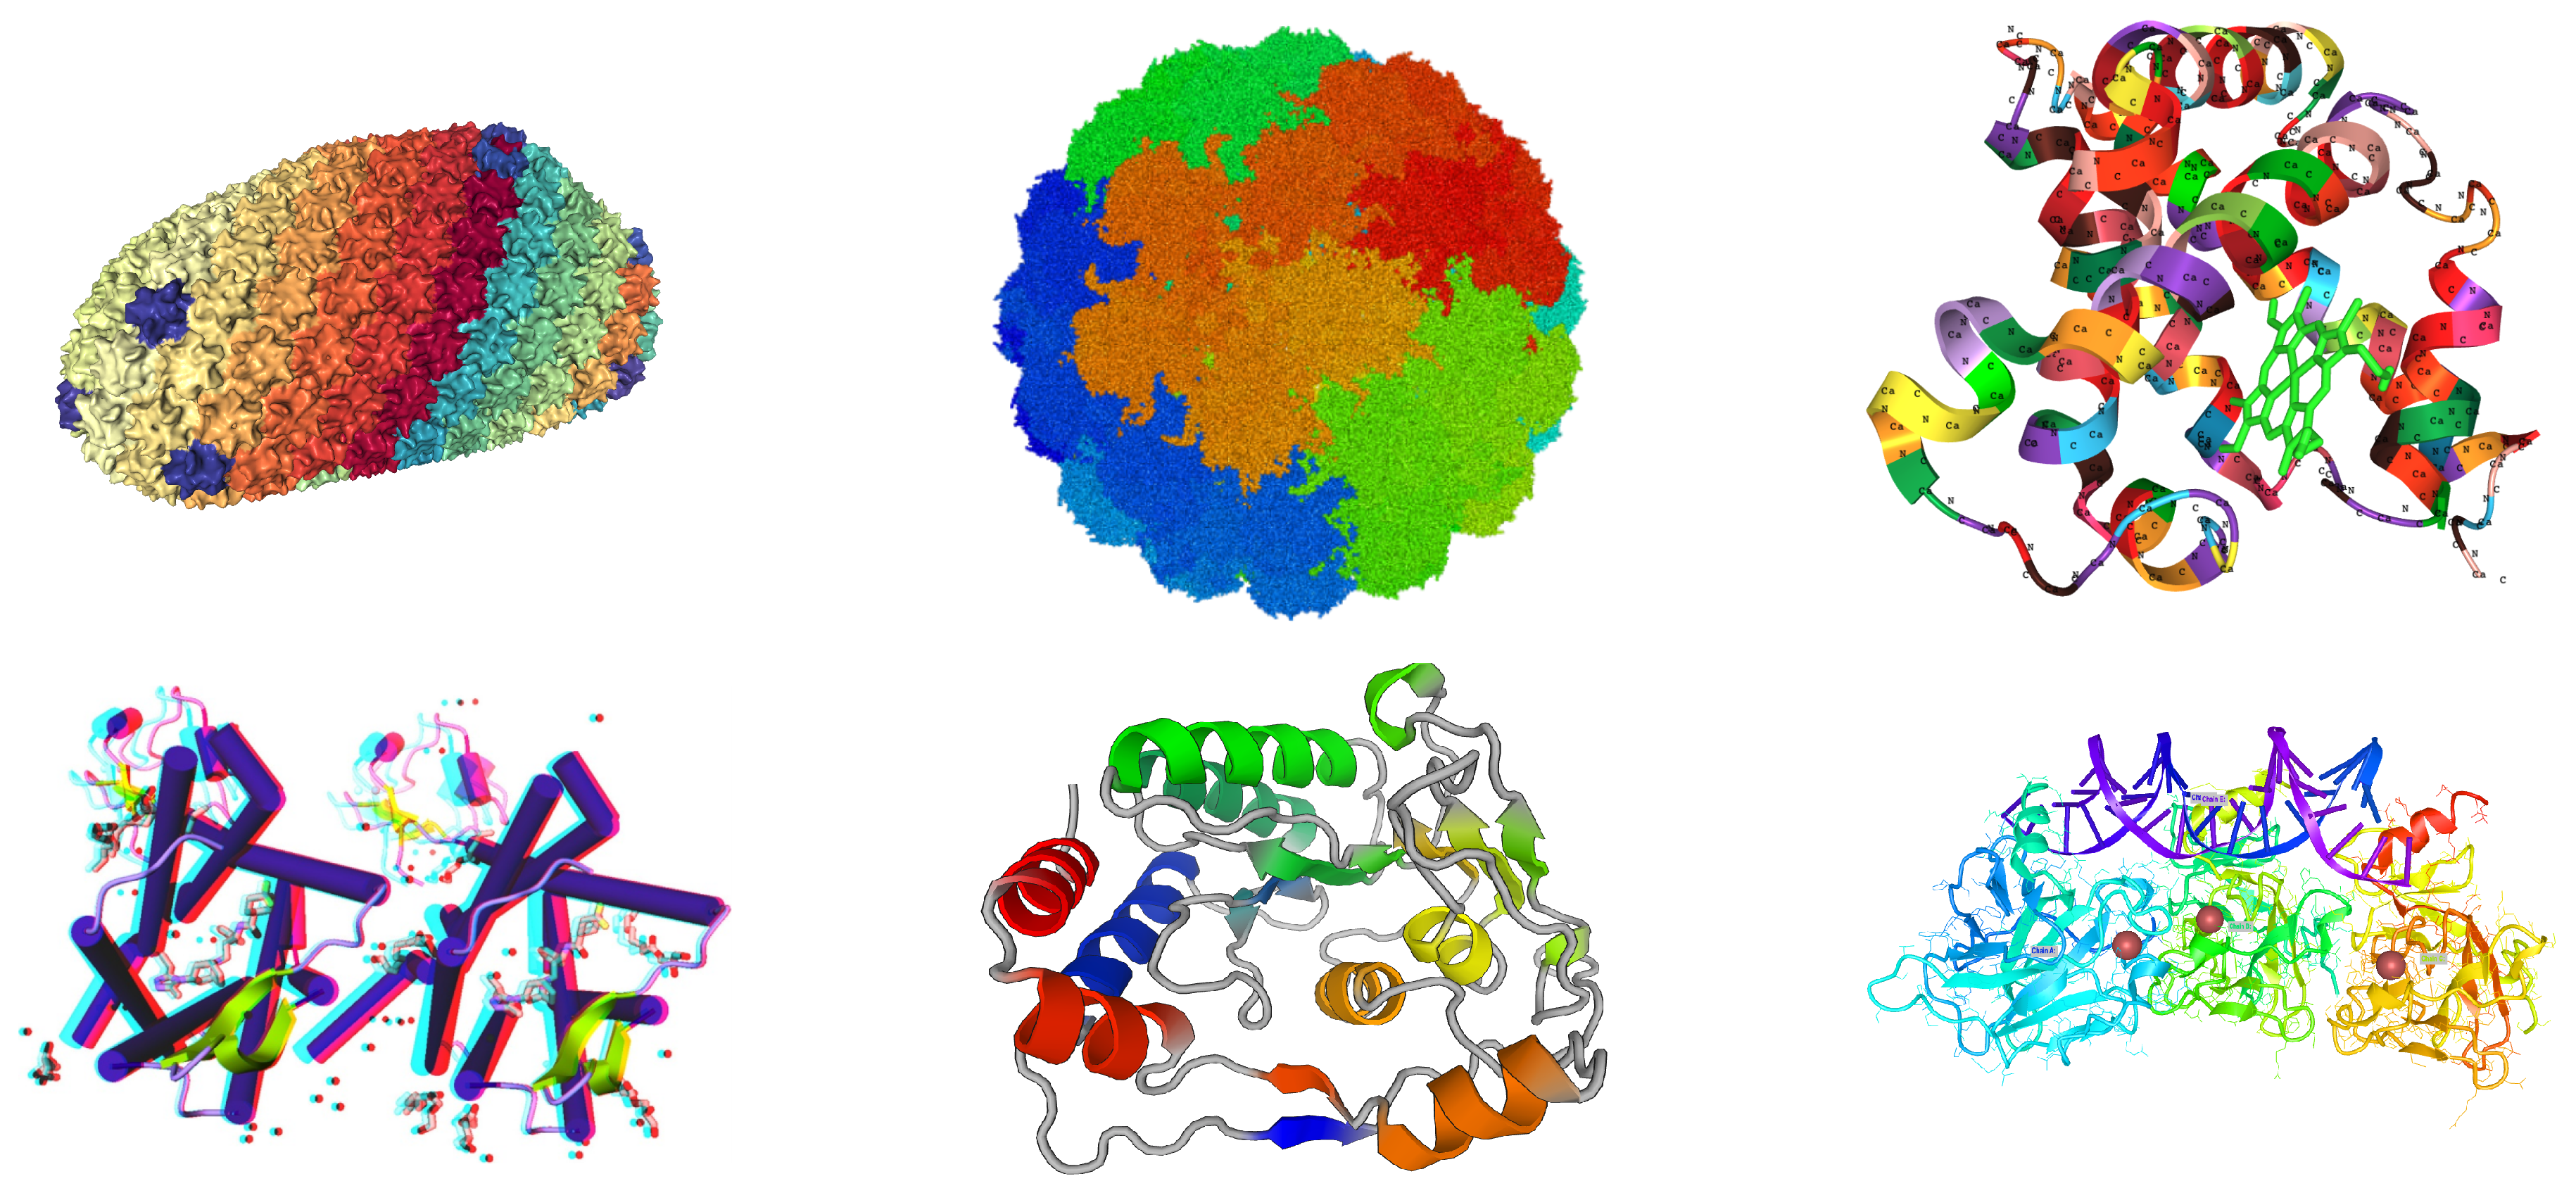
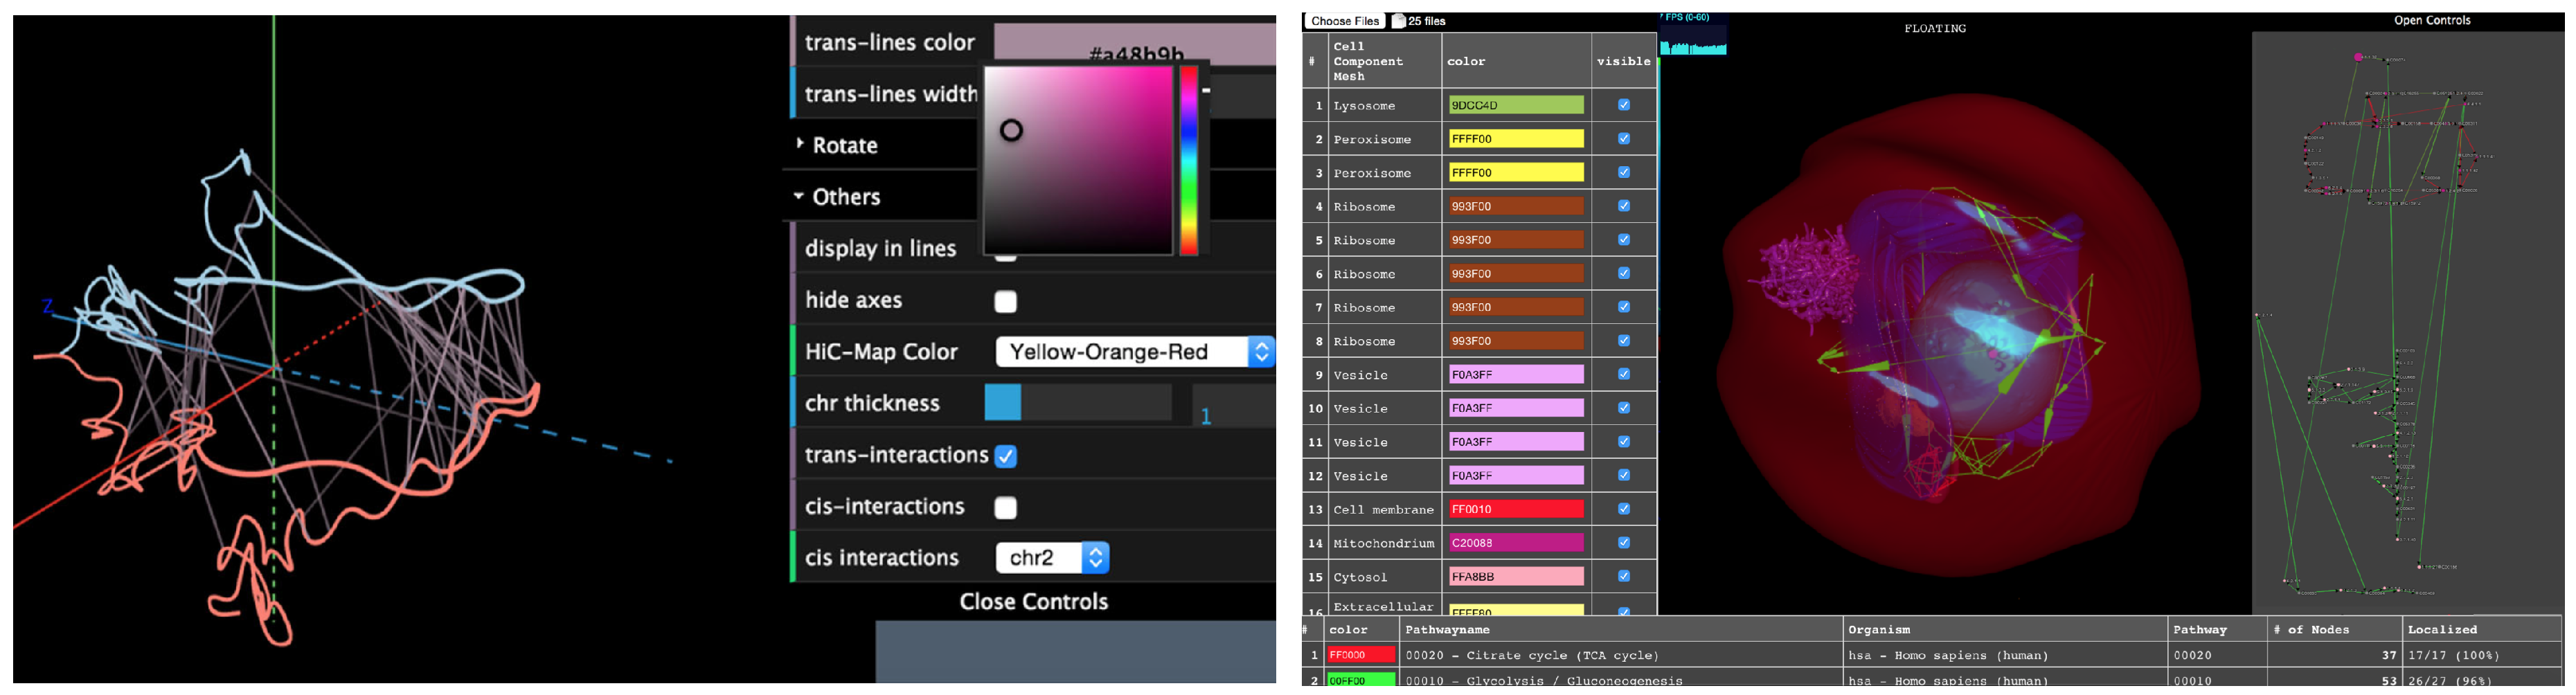
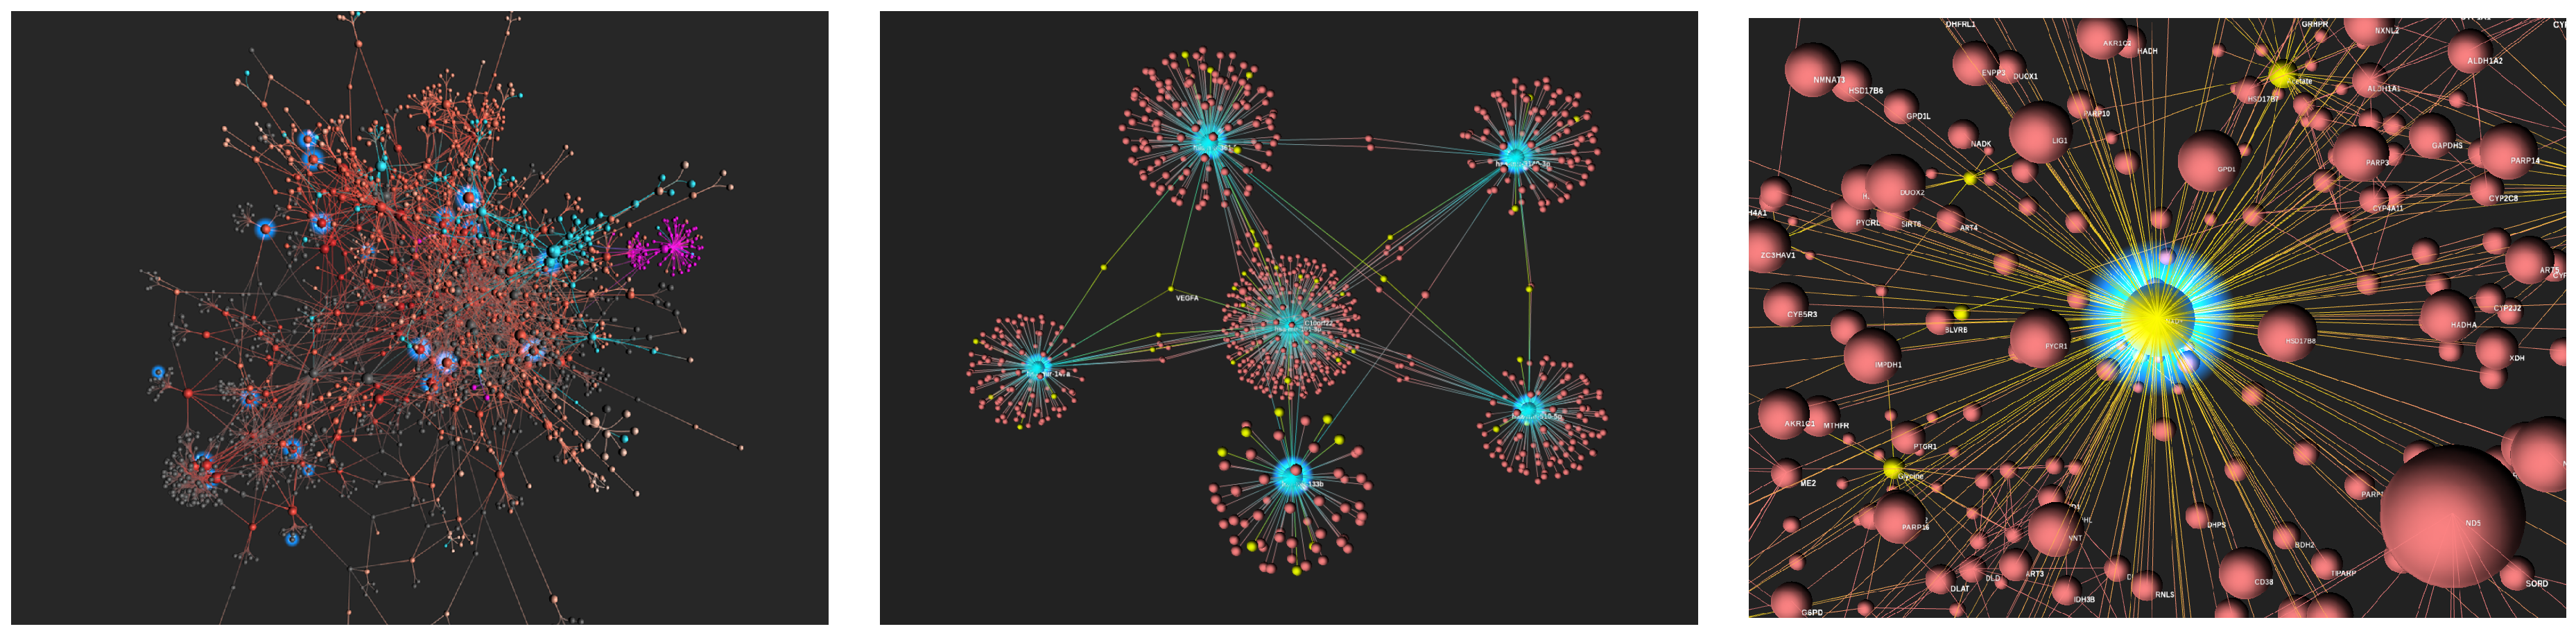
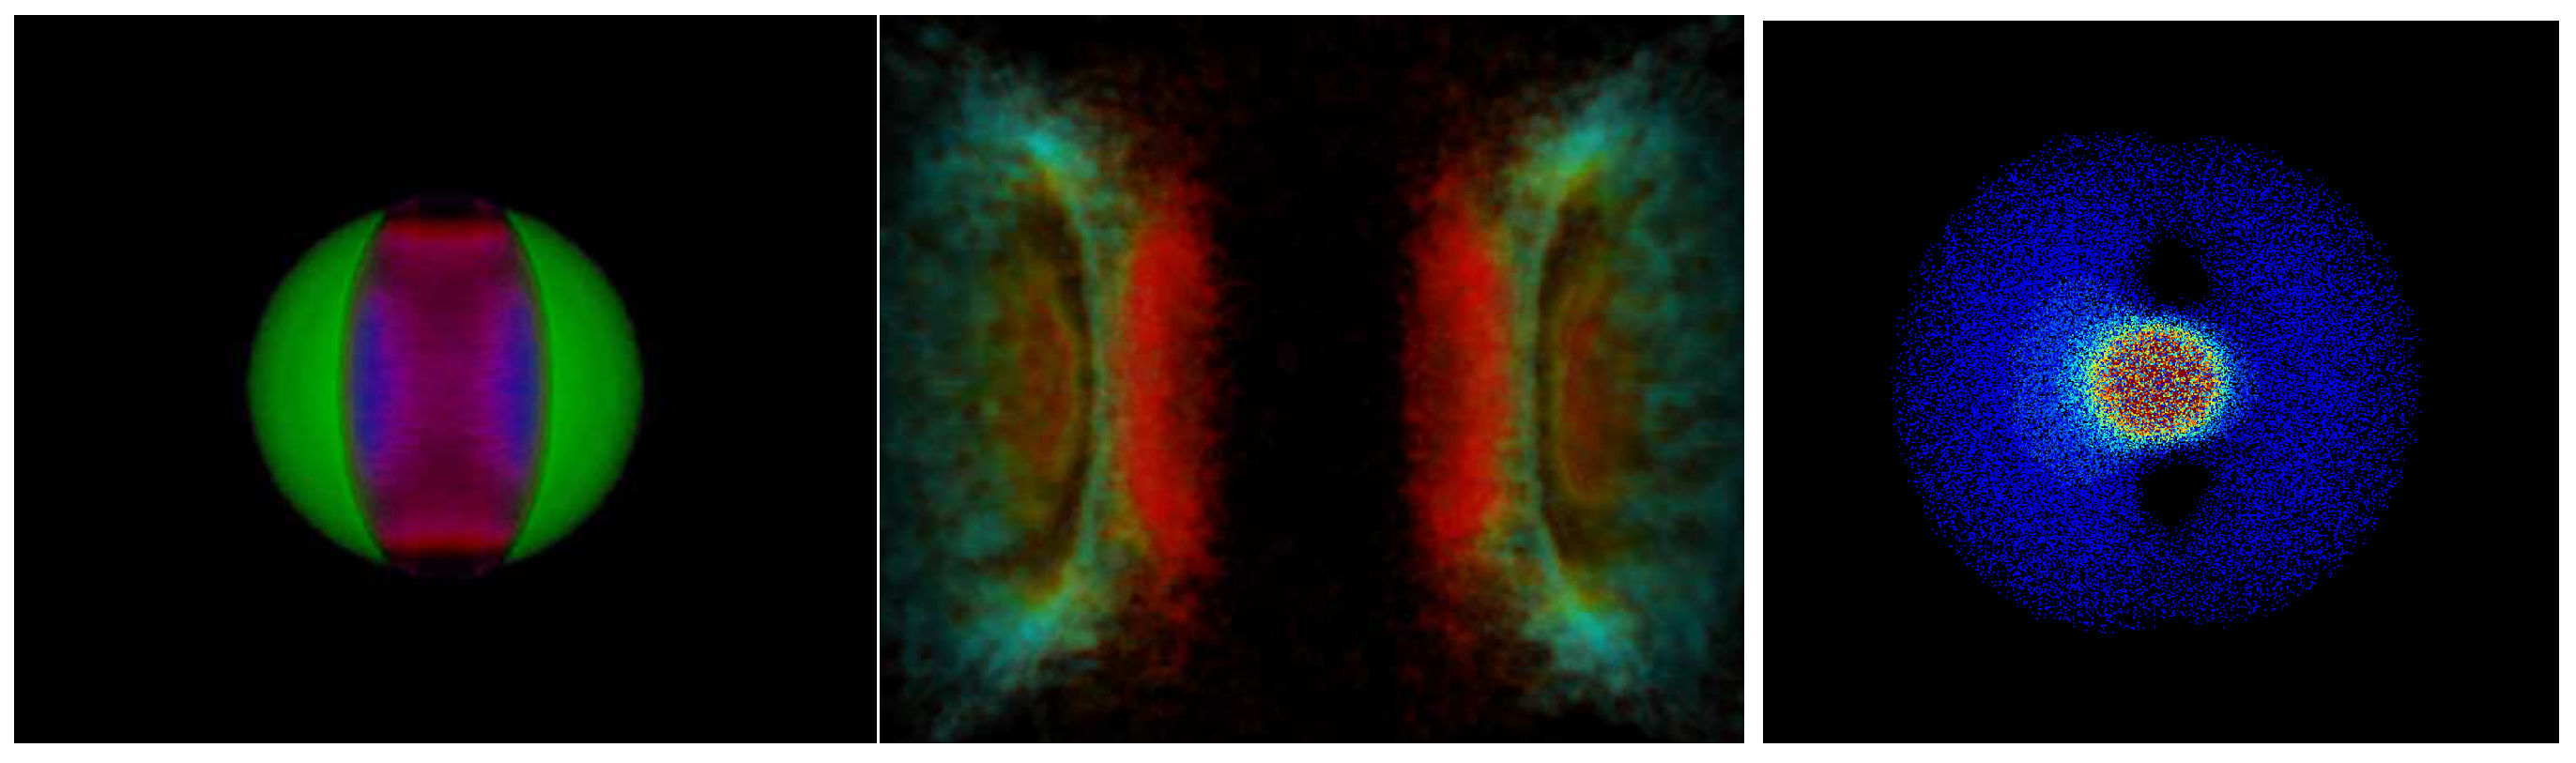
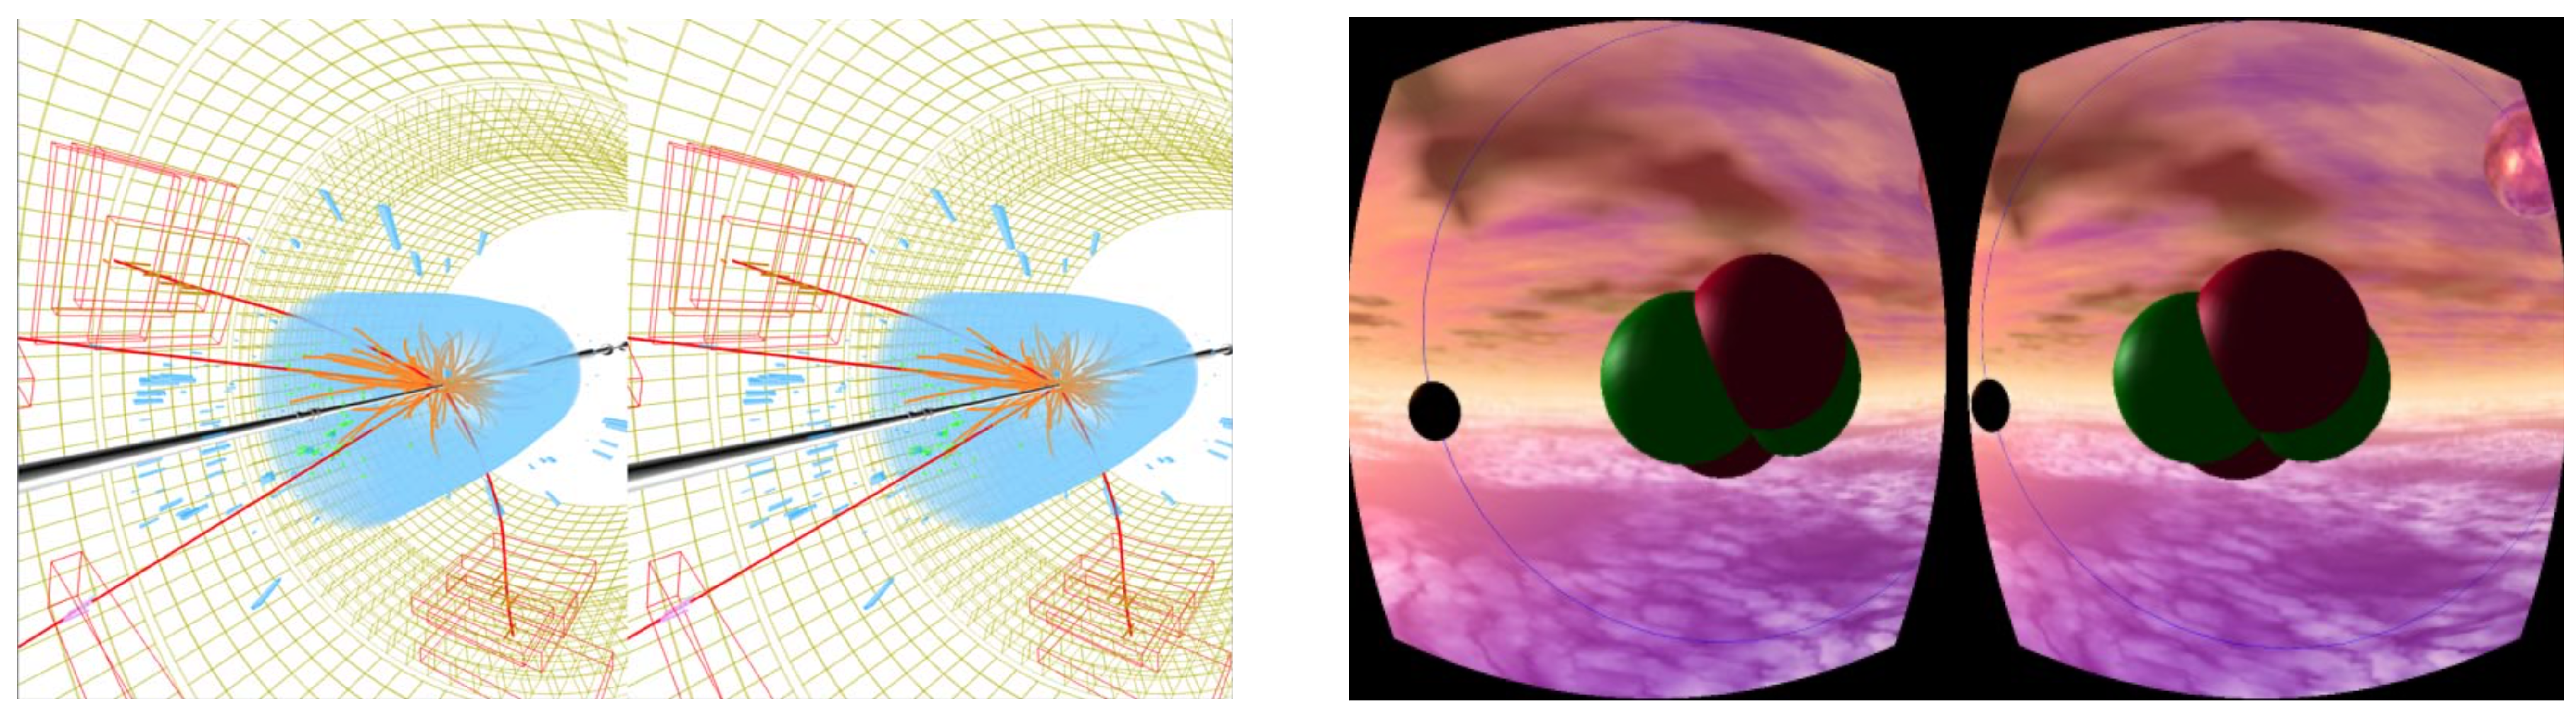
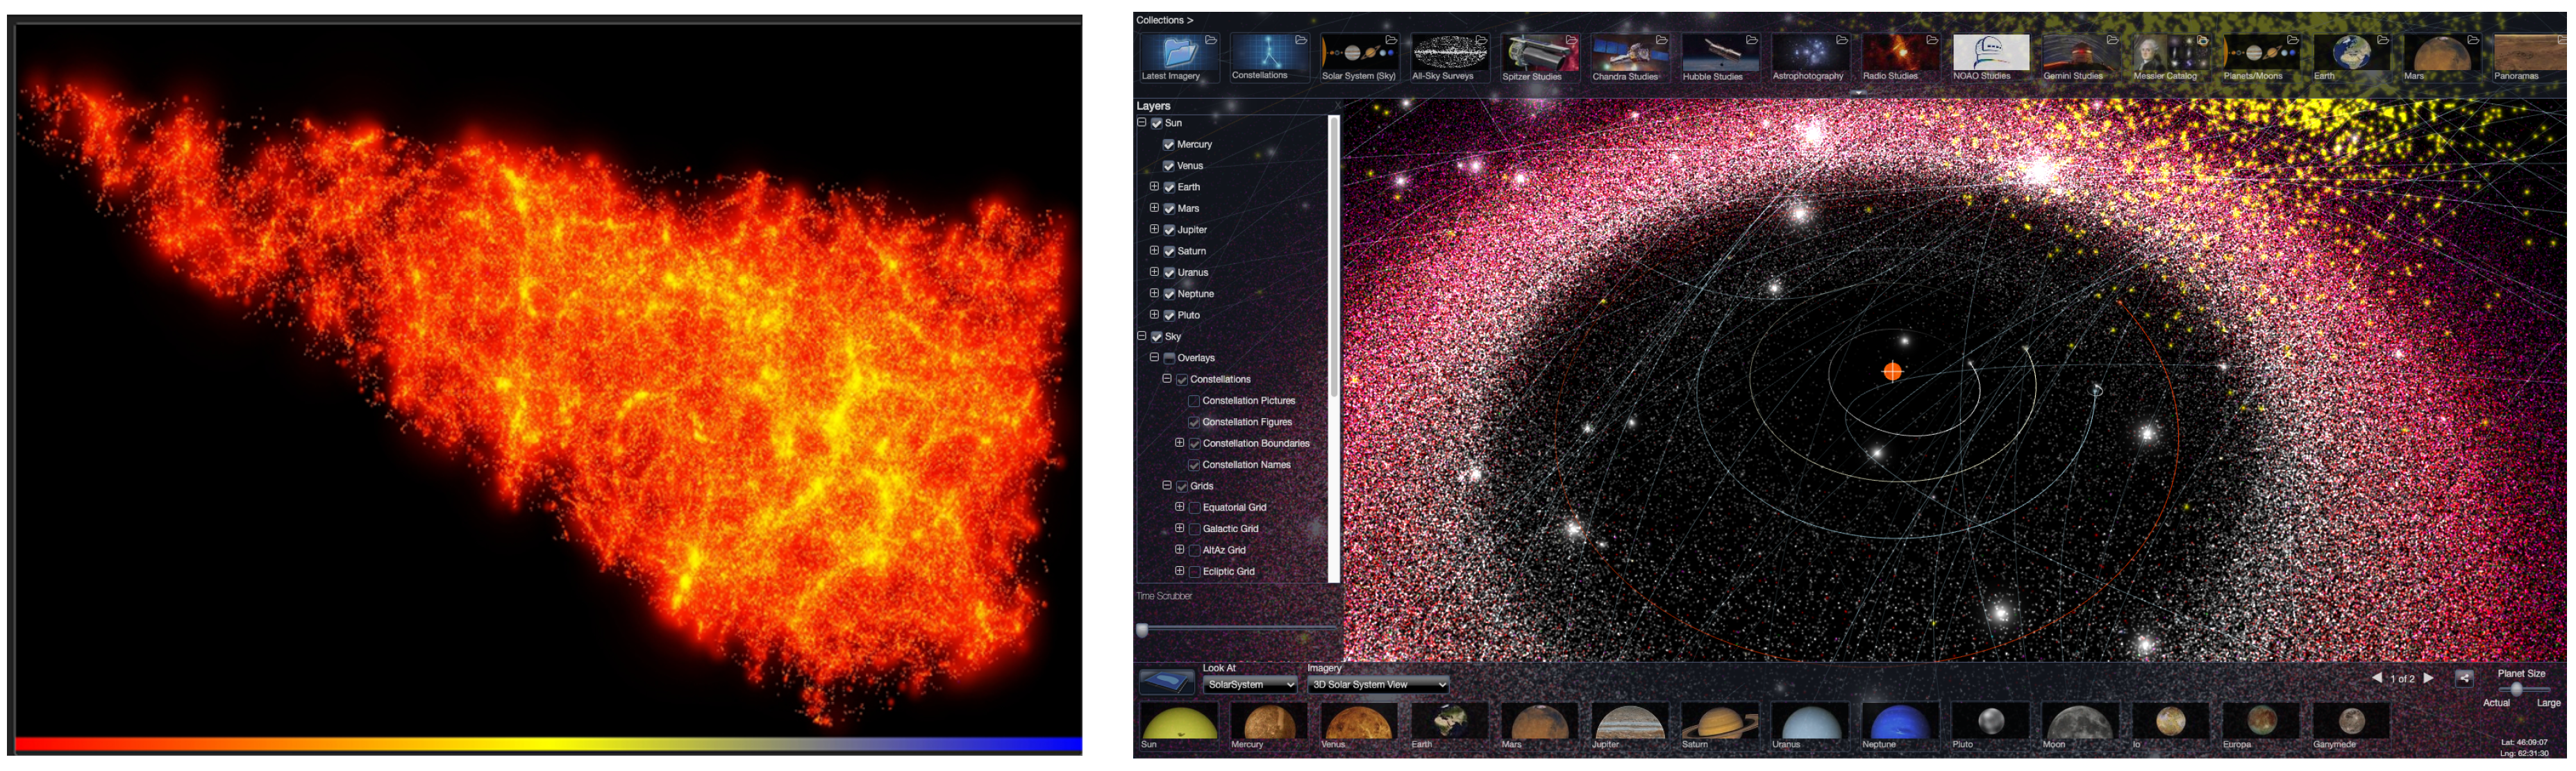
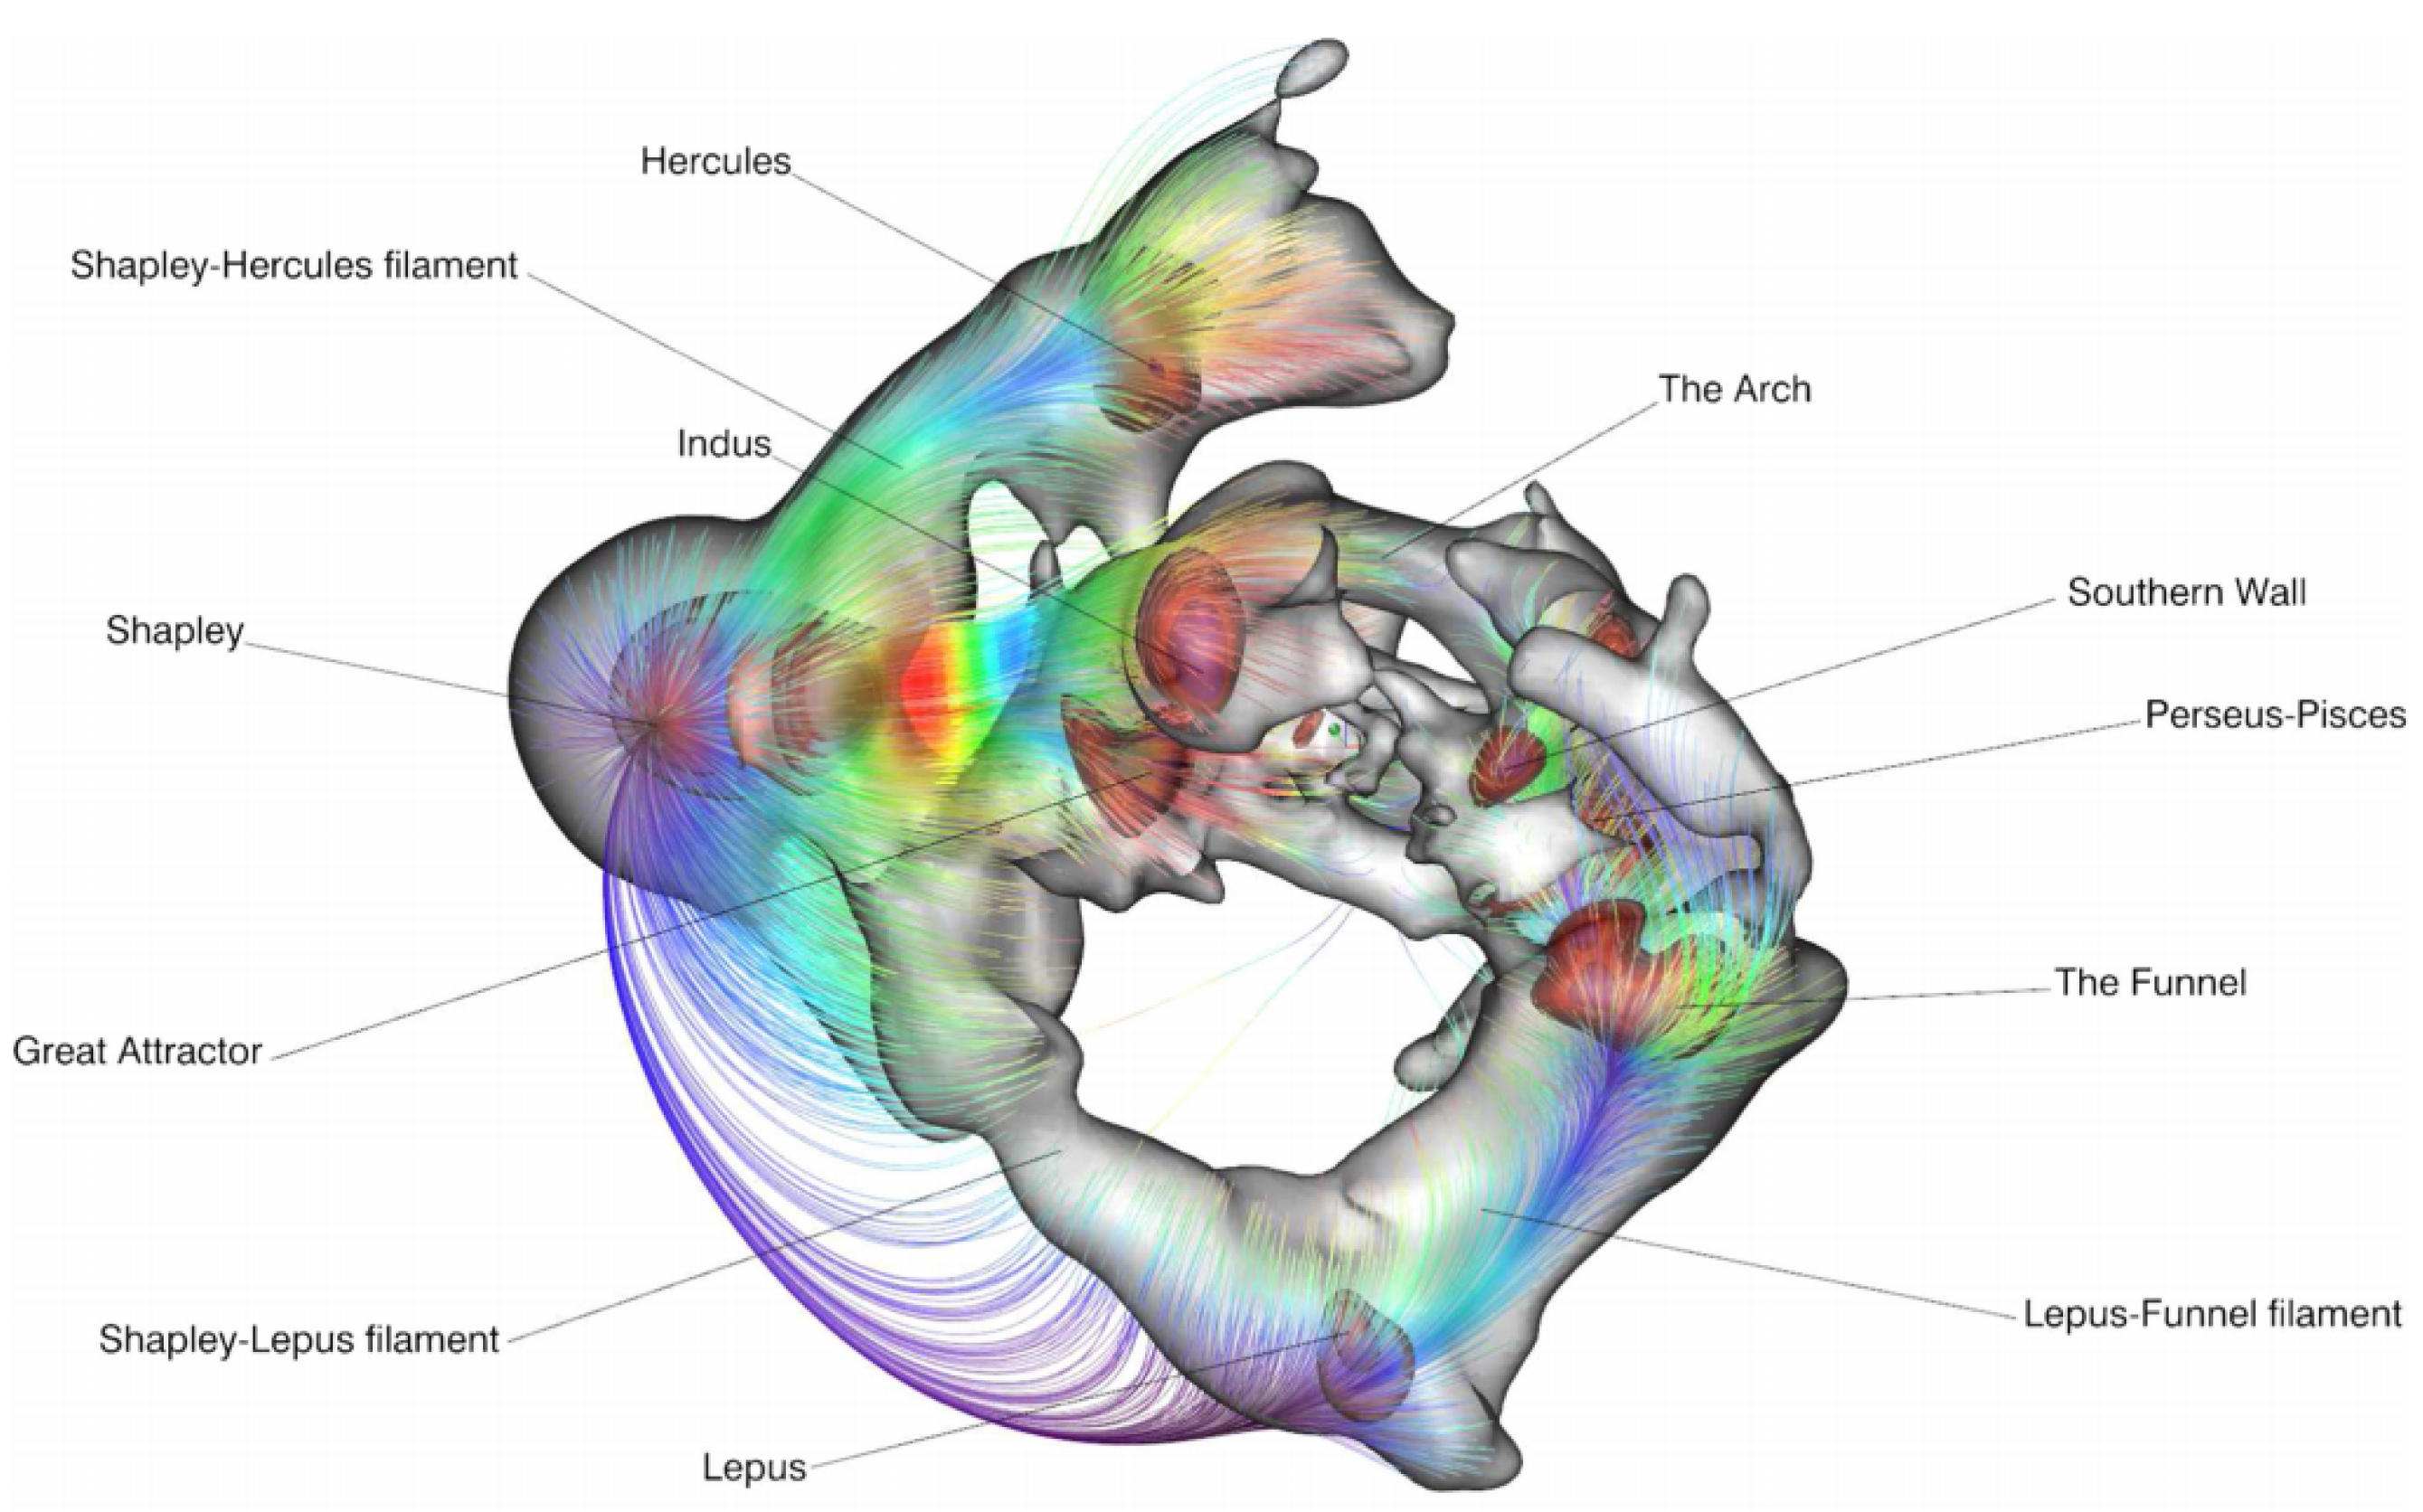
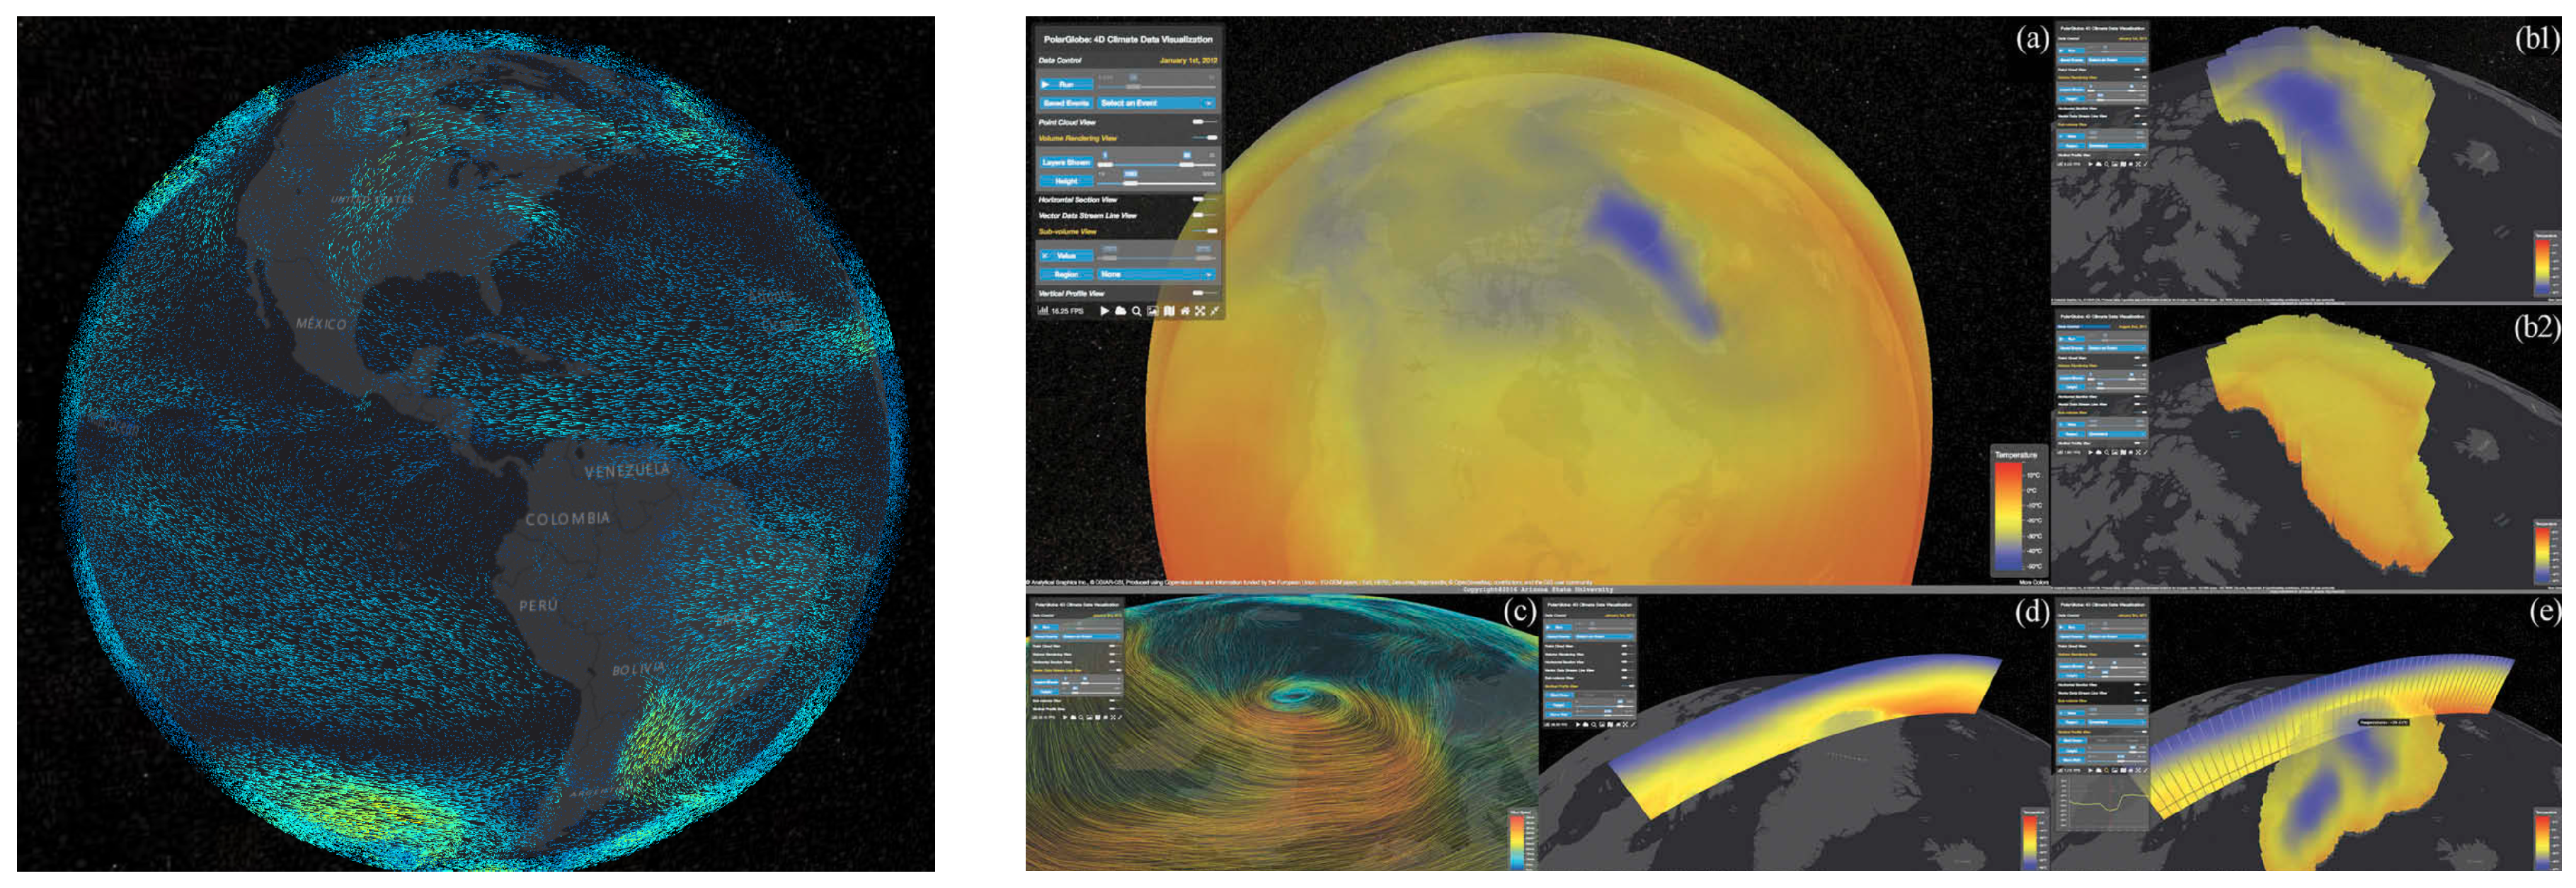
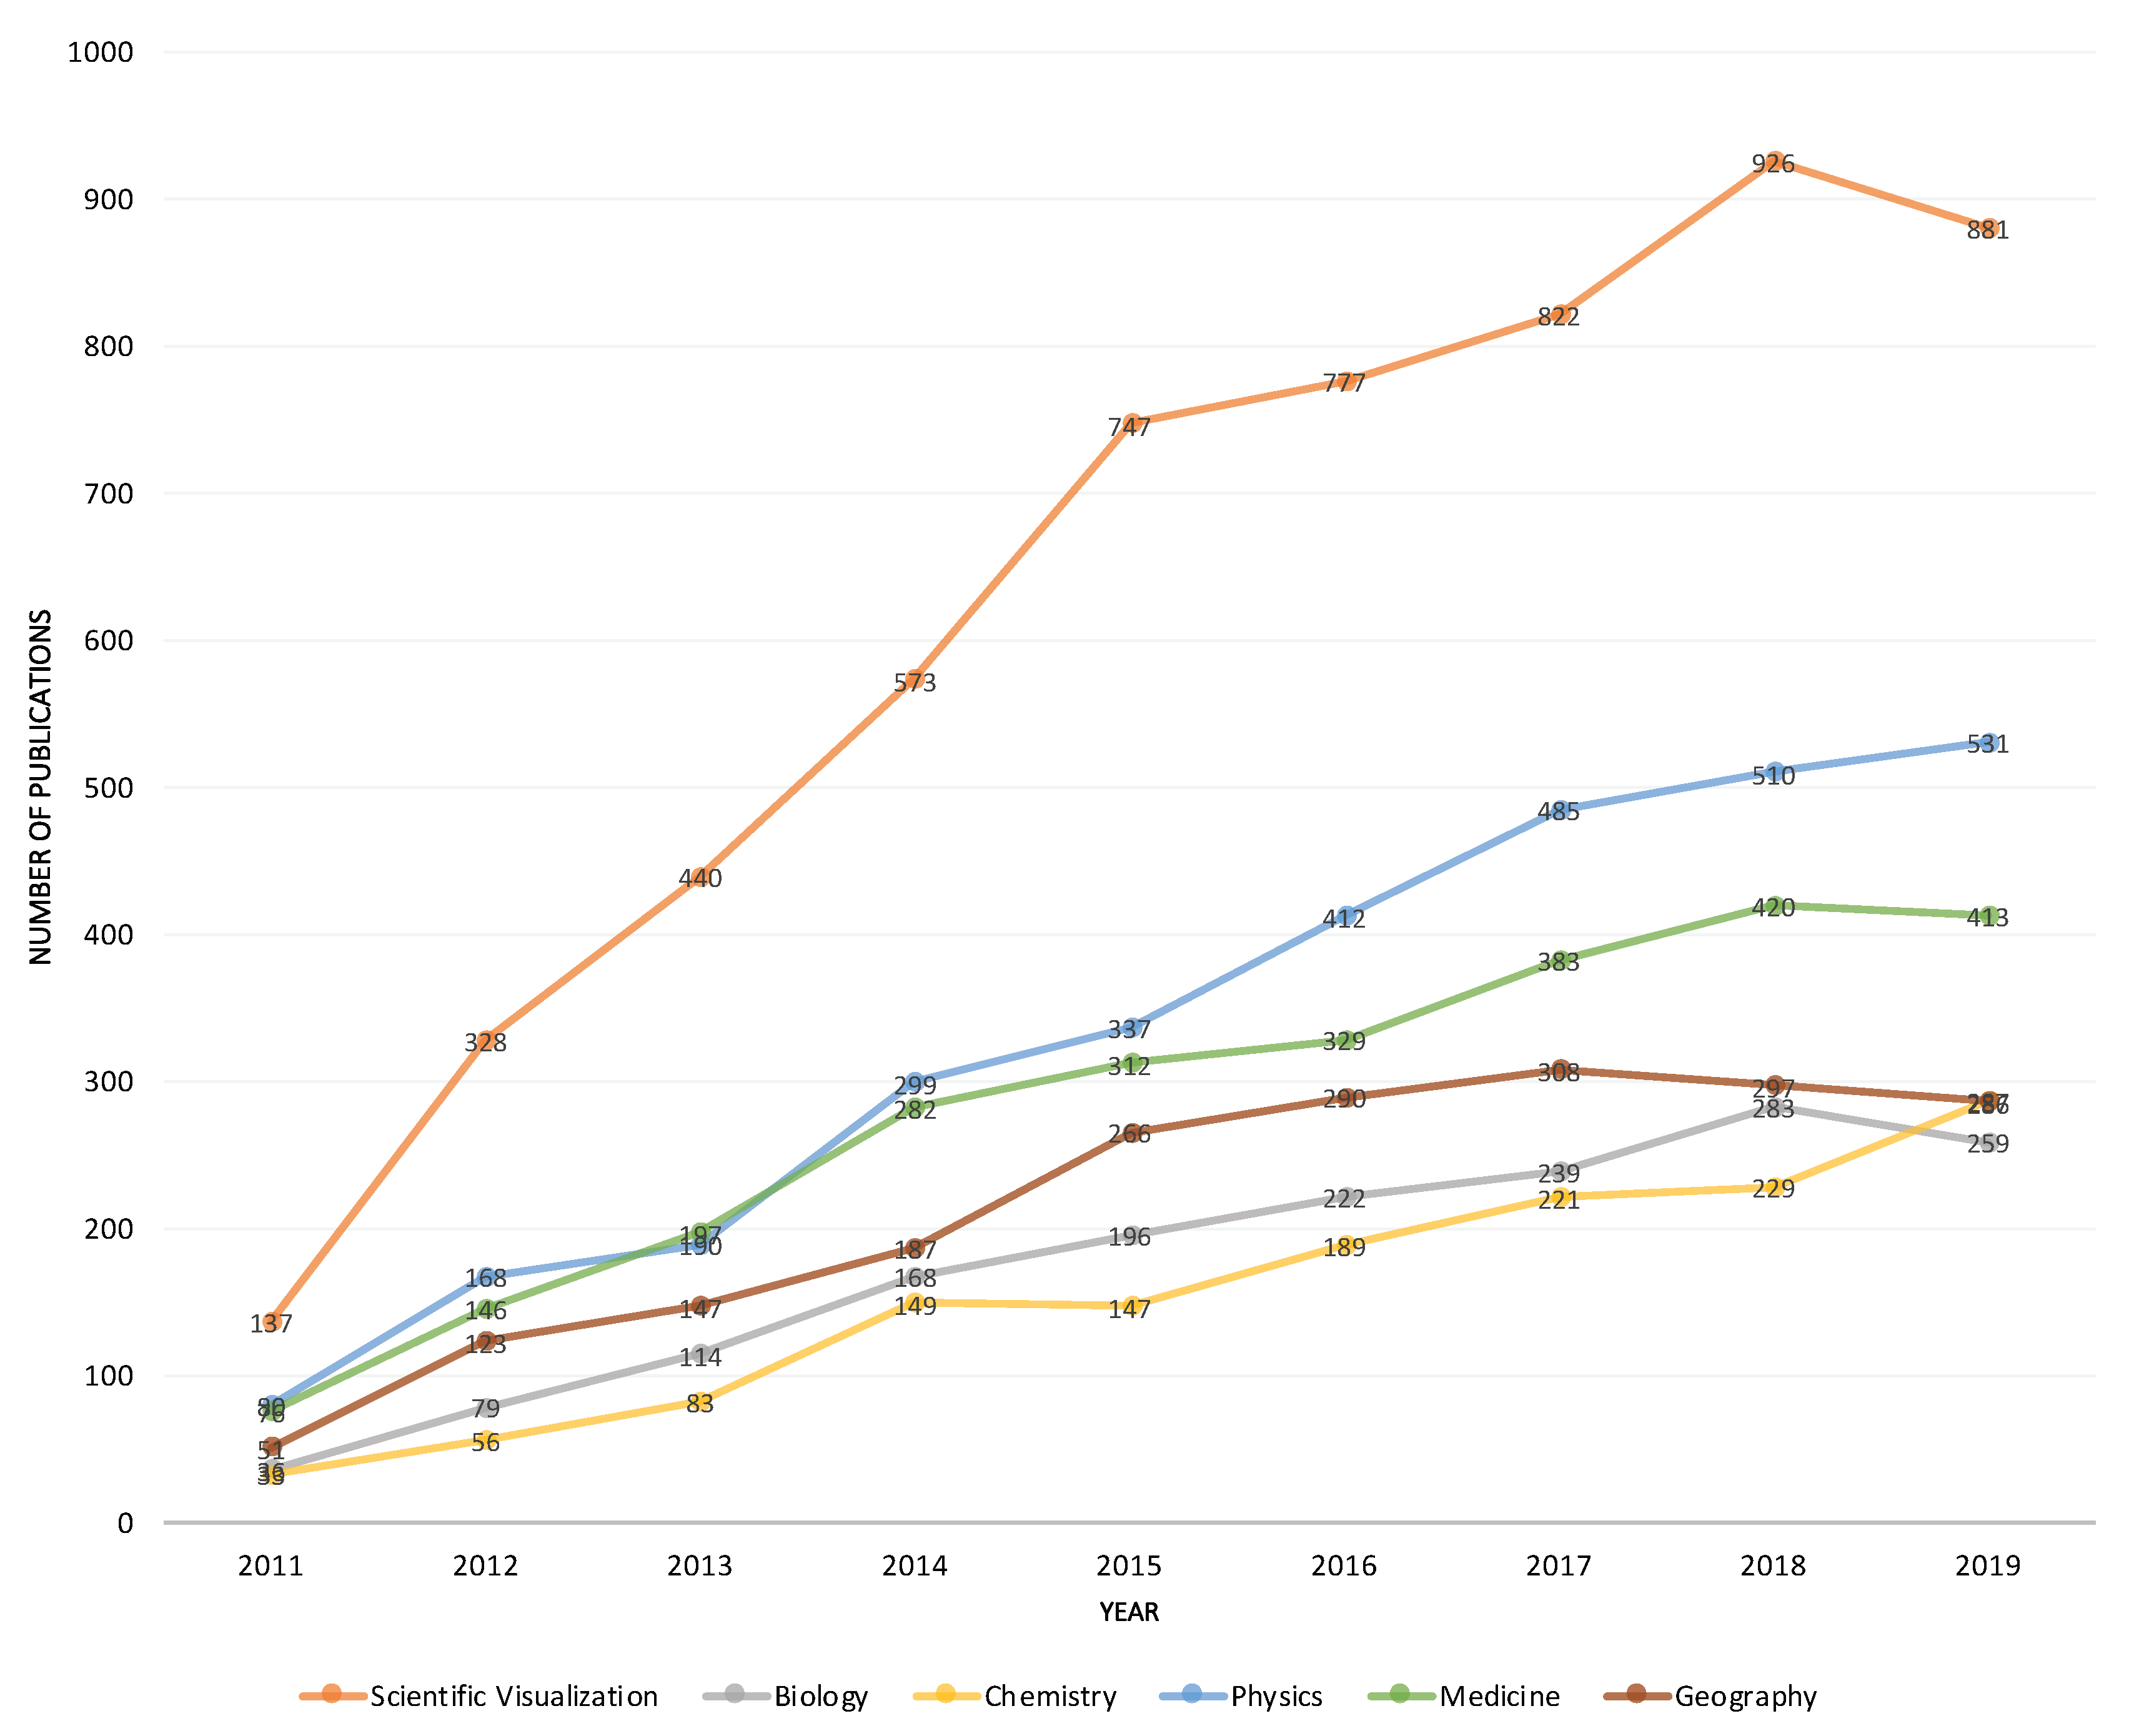
Table 1.
Overview of web-based 3D visualization applications and libraries described in the scientific literature based on their key performance indicators and calculated SciVis Future Readiness Score (FRS), sorted by publication year. The provided URLs are either GitHub repositories, links, or demos to the projects belonging to the author’s publications.
| Name, Authors, Reference & URL 1 | Codebase | Infra-Structure | Responsive Design | VR/ AR 2 | License | SciVis FRS 3 | ||||
|---|---|---|---|---|---|---|---|---|---|---|
| Code Available | Updates | Documentation | Support | WebGL | ||||||
| Medicine | ||||||||||
| Movania and Feng [30] | ✗ | ✗ | ✗ | ✗ | 1.0 | client | ✓ | ✗ | n/a | 0.3125 |
| Mani and Li [31] | ✗ | ✗ | ✗ | ✗ | 1.0 | cloud-based | ✗ | ✗ | n/a | 0.1875 |
| SliceDrop [32] https://slicedrop.com/ | ✓ | ✓ | ✓ | ✓ | 1.0 | client | ✓ | ✗ | MIT | 0.8125 |
| XTK [16] https://github.com/xtk/X | ✓ | ✓ | ✓ | ✓ | 1.0 | client | ✓ | ✗ | MIT | 0.8125 |
| Virag et al. [33] | ✗ | ✗ | ✗ | ✗ | 1.0 | client-server | ✓ | ✓ | n/a | 0.375 |
| BrainBrowser [34] https://brainbrowser.cbrain.mcgill.ca/ | ✓ | ✓ | ✓ | ✓ | 1.0 | client-server | ✓ | ✗ | GPL | 0.75 |
| OpenAnatomyBrowser [35] https://github.com/mhalle/oabrowser/tree/master | ✓ | ✗ | ✓ | ✗ | 1.0 | client-server | ✓ | ✗ | n/a | 0.5 |
| BUTTERFLY [36] https://github.com/Rhoana/butterfly | ✓ | ✓ | ✓ | ✓ | 1.0 | client-server | ✓ | ✗ | MIT | 0.75 |
| Qiao et al. [37] | ✗ | ✗ | ✗ | ✗ | 1.0 | client-server | ✓ | ✓/✗ | n/a | 0.3125 |
| MedView [38] https://github.com/FNNDSC/medview | ✓ | ✓ | ✓ | ✓ | 1.0 | client-server | ✗ | ✗ | MIT | 0.625 |
| FiberWeb [39] www.imeka.ca/fiberweb | ✗ | ✗ | ✗ | ✗ | 1.0 | client | ✓ | ✗ | closed source | 0.3125 |
| NeuroCave [40] https://creativecodinglab.github.io/NeuroCave/ | ✓ | ✗ | ✓ | ✓ | 2.0 | client(-server) | ✓ | ✓ | n/a | 0.8125 |
| Min et al. [41] | ✗ | ✗ | ✗ | ✗ | ✗ | client-server | ✗ | ✗ | n/a | 0.07 |
| Med3D [42] https://github.com/UL-FRI-LGM/Med3D | ✓ | ✗ | ✓ | ✓ | 2.0 | client-server | ✓ | ✗ | BSD | 0.6875 |
| Kokelj et al. [43] | ✗ | ✗ | ✗ | ✗ | 2.0 | client-server | ✓ | ✓ | n/a | 0.4375 |
| BrainTrawler [44] | upon request | ✗ | ✗ | ✗ | ✗ | client-server | ✓ | ✗ | n/a | 0.2857 |
| CoreSlicer [45] https://github.com/louismullie/coreslicer | ✓ | ✓ | ✓ | ✓ | 2.0 | client-server | ✗ | ✗ | MIT | 0.6875 |
| Moraes et al. [46] (integrated in https://github.com/tfmoraes/invesalius3) | integrated in other platform | ✗ | ✗ | ✗ | 2.0 | client-server | ✓ | ✗ | GPL | 0.4375 |
| Zhang [47,48] | ✗ | ✓ | ✗ | ✗ | 2.0 | client-server | ✓ | ✗ | n/a | 0.4375 |
| FiberStars [49] https://lorifranke.github.io/FiberStars/ | ✓ | ✓ | ✓ | ✓ | 2.0 | client-server | ✓ | ✗ | MIT | 0.8125 |
| Biology, Chemistry & Molecular Science | ||||||||||
| PV [50] https://biasmv.github.io/pv | ✓ | ✗ | ✓ | ✓ | 2.0 | client-server | ✗ | ✗ | MIT | 0.5625 |
| JSmol [51] https://sourceforge.net/projects/jsmol | ✓ | ✓ | ✓ | ✓ | 1.0/✗ | client-server | ✓ | ✗ | LGPL | 0.75 |
| bioWeb3D [52] https://github.com/jbogp/bioWeb3D | ✓ | ✓ | ✓ | ✓ | 1.0 | client-server | ✓ | ✗ | AFL | 0.75 |
| iView [53] https://github.com/HongjianLi/iview | ✓ | ✗ | ✗ | ✗ | 1.0 | client | ✓ | ✗ | Apache/MIT | 0.4375 |
| Chemozart [54] https://github.com/mohebifar/chemozart | ✓ | ✗ | ✗ | ✗ | 1.0 | client-server | ✓ | ✗ | Apache | 0.375 |
| ChemDoodle [55] https://web.chemdoodle.com | ✓ | ✓ | ✓ | ✓ | 1.0 | client | ✓ | ✗ | GPL | 0.8125 |
| 3Dmol.js [56] https://github.com/3dmol/3Dmol.js/http://3Dmol.csb.pitt.edu | ✓ | ✓ | ✓ | ✓ | 1.0 | client | ✓ | ✗ | BSD | 0.8125 |
| 3D-Lab / Molecular Rift [57,58] https://github.com/Magnusnorrby/MolecularRift | ✓ | ✓ | ✓ | ✓ | ✗ | client-server | ✓ | ✓ | GPL | 0.9286 |
| Bio3D-web [59] http://thegrantlab.org/bio3d/Webapps | ✓ | ✓ | ✓ | ✓ | ✗ | client-server | ✗ | ✗ | GPL2 | 0.6429 |
| Mwalongo et al. [17] | ✗ | ✗ | ✗ | ✗ | 2.0 | client-server/ cloud-based | ✓ | ✗ | n/a | 0.375 |
| MolMil [60] http://gjbekker.github.io/molmil//https://github.com/gjbekker/molmil | ✓ | ✗ | ✓ | ✓ | 1.0 | client | ✓ | ✗ | LGPL | 0.6875 |
| CmPIweb [61] http://CmPIweb.CELLmicrocosmos.org. | ✓ | ✗ | ✗ | ✗ | 1.0 | client-server | futurework | ✗ | n/a | 0.3125 |
| HiC-3D-Viewer [62] https://github.com/mohamed-amine-guerras/HiC3DViewer | ✓ | ✓ | ✓ | ✓ | 2.0 | client-server | ✗ | ✗ | GPL | 0.6875 |
| LiteMol [63] https://www.litemol.org/ | ✓ | ✓ | ✓ | ✓ | 2.0 | client-server | ✓ | ✓/✗ | Apache | 0.875 |
| Web3DMol [64] https://web3dmol.net/ | downloadable on website | ✗ | ✓ | ✓ | 1.0 | client | ✓ | ✗ | n/a | 0.6875 |
| OmicsNet [65] http://www.omicsnet.ca. | ✗ | ✓ | ✓ | ✓ | 2.0 | client-server | ✗ | futurework | n/a | 0.625 |
| NGL [66,67] http://arose.github.io/ngl / https://github.com/arose/ngl | ✓ | ✓ | ✓ | ✓ | 2.0 | client-server | ✓ | ✗ | MIT | 0.8125 |
| HTMol [68] http://htmol.tripplab.com/https://github.com/tripplab/HTMoL | ✓ | ✓ | ✓ | ✓ | 2.0 | client-server | futurework | ✗ | MIT | 0.75 |
| MegaMol [69] https://megamol.org//https://github.com/UniStuttgart-VISUS/megamol | ✓ | ✓ | ✓ | ✓ | 2.0 | client-server | ✓ | ✗ | BSD | 0.8125 |
| iCn3d [70] https://github.com/ncbi/icn3d | ✓ | ✓ | ✓ | ✓ | 2.0 | client-server | ✗ | ✗ | public domain | 0.6875 |
| ProteinVR [71] https://durrantlab.pitt.edu/protein-vr/ | ✓ | ✓ | ✓ | ✓ | 2.0 | client-server | ✓ | ✓ | BSD | 0.9375 |
| Physics | ||||||||||
| MeshLabJS [72] https://www.meshlabjs.net// https://github.com/cnr-isti-vclab/meshlabjs | ✓ | ✗ | ✓ | ✓ | 1.0 | client-server | ✗ | ✗ | AGPL | 0.5 |
| Chandler et al. [73] | ✗ | ✗ | ✗ | ✗ | 1.0 | client-server | futurework | ✗ | n/a | 0.1875 |
| OpenJSCAD https://openjscad.org// https://github.com/jscad/OpenJSCAD.org | ✓ | ✓ | ✓ | ✓ | ✗ | client or client-server | ✗ | ✗ | MIT | 0.714 |
| iSpy WebGL [74] http://cern.ch/ispy-webgl/ https://github.com/cms-outreach/ispy-webgl | ✓ | ✓ | ✓ | ✓ | 2.0 | client | ✓ | futurework | MIT | 0.9375 |
| VRMath2 [75] https://vrmath2.net/ https://vrmath2.net/VRM2/ | ✓ | ✓ | ✓ | ✗ | 1.0 | client-server | ✓ | ✓ | copyright | 0.75 |
| SPOT [76] https://github.com/ElsevierSoftwareX/SOFTX_2018_178 | ✓ | ✗ | ✓ | ✓ | ✗ | client-server | ✗ | ✗ | Apache | 0.5 |
| CAD3A [77] http://cad3a.ge.imati.cnr.it/webapp/ / https://github.com/KKaty/CAD_PatternComputation | ✗ | ✓ | ✗ | ✓ | 2.0 | client-server | ✓ | ✗ | MIT | 0.5625 |
| HexaLab [78] https://github.com/cnr-isti-vclab/HexaLab / https://www.hexalab.net/ | ✓ | ✓ | ✓ | ✓ | 2.0 | client | ✗ | ✗ | MIT | 0.75 |
| Abubu.js [79] https://github.com/kaboudian/abubujs / https://chaos.gatech.edu/NGL_CSF/ | ✓ | ✓ | ✓ | ✓ | 2.0 | client | ✓ | ✗ | MIT | 0.875 |
| QMWebJS [80] http://www.parvis3d.org.es/qmweb/ / https://github.com/EdgarFigueiras/QM_Particles_WebGL | ✓ | ✓ | ✗ | ✓ | 2.0 | cloud-based | ✗ | beta | n/a | 0.625 |
| WWT http://worldwidetelescope.org/webclient/ / https://github.com/WorldWideTelescope | ✓ | ✓ | ✓ | ✓ | 2.0 | client-server | ✓ | ✗ | MIT | 0.8125 |
| Geography, Meteorology & Archaeology | ||||||||||
| 3DHOP [81] https://github.com/cnr-isti-vclab/3DHOP | ✓ | ✓ | ✓ | ✓ | 2.0 | client or client-server | ✓ | futurework | GPL | 0.9375 |
| GPlates portal [82] http://portal.gplates.org/ | ✗ | ✓ | ✓ | ✓ | 2.0 | cloud-based | ✓ | ✗ | GPL | 0.75 |
| WebGL Globe https://experiments.withgoogle.com/chrome/globe | ✓ | ✓ | ✓ | ✓ | 2.0 | client | ✓ | ✗ | Apache | 0.875 |
| Koeva et al. [83,84] no url provided | ✓ | |||||||||
| PolarGlobe [85] http://cici.lab.asu.edu/polarglobe/ | ✗ | ✗ | ✓ | ✓ | 2.0 | client-server | ✓ | ✗ | copyright | 0.5625 |
| 3DAV [86] https://github.com/Prieston/3dav | ✓ | ✗ | ✓ | ✓ | 2.0 | client | ✗ | ✗ | n/a | 0.625 |
| Discher et al. [19,87] | ✗ | ✗ | ✗ | ✗ | 2.0 | client-server | ✓ | ✓ | n/a | 0.4375 |
| Liu et al. [88] https://github.com/liusir2000/visAirPollutant | ✓ | ✗ | ✓ | ✗ | 2.0 | client-server | ✗ | ✗ | n/a | 0.4375 |
| EddyViz [89] https://vizlab.rutgers.edu/eddyviz.html | ✓ | ✗ | ✓ | ✓ | 2.0 | client-server | ✗ | ✗ | n/a | 0.5625 |
| Boutsi et al. [90] | ✗ | ✓ | ✗ | ✗ | 2.0 | client-server | futurework | ✓ | n/a | 0.5 |
| Cross-Scientific Applications | ||||||||||
| ParaViewWeb [2] https://www.paraview.org/web | ✓ | ✓ | ✓ | ✓ | ✗ | client-server | ✓ | ✗ | BSD | 0.6875 |
| Desprat et al. [91] https://github.com/caro3801/3DP2P | ✓ | ✗ | ✗ | ✗ | 1.0 | client-server | ✗ | ✗ | n/a | 0.25 |
| Tapestry [20] https://github.com/seelabutk/tapestry | ✓ | ✗ | ✓ | ✗ | ✗ | cloud-based | ✓ | ✗ | MIT | 0.5714 |
| Hadjar et al. [92] http://193.194.91.152/test/ / https://datavizcerist.shinyapps.io/dataviz/ | ✗ | ✗ | ✗ | ✗ | 2.0 | client-server | ✓ | ✓ | n/a | 0.4375 |
| Voxer [93] https://github.com/cad420/voxer | ✓ | ✓ | ✓ | ✓ | ✗ | client-server | ✓ | ✗ | n/a | 0.7857 |
| Substrate [94] https://github.com/aplbrain/substrate | ✓ | ✓ | ✓ | ✓ | 2.0 | client-server | ✗ | ✗ | Apache | 0.6875 |
1 Uniform Resource Locator; 2 Virtual Reality / Augmented Reality; 3 Future Readiness Score.
© 2020 by the authors. Licensee MDPI, Basel, Switzerland. This article is an open access article distributed under the terms and conditions of the Creative Commons Attribution (CC BY) license (http://creativecommons.org/licenses/by/4.0/).
Share and Cite
MDPI and ACS Style
Franke, L.; Haehn, D. Modern Scientific Visualizations on the Web. Informatics 2020, 7, 37. https://doi.org/10.3390/informatics7040037
AMA Style
Franke L, Haehn D. Modern Scientific Visualizations on the Web. Informatics. 2020; 7(4):37. https://doi.org/10.3390/informatics7040037
Chicago/Turabian StyleFranke, Loraine, and Daniel Haehn. 2020. "Modern Scientific Visualizations on the Web" Informatics 7, no. 4: 37. https://doi.org/10.3390/informatics7040037
Note that from the first issue of 2016, this journal uses article numbers instead of page numbers. See further details here.