Article

Application of GC/MS Pyrolysis for Assessment Residues of Textile Composites after Filtration of Washing and Rinsing Effluents

1
Croatian Institute for Public Health, Rockefellerova 7, 10000 Zagreb, Croatia
2
Faculty of Food Technology and Biotechnology, University of Zagreb, Pierottijeva 6, 10000 Zagreb, Croatia
3
Faculty of Textile Technology, University of Zagreb, Baruna Filipovića 28 a, 10000 Zagreb, Croatia
*
Author to whom correspondence should be addressed.
Separations 2022, 9(10), 292; https://doi.org/10.3390/separations9100292
Submission received: 30 August 2022 / Revised: 29 September 2022 / Accepted: 1 October 2022 / Published: 6 October 2022
(This article belongs to the Special Issue Separation and Analysis of Micro- and Nanoplastics in the Environment)

Abstract

:
Research on the sources of microplastics (MP) in the environment and the parameters that lead to the loss of microfibers from synthetic textiles during washing have recently attracted public attention. Considering the involvement of a variety of structural and process parameters, it is important to choose methods for quantifying fibers as MP pollutants that migrated during the washing process. In the research to date, various sampling techniques and analytical protocols for the identification of polymers from washed synthetic textiles have been applied. In the present research, pyrolysis coupled with gas chromatography and mass spectrometry (Py-GC/MS), was applied to verify the composition of the filter residue isolated from washing and rinsing effluents. A comparison with bases of polymeric materials has proven the presence of potential environmental pollutants in the form of microfibers released during the washing process. The investigation confirmed that fragments of cotton cellulose residues predominate in relation to polyester. Based on the list of identified compounds generated by Py-GC/MS results and their retention times the multivariate data analysis proved the influence in the bath composition.

Graphical Abstract

1. Introduction

Plastic debris of less than 5 mm in length is defined as microplastics (MP) [1] and has been characterized as “extremely” persistent in the environment by the European Chemicals Agency (ECHA). Microplastics may even cause irreversible contamination and potentially threaten human health and/or the environment [2,3]. Therefore, the pollution with MP has not only aroused scientific interest, but has also contributed to the increased public and political awareness concerning other topics related to plastics, which has led to legal and political actions and strategic documents. In addition to this type of debris, MP released in washing PES textiles, as well as particles used in medical, industrial, and personal care products are classified as “secondary microplastics” [4,5].
One of the more common types of microplastics found in the environment are fibers originating from textile materials. Some research has indicated the presence of natural and synthetic fibers in the marine environment [6,7].
The release of micro-sized polymer particles—MP from textile materials—is an area of research that preoccupies researchers from different fields, indicating the interdisciplinarity of this topic [8]. It has been found that the release potential of fibers depends on the donor properties of the textile material [9], and even if fibers released from natural textile materials do not represent a significant effluent load, they can be carriers of substances that significantly burden the environment [10].
The research of MP is relatively complex due to the size and shape of particles from various polymers, which represent serious scientific challenges. There is insufficient information on how chemical properties (additives, flame retardant agents, dyes) and the increased number of synthetic fibers and their blends with natural fibers affect the characterization of microfibers [9].
Advances in analytical techniques for microplastics characterization have indicated the prevalence of synthetic polymers categorized in the micro (<100 μm) and nano (<100 nm) classes. However, additional data/information is needed to determine the quantities, sources, transfers, and persistence of different types of microfibers [11]. The origin of MP is heterogeneous, and different techniques need to be used for their characterization, with thermoanalytical techniques as the most important ones. Pyrolysis combined with gas chromatography and mass spectrometry (Py-GC/MS) is used for qualitative-quantitative analysis of MP in various matrices, such as drinking water, seawater, sea salt, biosolids, sediments, and washing residues [12,13,14,15].
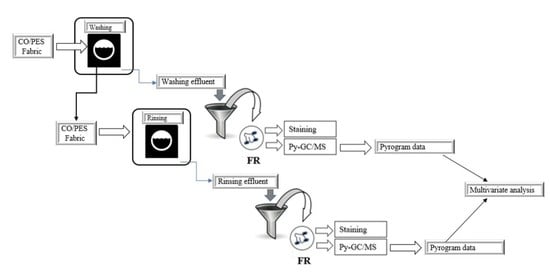
In this study, a textile composite of complex structure, made of cotton cellulose and polyester, was subjected to cyclic washing and rinsing with standard detergent and water. Separately collected effluents from the washing and rinsing cycle were filtered to separate dispersive pollutant as the filter residue (FR).
Given the polymer content in the composite of cotton cellulose and polyester, the aim of this study was to determine which component is prevalent in the filter residue (FR). To the best of our knowledge, the Py-GC/MS method as a thermal and rapid technique for the characterization of polymeric substances has not been used to date for characterization of dispersive pollutant from the cyclic washing and rinsing process.
The gravimetric analysis for the determination of the total solid substance (TSS) and staining by dyestuff as identification techniques of dispersive pollutant was applied as an auxiliary method. Further multivariate analysis of HCA based on the m/z chromatogram dataset of the related components was chosen to identify the differences in contamination with MF of washing and rinsing effluents.

2. Materials and Methods

2.1. Pollution Materials

In this study, a new commercial composite fabric (CO/PES) of natural polymer—cotton cellulose (60%) and synthetic polymer—polyester (40%) was analyzed as a potential MF polluter of the environment (Figure 1). In addition to visible protruding fibers, complexity of the sample was the two-component composition of the threads in the weave (Figure 1a), where the warp is made of cotton cellulose and polyester (Figure 1b) and the weft yarns are made only of cotton cellulose (Figure 1c).

2.2. Washing and Rinsing Procedure

In the washing process, the composite material in a mass of 5 g was washed in a laboratory device Linitest, Original Hanau, equipped by an inox beaker, using a bath ratio 1:5 (5 mL of water per 1 g materials, in total 25 mL) at 90 °C in alkalized tap water, according to EN ISO 6330:2021. Tap water was alkalized with sodium carbonate to adjust the alkalinity to pH 10.5 for the purpose of harmonization with the solution of a standard ECE B detergent (2 g/L). The reference detergent ECE B contains linear sodium alkylbenzene sulfonate (8.0%), ethoxylated fatty alcohol C12/18 with 14EO (2.9%), sodium soap (3.5%), sodium triphosphate (43.7%), sodium silicate (7.5%), potassium silicate (7.5%), carboxymethylcellulose (1.2%), ethylenediaminetetraacetic acid (0.2%), sodium sulphate (21.2%), and water (9.9%). The washing process was followed by rinsing performed by dip** of samples in water of the same quality using a 1:6 bath ratio. All experiments were performed in no plastic laboratory vessels and equipment to avoid contamination.
The scheme of the washing and rinsing process and fabric and effluent transfer is presented in Figure 2, with an indication of the separate collection of effluents from 5 washing cycles and 25 rinsing cycles.

2.3. Filter Residue Preparation

The separation of dispersive particles from the effluents was performed by membrane filtration with a glass fiber filter of 43 mm in diameter and a pore size of 0.7 μm. All analyses were performed in triplicate, separating the filters for identification. The FR labels are specified in Table 1.

2.4. Identification Methods

2.4.1. Total Solid Substances

The total solid substances (TSS) of washing and rinsing effluents were determined by the standard gravimetric method. After membrane filtration of washing and rinsing effluents, the mass of FR after drying at 100 °C was determined.

2.4.2. Staining with Dyestuffs

The staining of FR with selected dyestuffs, Telon® Blue M-GLW, DyStar (C. I. Acid Blue 221) and Bezaktiv Brilliantblau V-R spez., Bezema (C.I. Reactive Blue 19, 61200) was performed by soaking in dyestuff solutions (2%) for 15 min. After soaking, the samples were air-dried.

2.4.3. Pyrolysis-Gas Chromatography Mass Spectrometry, Py-GC/MS

To avoid the influence in the simultaneous presence of non-target pollutants, such as detergents, pyrolysis of standard detergents was performed. These interferences may lead to unwanted contamination of the analytical system and interference with the tar. The pyrolysis process of the reference sample—detergent and composite fabric (CO/PES) as well as the previously mentioned FRs—was performed in a multifunctional double-shot pyrolyzer (Frontier Laboratories Ltd., Koriyama, Japan) mounted on a Shimadzu GCMS-QP2010 Plus (Shimadzu Corporation, Japan). The pyrolysis temperature was set at 550 °C. For each test, the mass of the sample 0.2 mg was placed into the deactivated stainless steel sample cup separated by a metal capillary separation column (PY-2, 0.5 μm film of dimethyl polysiloxane, 30 m x 0.25 mm, Frontier Laboratories Ltd., Japan) under a programming temperature condition using a flow of helium (He) as carrier gas (1.81 mL/min). The following temperature program was used for the GC oven: 50 °C isotherm for 5 min, then 5 °C/min up to 320 °C. The total runtime was 54 min. Both the Py/GC interface and the GC injector temperatures were set at 320 °C. The injector was operated in split mode with a split ratio of 1:60. The separated pyrolyzates in the column were analyzed by single quadruple MS with temperature of ion source of 230 °C. Mass data acquisition was performed under EI positive mode of 70 eV with m/z range 29–600, and scan speed 1250 u/s. The qualifications and identifications of peaks in the chromatograms were confirmed by comparing the mass spectrum of each peak in the pyrogram with those in data search libraries of F Search all in one (MS 08) (Frontier Laboratories Ltd., Japan) and NIST/EPA/NIH (NIST 05). The chromatograms describe the peaks seen in the total ion chromatogram (TIC), which represents the number of compounds detected by GCMS after the pyrolysis step. For calculation of the area percentage of each compound in the tables of pyrolytic products and quantitative indicators, area normalization with an amount of 0.2 mg sample was performed. To identify the polymer compounds, the choice of specific m/z values was made based on the available literature references and a full list of the characteristic pyrolysis products and their m/z values used for peak integration. Compounds with a similarity index (SI) below 90% were left out from the tables. Moreover, m/z values were used for multivariate data analysis.

2.4.4. Data Analysis

The set of data obtained by the pyrograms of reference samples and FRs was exported to the Minitab software to perform the multivariate analyses. The hierarchical cluster analysis (HCA) is a method for dividing a group of objects into classes in order that similar objects are grouped into the same class. The gradual combination of objects into clusters is a graphical presentation known as a dendrogram. The distance, d, between two points in n-dimensional space with coordinates x and y is usually taken as the Euclidean distance defined by Equation (1).
d x , y = j = 1 J ( x j y j ) 2
The single linkage method using the Minitab software for the chromatograms data set of FRs was taken as the measure of homogeneity.

3. Results and Discussion

The nature of textiles as the pollutant material and its sheddability are important criteria in environmental fiber transfer. The sheddability depends on the type of textile (woven, knitted or non-woven), the texture (open or compact), the type of yarn, and the properties of the fibers in the composite, as well as whether the fibers are cut or filaments [9]. Blends of cotton with polyester, as well as other textile materials, release fibrils in the washing process, depending on the fabric structure and the properties of the yarn. The composite sample as shown in Figure 1 is a contaminant material characterized by unevenness and hairiness, which may affect the separability during the washing and rinsing process. Hydrophobic polyester (PES) has better wear resistance than hydrophilic cellulose fibers [16]. Moreover, the release is affected by the high alkalinity of the detergent solution (pH 10.3) due to the increased swelling of cotton cellulose as well as hydrolysis of PES, which further affects the migration of fibrils, i.e., fibril formation from the surface in the washing and rinsing process. This is confirmed by the results of the quantitative gravimetric analysis of FRs and TSS (Table 2).
The TSS values in Table 2 show the differences in FR after washing and rinsing. Higher TSS values were obtained in the rinsing process compared to the washing process. The double TSS value of FR after washing with the detergent (FR-W-D) indicates a significant influence in the bath composition on the particles effluent load.
However, the TSS of FR-R-D (72.9 mg/L) is slightly higher than the TSS of FR-R-W after rinsing with water (62.2 mg/L). These values indicate that FR-R-D contains a certain amount of detergent in combination with fibril formations, while FR-R-W contains only fibril formations.
The identification of the particle pollutant in FR was carried out through staining with dyestuffs, Telon Blue M-GLW dye for the PES component, and Bezaktiv Brilliantblau V-R spez. for cotton cellulose (Table 3).
Photographs of the samples after staining in Table 3 show differences in the coloring of the composite, as well as in its structural residues filter. The diverse distribution on FRs indicates the MF released from the composite. The residues on the FR-W-W are higher than FR-W-D, which indicates a higher degree of load with pollutant particles in the effluent after washing. There is a significant effect of rinsing on the structural residues released from the composites compared to washing. The results of these analyses were used as guidelines for the sampling of a representative portion of the FR for pyrolysis.
The confirmed difference in FR after staining indicates the difference in the release of fibrils from the surface of the composite material, which is due to the influence in the process variables of washing and rinsing on the sheddability of structural parameters. As can be seen from the figures, this composite sample of cotton cellulose and PES releases smaller structural units, e.g., fibers, fibrils, and fragments during the washing and rinsing process. Due to the composition of the washing bath, dissolved and/or undissolved detergent ingredients can be adsorbed on the structural units, especially since they are not aimed for stain removal, thus they are oriented to a composite sample characterized by a large active surface.
By the Py-GC/MS technique, rapid screening of the chemical composition of the sample at the molecular level is made possible, especially in the case of a mixture of complex components, by comparing chromatograms of standard polymers [13,14,15,16,17,18].
Given the complexity of the observed washing system, pyrolysis of detergent, composite sample, and structural units was performed. The pyrolytic degradation of the standard detergent is shown in Figure 3 as a chromatogram with retention time.
The chemical compound as a pyrolytic product and quantitative indicators of detergents are shown in Table 4. Proposed identification by comparing with the chromatogram of standard polymers was performed and marked with font a, b, c, d, e, f, g, h as a superscript [19,20,21,22,23,24,25,26].
Given the composition and complexity of the CO/PES composite sample, pyrolysis of the whole composite sample and its structural elements was performed, as shown in Figure 4, Figure 5 and Figure 6 and Table 5.
The pollutant material from CO/PES is a composite material, whose mechanism of pyrolytic degradation is complex due to the share of certain structural parameters of the components in the fabric. The higher the proportion of each component, the greater the defragmentation, i.e., the products of pyrolytic degradation will be observed in higher concentrations. This can be clearly seen from the formation of levoglucosan (13.65%) and benzoic acid (1.08%) in the CO/PES sample (Table 5). It is known that in polyester the decarboxylation reaction of large polymer fragments causes the formation of benzenecarboxylic acid (benzoic acid) [17].
The presence of benzoic acid in a concentration of 1.08% in the CO/PES sample is proof that this is a polyester-based composite material. Furthermore, the defragmented benzoic acid products are further cleaved with cotton cellulose products, creating new inter-reactions, but also reactions at ionic levels, resulting in the formation of a very large number of compounds, as shown in Table 5. Observing the other obtained products of pyrolytic degradation, Table 5 shows that the compounds from cotton cellulose dominate, which is expected given the composition of the tested material, in which cotton predominates (with a 60% share) compared to polyester (a 40% share). This is supported by the fact that the compound with one of the largest shares in the sample CO/PES (60/40) is levoglucosan (13.65%).
In the primary process of pyrolytic degradation of cellulose, the glycosidic bond breaks down to form levoglucosan, while on the other hand, small molecules are formed by cleavage of the pyran ring and its reformation [18].
According to Moldoveanu [22], levoglucosan is one of the main products of pyrolytic degradation of cellulose formed at temperatures above 400 °C. Other significant secondary compounds that can be formed during pyrolytic degradation of cellulose can be divided into several groups, such as furans (furfural), sugar anhydrides, acids, esters, aldehydes, alcohols, pyrans, ketones, aromatic hydrocarbons, and phenols [25], some of which can be seen in Table 5. Generally, the mechanism of pyrolytic degradation of cellulose begins with three basic competitive reactions, side group (Ei) elimination of water, chain scissions by transglycosidation, and chain scissions with reverse aldolization (retroaldolization), followed by further degradation i:
Which type of these reactions will prevail depends on a large number of factors and is difficult to predict. In general, two pyrolytic cellulose degradation reactions, depolymerization and fragmentation, are possible in parallel. The process of depolymerization of cellulose includes the formation of anhydro-oligosaccharides, monomeric anhydrosugars and derivatives (dominated by levoglucosan), furans, cyclopentanones, and other products, while fragmentation (cleavage of the ring) involves the formation of linear carbonyls, linear alcohols, linear esters, and other compounds [27,28].
One of the examples of depolymerization is the reaction of intramolecular elimination (Ei) of H2O from the ring side groups with the formation of 5-hydroxymethyl-2-furancarboxaldehyde (0.51%) observed in the CO/PES sample according to reaction in Figure 7 as demonstrated [21,22].
As Figure 7 shows 5-Hydroxymethyl-2-furancarboxaldehyde is further degraded leading to the formation of furfural, which was observed in higher proportions also in samples FR-W-W (1.57%) and FR-R-W (0.70%) according to reaction in Figure 8 [22].
After the chromatogram analysis of the basic components of the system, the pyrolytic decomposition of FRs was performed for the purpose of a qualitative and quantitative assessment after the washing and rinsing process, depending on the bath composition. Based on the obtained mass spectra, only a part of the compounds can be reliably identified. This is due to the low concentration of some compounds, the coelution of compounds on the GC column, and the limitations of the mass spectrum database.
Pyrolysis-gas chromatography mass spectrometry and Py-GC/MS chromatograms of FR after washing and rinsing according to Figure 2 are typically complex, with numerous compounds detected (Table 6 and Table 7).
In FR-W-W and FR-R-W, the proportion of 5-hydroxymethyl-2-furancarboxaldehyde increases with the rinsing process, in order that it can be assumed that rinsing supports the reaction mechanism of the intramolecular elimination (Ei) of H2O from the ring side groups. During this process, other reactions can occur that can generate small molecules, such as formaldehyde, which was not observed in the samples, thus further degradation can be assumed. Another compound observed in Table 5 is formic acid with a content of 15.05%. It is known that cotton cellulose dissolves into formic acid in hydrothermal conditions in concentrations of up to 1% (w/w), which promotes the formation of sugars and oligomers [29]. Since in the CO/PES sample, apart from formic acid (15.05%), a high concentration of levoglucosan (13.65%) as well as oligomers were found, in this case it can also be said that in the mentioned sample the mechanism of Ei elimination of H2O dominates. The best example is the formation of levoglucosan according to reaction in Figure 9 [22].
The complete dominance of the reaction mechanism of the intramolecular elimination (Ei) of H2O from the side groups of the ring can also be observed by monitoring the content of levoglucosan in the samples FR-W-W (6.38%) and FR-R-W (1.83%).
The reaction mechanism of transglycosylation can also be observed in the samples of the filter residues FR-W-W and FR-R-W, through the formation of glycolaldehyde derivatives and glycolaldehyde dimers (1,4-Dioxane-2,5-diol). After washing, the concentration (1,4-Dioxane-2,5-diol) increased from 17.31% in the FR-R-W sample to 34.07% in the FR-W-W sample, from which it can be assumed that rinsing enhances the reaction mechanism of transglycosylation. Glycolaldehyde dimer (1,4-Dioxane-2,5-diol) was also observed in the CO/PES sample (60/40) with a content of 21.16% (Table 5).
Comparing the concentration of benzoic acid derived from polyester with the samples FR-W-W (2.17%) and FR-R-W (0.87%) in relation to the initial concentration in the sample CO/PES (1.08%) can be attributed to the decarboxylation of polyester.
2-Propanone, 1-hydroxy- (Acetol), which is one of the simple ketones, was found in higher concentrations in samples FR-W-W (5.20%) and FR-R-W (7.47%). Its formation is related to the degradation of glycerol, as in glycol aldehydes. Acetol contains both hydroxide and carbonyl functional groups, which are susceptible to decarboxylation and dehydroxylation due to pyrolysis. Samples FR-W-W and FR-R-W contain a large number of other ketones in addition to Acetol, which can be attributed to the decarboxylation process that prevails along with the defragmentation of benzoic acid. One example is the formation of β-ketonic acid in the FR-R-W sample. Pyrolysis of β-ketone acid is known to lead to CO2 elimination and ketone formation.
In the pyrolytic decomposition products of FR-W-D and FR-R-D, no levoglucosan formation was observed (Table 7), although it was found in the composite sample and FR-R-W. The reason for the absence of levoglucosan formation may be the competitive transglycosylation reaction, with chain cleavage. Its presence in the detergent sample comes from the cellulose derivative, carboxymethylcellulose (CMC), which was adsorbed to the cotton cellulose during washing. The CMC is a component of detergent that is aimed to antiredeposition of cellulose derived textiles during the washing process [30].
The results (Table 7 and Figure 10) show a significant influence in detergent on the composition of the filter residue, i.e., on the composition of released formations found in the effluent from washing and rinsing the CO/PES fabric, which confirms the previously explained TSS values.
An increased number of benzene ring-containing fragments was observed in the FR-W-D and FR-R-D samples. It can be presumed that these fragments originate from the basic raw materials for the production of LAS, which are dodecylbenzenesulfonate and chloroform [31]. The putative mechanism of pyrolytic degradation of FR is the splitting of the alkyl chain into smaller fragments with the benzene ring. The concentration of these compounds in the samples FR-W-D and FR-R-D increases and traces of fatty acids are visible.
The investigated pollutant—CO/PES material releases microfibers (MF) in the washing and rinsing process, which is evidenced by the presented results. It can be deduced that this material has the potential to pollute wastewater with dispersed particles, of which microfibers (MF) are of particular interest. This pollutant consists of a natural polymer (cellulose) and a synthetic one (PES), which not only have different properties but also pose some risk to the environment. Released cellulose fibers are readily biodegradable but have a high degree of swelling and thus the ability to retain adsorbed substances from a complex dispersion system, such as the washing process. As a result, they can bind and retain other pollutants in the wastewater, contributing to further contamination of the system at all levels. On the other hand, the component PES is a pollutant that is difficult to biodegrade, but due to its weak hydrophilicity and swelling ability, it cannot bind and retain pollutants as cellulose MF can [32].
Given the complexity of the system, which is manifested through the composite sample, the multi-component detergent that is not used to remove stains, high alkalinity, multiple washing and rinsing processes, there is a pronounced interaction of parameters affecting the release of fibrils or fibrous formations in washing. This research has confirmed that fragments of cotton cellulose prevail in the filter residue, which is not in line with studies claiming that PES releases more microfibers than cotton [16]. Therefore, the potential pollution of wastewater from this system manifests itself primarily in the retention and binding of other pollutants from textile processes.
As presented in this research, numerous reactions and degradation products are not sufficient to characterize and compare these complex systems, in which washing, rinsing, and bath composition (water and/or detergent) play a significant role. Therefore, the multivariate analysis algorithm was applied to the database of chromatograms for all FRs to obtain reduced data with new information about the system. All analyses were carried out on characteristic fragmentation ions (m/z) of datasets. HCA was performed to confirm the similarities and differences in individual FRs, and the results are shown in Figure 11.
The obtained dendrogram shows a grou** of FRs with similar characteristics, and the belonging to the same group of FRs obtained from the washing process is visible; there is no difference with respect to the applied bath (water and/or detergent). For FRs from the rinsing process, the influence in the bath is visible, since FR-R-D shows a significant difference compared to the other samples.

4. Conclusions

A potential pollutant was analyzed in the research, which can release microfibers during the washing and rinsing process. Due to its composite structure, the released particles may originate from the part composed of the component CO and the component PES. A systematic approach was used to prepare samples for analysis, and a new procedure or analytical protocol was introduced in which a composite was washed with detergent and water and the effluent was filtered to obtain a filter residue (FR) from which fragments were taken for analysis. In addition, the methodology used made an original or valuable contribution to the analysis of MF in wastewater from washing and rinsing process. The results showed that cotton cellulose fibrils predominated over polyester in the filter residue. Py-GC/MS was used to chemically characterize and verify the composite sample of cotton cellulose and polyester and to determine the chemical composition of the released fibers. The usefulness of pyrolysis to indirectly assess the loading level of effluents with dispersed particles originating from a composite sample and detergent was confirmed. The qualitative and quantitative data obtained from the chromatograms of the individual samples from FR indicate the dominance of the components of cotton cellulose degradation. Application of the multivariate analysis algorithm to the peak data from the chromatograms provided a clear representation of the observed variations in pyrolizates.

Author Contributions

Conceptualization, N.D., M.Č. and T.P.; writing—original draft preparation, T.P. and M.Č.; formal analysis, M.Č.; methodology, N.D. and B.V.; data curation, M.Č.; writing—review and editing, N.D., T.P. and M.Č.; project administration, T.P. and M.Č. All authors have read and agreed to the published version of the manuscript.

Funding

This research has been fully supported by the Croatian Science Foundation under the project IP-2020-02-7575 Assessment of microplastic shedding from polyester textiles in the washing process.

Institutional Review Board Statement

Not applicable.

Informed Consent Statement

Not applicable.

Data Availability Statement

Not applicable.

Conflicts of Interest

The authors declare no conflict of interest.

References

  1. Thompson, R.C.; Olsen, Y.S.; Mitchell, R.P.; Davis, A.; Rowland, S.J.; John, A.V.G.; Mcgonigle, D.F.; Russell, A.E. Lost at Sea: Where Is All the Plastic? Science 2004, 304, 838. [Google Scholar] [CrossRef] [PubMed]
  2. Barboza, L.G.A.; Dickvethaak, A.; Lavorante, B.R.B.O.; Lundebye, A.-K.L.; Guilhermino, L. Marine microplastic debris: An emerging issue for food security. Food Safety and Human Health. Mar. Pollut. Bull. 2018, 133, 336–348. [Google Scholar] [CrossRef] [PubMed]
  3. Barboza, L.G.A.; Vieira, L.R.; Guilhermino, L. Single and combined effects of microplastics and mercury on juveniles of the European seabass (Dicentrarchus labrax): Changes in behavioral responses and reduction of swimming velocity and resistance time. Environ. Pollut. 2018, 236, 1014–1019. [Google Scholar] [CrossRef]
  4. Browne, M.A.; Crump, P.; Niven, S.J.; Teuten, E.; Tonkin, A.; Galloway, T.; Thompson, R. Accumulation of Microplastic on Shorelines Woldwide: Sources and Sinks. Environ. Sci. Technol. 2011, 45, 9175–9179. [Google Scholar] [CrossRef] [PubMed]
  5. Pirc, U.; Vidmar, M.; Križan, A. Emissions of microplastic fibers from microfiber fleece during domestic washing. Environ. Sci. Pollut. Res. 2016, 23, 22206–22211. [Google Scholar] [CrossRef] [Green Version]
  6. Mathalon, A.; Hill, P. Microplastic fibers in the intertidal ecosystem surrounding Halifax Harbor, Nova Scotia. Mar. Pollut. Bull. 2014, 81, 69–79. [Google Scholar] [CrossRef]
  7. Almroth, B.M.C.; Åström, L.; Roslund, S.; Petersson, H.; Johansson, M.; Persson, N.-K. Quantifying shedding of synthetic fibers from textiles; a source of microplastics released into the environment. Environ. Sci. Pollut. Res. 2017, 25, 1191–1199. [Google Scholar] [CrossRef] [Green Version]
  8. Jönsson, C.; Arturin, O.L.; Hanning, A.-C.; Landin, R.; Holmström, E.; Roos, S. Microplastics Shedding from Textiles—Develo** Analytical Method for Measurement of Shed Material Representing Release during Domestic Washing. Sustainability 2018, 10, 2457. [Google Scholar] [CrossRef] [Green Version]
  9. De Wael, K.; Lepot, L.; Lunstroot, K.; Gason, F. Evaluation of the shedding potential of textile materials. Sci. Justice 2010, 50, 192–194. [Google Scholar] [CrossRef]
  10. European Environment Agency. Microplastic from Textiles: Towards a Circular Economy for Textiles in Europe. 2022. Available online: https://www.eea.europa.eu/publications/microplastics-from-textiles-towards-a (accessed on 10 March 2022).
  11. Henry, B.; Laitala, K.; Grimstad Klepp, I. Microfibres from apparel and home textiles: Prospects for including microplastics in environmental sustainability assessment. Sci. Total Environ. 2018, 652, 483–494. [Google Scholar] [CrossRef]
  12. Coralli, I.; Giorgi, V.; Vassura, I.; Rombola, A.G.; Fabbri, D. Secondary reactions in the analysis of microplastics by analytical pyrolysis. J. Anal. Appl. Pyrolysis 2021, 161, 105377. [Google Scholar] [CrossRef]
  13. Gomiero, A.; Øysæd, K.B.; Palmas, L.; Skogerbø, G. Application of GCMS-pyrolysis to estimate the levels of microplastics in a drinking water supply system. J. Hazard. Mater. 2021, 416, 125708. [Google Scholar] [CrossRef] [PubMed]
  14. O’Brien, S.; Okoffo, E.D.; O’Brien, J.W.; Ribeiro, F.; Wang, X.; Wright, S.L.; Samanipourace, S.; Rauerta, C.; Yessenia, T.; Toapanta, A.; et al. Airborne emissions of microplastic fibres from domestic laundry dryers. Sci. Total Environ. 2020, 747, 141175. [Google Scholar] [CrossRef] [PubMed]
  15. De Falco, F.; Gullo, M.P.; Gentile, G.; Di Pace, E.; Cocca, M.; Gelabert, L.; Brouta-Agnésa, M.; Rovira, A.; Escudero, R.; Villalba, R.; et al. Evaluation of microplastic release caused by textile washing processes of synthetic fabrics. Environ. Pollut. 2018, 236, 916–925. [Google Scholar] [CrossRef]
  16. Palacios-Mateo, C.; van der Meer, Y.; Seide, G. Analysis of the polyester clothing value chain to identify key intervention points for sustainability. Environ. Sci. Eur. 2021, 33, 1–25. [Google Scholar] [CrossRef] [PubMed]
  17. Cho, M.S.; Kim, M.D.; Park, S.W.; Yoon, K.J.; Nam, J.D.; Lee, J.H.; Lee, Y.K. Analysis of cotton/polyester fabrics using pyrolysis gas chromatography. Polymers 2003, 27, 271–274. [Google Scholar]
  18. Chen, L.; Liao, Y.; Guo, Z.; Cao, Y.; Ma, X. Products distribution and generation pathway of cellulose pyrolysis. J. Clean. Prod. 2019, 232, 1309–1320. [Google Scholar] [CrossRef]
  19. NIST/NIH/EPA. Mass Spectral Library, Standard Reference Database 1, NIST 05. Standard Reference Data Program; National Institute of Standards and Technology: Gaithersburg, MD, USA, 2005. [Google Scholar]
  20. F-SEARCH Analytical Software 3.0 with Library for Polymeric Materials; Frontier Laboratories, Ltd.: Koriyama, Fukushima, Japan.
  21. Moldoveanu, S.C. Pyrolysis of Organic Molecules with Applications to Health and Environment; Elsevier: Amsterdam, The Netherlands, 2010; Volume 28. [Google Scholar]
  22. Moldoveanu, S.C. Pyrolysis of Organic Molecules with Applications to Health and Environment; Elsevier: Amsterdam, The Netherlands, 1998; Volume 20. [Google Scholar]
  23. Tsuge, S.; Ohtani, H.; Watanabe, C. Pyrolysis-GC/MS of High Polymers—Fundamentals and Pyrogram Compilations; Techno System Co., Ltd.: Tokyo, Japan, 2006. [Google Scholar]
  24. Moldoveanu, S.C. Pyrolysis of Organic Molecules with Applications to Health and Environment; Elsevier: Amsterdam, The Netherlands, 2005; Volume 25. [Google Scholar]
  25. Wang, L.; Shen, Y. Pyrolysis characteristics of cellulosic biomass in the presence of alkali and alkaline-earth-metal (AAEM) oxalates. Cellulose 2021, 28, 3473–3483. [Google Scholar] [CrossRef]
  26. Brock, B. Confidence Was Never Recorded for This Value, Application of Solid Phase Micro-Extraction (SPME)—GC-MS for Identifying Pyrolysis Compounds in Textiles. Master’s Thesis, University of Manitoba, Winnipeg, MB, Canada, 2016. [Google Scholar]
  27. Lu, L.; Yang, X.; Dong, C.; Zhang, Z.; Zhang, X.; Zhu, X. Influence of pyrolysis temperature and time on the cellulose fast pyrolysis products: Analytical Py-GC/MS study. J. Anal. Appl. Pyrolysis 2011, 92, 430–438. [Google Scholar] [CrossRef]
  28. Nacci, T.; Sabatini, F.; Cirrincione, C.; Degano, I.; Columbini, M.P. Characterization of textile fibres by means of EGA-MS and Py-GC/MS. J. Anal. Appl. Pyrolysis 2022, 165, 105570. [Google Scholar] [CrossRef]
  29. Saoka, Y.; Funazukuri, T. Hydrothermal saccharification of cotton cellulose in dilute aqueous formic acid solution. Res. Chem. Intermed. 2011, 37, 233–242. [Google Scholar] [CrossRef]
  30. Višić, K.; Pušić, T.; Čurlin, M. Carboxymethyl Cellulose and Carboxymethyl Starch as Surface Modifiers and Greying Inhibitors in Washing of Cotton Fabrics. Polymers 2021, 13, 1174. [Google Scholar] [CrossRef] [PubMed]
  31. Bozeya, A.; Bawab, A.; Fayyad, M. Method development for analysis of linear and branched alkyl benzene sulfonates. Fresenius Environ. Bull. 2009, 18, 590–600. [Google Scholar]
  32. Egan, J.; Salmon, S. Strategies and progress in synthetic textile fiber biodegradability. SN Appl. Sci. 2021, 4, 22. [Google Scholar] [CrossRef]
Figure 1. Digital micrographs of composite fabric with basic structural elements as pollution material magnification 55×.
Separations 09 00292 g001
Figure 2. Schematic representation of the washing and rinsing cycles, as well as the collection of effluents for filtration and identification methods.
Separations 09 00292 g002
Figure 3. Chromatogram of reference detergent.
Separations 09 00292 g003
Figure 4. Chromatogram of composite fabric sample.
Separations 09 00292 g004
Figure 5. Chromatogram of warp yarn as structural unit of cotton cellulose in blend with polyester.
Separations 09 00292 g005
Figure 6. Chromatogram of cotton cellulose (weft yarn).
Separations 09 00292 g006
Figure 7. The formation of 5-Hydroxymethyl-2-furancarboxaldehyde.
Separations 09 00292 g007
Figure 8. The formation of furfural.
Separations 09 00292 g008
Figure 9. The formation of levoglucosan.
Separations 09 00292 g009
Figure 10. Chromatograms of FRs after (a) washing in detergent and (b) rinsing.
Separations 09 00292 g010aSeparations 09 00292 g010b
Figure 11. HCA dendrogram of the Py-GC/MS dataset for FRs.
Separations 09 00292 g011
Table 1. FR labels.
Table 1. FR labels.
DesignationDescription
FR-W-DFilter residue after washing of fabric in detergent
FR-W-WFilter residue after washing of fabric in water
FR-R-DFilter residue after rinsing of fabric washed in detergent
FR-R-WFilter residue after rinsing of fabric washed in water
Table 2. Average values of total suspended substances, TSS, and mass of FRs.
Designationm FR (mg)TSS (mg/L)
FR-W-D2.3331.13
FR-W-W1.0714.2
FR-R-D5.4772.9
FR-R-W4.6762.2
Table 3. Photo of the composite sample and FRs after the staining tests.
SampleTelon ® Blue M-GLWBezaktiv Brilliantblau V-R Spez.
Separations 09 00292 i001Separations 09 00292 i002
FR-W-DSeparations 09 00292 i003Separations 09 00292 i004
FR-W-WSeparations 09 00292 i005Separations 09 00292 i006
FR-R-DSeparations 09 00292 i007Separations 09 00292 i008
FR-R-WSeparations 09 00292 i009Separations 09 00292 i010
Table 4. Pyrolytic products and quantitative indicators of the detergent.
IDChemical Compoundm/zRt (min)Area Percentage (%)Similarity Index
12-Propanamine, 1-methoxy- a441.17.8095
21-Hexene a,b,c,d,e,f561.49.4396
31-Heptene a,b,d,e,f561.77.7398
4Toluene a,b,c,d,e,f912.211.1095
51-Octene a,b,e,f552.53.9999
6Octane a,b,f432.54.7598
7Ethylbenzene a,b,c,d,e,g,h913.32,6497
81-Nonene a,b,c,e,f563.73.4599
9Nonane a,d,f573.93.7599
10Furfural a,b,c,d,f,g,h964.14.1298
11Benzene, propyl- a914.91.4197
12alpha-Methylstyrene a,b,c,d,e,f1185.50.7292
131-Decene a,b,e,f565.72.3399
142(5H)-Furanone a,d555.85.8095
15Undecane a,d,f575.92.2999
16Benzene, butyl- a,d917.30.6495
17Cyclopropane, nonyl- a558.21.6499
18Undecane a,d,f578.41.2299
192-Undecene, (E)- a558.60.3899
205-Undecyne a549.10.4999
21Benzene, pentyl- a919,90.5897
22Naphthalene a,b,c,d,e,f12810.61.2798
23Cyclopropane, nonyl- a5510.90.7999
24Dodecane a,b,f5711.10.7599
256-Dodecyne a5411.80.4899
261-Tridecene a,b,c,d,e,f5513.60.7799
27Hexadecane a,b,c,d5713.81.3999
281-Tetradecene a,b,c,d,e,f5516.21.1099
299-Eicosene, (E)- a5518.72.6399
30Pentadecane a,b,c,d5718.90.7299
31Bicyclo[3,2,1]octa-2,6-diene, 2-phenyl- a9119.70.4994
32Dodecanoic acid a,f6020.80.7994
331,15-Hexadecadiene a,b,e5522.80.4599
341,19-Eicosadiene a5522.90.3699
352-Heptadecanone a,d5827.60.5395
36l-(+)-Ascorbic acid 2,6-dihexadecanoate a7329.11.1399
37Tetrapentacontane, 1,54-dibromo- a6942.36.3999
38Cyclohexane,1,2,3,5-tetraisopropyl- a6953.44.7097
a Proposed identification by comparing the spectrum with the NIST 05 library [19]. b Proposed identification by comparing the spectrum with the Frontier F -SEARCH 3.0 library [20]. c Proposed identification by comparing the spectrum with the literature reference [21]. d Proposed identification by comparing the spectrum with the literature reference [22]. e Proposed identification by comparing the spectrum with the literature reference [23]. f Proposed identification by comparing the spectrum with the literature reference [24]. g Proposed identification by comparing the spectrum with the literature reference [25]. h Proposed identification by comparing the spectrum with the literature reference [26].
Table 5. Pyrolytic products and quantitative indicators of the CO/PES composite fabric.
IDChemical Compoundm/zRt (min)CO/PES (%) Similarity Index
1Carbon dioxide a,b.c441.211.8998
2Ethylene oxide a,b,c,d,e,f291.32.8297
3Methylglyoxal b431.410.9398
4Formic acid a,b,c,d,e291.615.0597
5Glycolaldehyde dimer (1,4-Dioxane-2,5-diol) a,d311.721.1699
6Methyl vinyl ketone a,b,f431.81.6691
7Acetol b742.24.0199
8Hydroxyacetaldehyde b312.20.7597
9Diisobutylamine (N-B) borane a292.70.1895
10Furan, 2,5-dihydro-3-methyl- a292.80.0995
11Vinyl crotonate a393.00.0999
12Methylacrylate a,e553.10.5399
131-Nitro-2-propanone a433.31.8399
14Propanoic acid, 2-oxo-, methyl ester (methyl pyruvate) a,d,h433.52.9099
15(S)-5-Hydroxymethyl-2[5H]-furanone a,d843.70.7699
16Furfural a,b,c,d,f,g,h394.10.0999
171-Octene a,b,e,f414.30.8796
182-Furanmethanol a,d,h414.40.1796
19Methyl 1-methylcyclopropyl ketone a434.60.1696
202(3H)-Furanone, 5-methyl- a,d435.21.1897
212(5H)-Furanone a,d555.80.3397
225-Methylfuran-2(3H)-one a,d,e986.60.4797
23Oxalic acid, cyclobutyl isohexyl ester a,b557.00.0995
24Pentanoic acid, 2,4-dioxo-, methyl ester a437.30.1096
25Spiro [2,4]heptan-4-one a1107.60.2092
263-Cyclobutene-1,2-dione, 3,4-dihydroxy- a298.40.8399
271,2-Cyclopentanedione, 3-methyl- a,d1129.50.1297
284-Nonene a,b559.0.1798
292,5-Dimethyl-4-hydroxy-3(2H)-furanone a,d4311.00.8699
30Levoglucosenone a,d,g3911.40.1096
311-Heptanol, 2-propyl- a12611.80.1396
32Hydroperoxide, 1-methylhexyl a,b,c4313.51.6999
33Benzoic acid, ethyl ester a10513.90.0695
34Benzenecarboxylic acid (Benzoic acid) a,b,c,d,e10514.21.0897
351,3-Dioxolane, 2,4,5-trimethyl- a,b4314.70.0396
363-Propylglutaric acid a4114.90.1894
372-Furancarboxaldehyde, 5-(hydroxymethyl)- a,b,c,g4115.00.5193
382-Butene, 1,4-diethoxy- a2917.60.6599
394-Ethylbenzoic acid a10519.50.1195
401,6-Anhydro-, beta-D-glucopyranose (levoglucosan) a,b,c,d,g6022.513.6596
411-Butene, 3-methyl-3-(1-ethoxyethoxy) a4525.20.1796
42n-Hexadecanoic acid a4333.30.0798
432,6,10,14,18,22-Tetracosahexaene, 2,6,10,15,19,23-hexamethyl-, (all-E)- a6947.80.2799
441-Octacosanol, 2,4,6,8-tetramethyl-, (all-R)- a6951.20.2298
a Proposed identification by comparing the spectrum with the NIST 05 library [19]. b Proposed identification by comparing the spectrum with the Frontier F -SEARCH 3.0 library [20]. c Proposed identification by comparing the spectrum with the literature reference [21]. d Proposed identification by comparing the spectrum with the literature reference [22]. e Proposed identification by com-paring the spectrum with the literature reference [23]. f Proposed identification by comparing the spectrum with the literature reference [24]. g Proposed identification by comparing the spectrum with the literature reference [25]. h Proposed identification by comparing the spectrum with the literature reference [26].
Table 6. Results of analysis of FRs degradation products after washing in water and subsequent rinsing.
IDChemical Compoundm/zRt (min)FR-R-W (%)Similarity IndexFR-W-W (%)Similarity Index
1Carbon dioxide a,b,c441.2--34.4297
2Cyclopentane a,b,c,d421.3--8.2598
3Acetaldehyde a,e,g291.35.4498-
4Ethylene oxide a,b,c,d,e,f291.3- 3.8097
5Methylglyoxal b431.48.069917.2098
6Glycolaldehyde dimer (1,4-Dioxane-2,5-diol) a,d311.617.319934.0798
72,3-Butanedione a,d431.81.3896-
8Butanoic acid, 2-oxo- a291.8--0.9794
9Acetol-. b432.25.20977.4799
10Hydroxyacetaldehyde b312.20.67981.1899
11Isopropenyl methyl ketone(3-Buten-2-one. 3-methyl-) a.d412.30.2699-
121-Octene a,b,e,f552.40.1598-
13Octane a,b,f432.50.1597-
142(3H)-Furanone, 5-ethoxydihydro- a,d292.70.32980.3597
15Furan, 2,5-dihydro-3-methyl- a292.80.24980.2397
16Methylacrylate a,d553.1- 0.8298
17Pent-2-ynal a533.10.2093-
182,3-Pentanedione a,b,c,d433.32.06953.2396
192(5H)-Furanone a,d553.40.2497-
20Propanoic acid, 2-oxo-, methyl ester (methyl pyruvate) a,d,h433.53.84994.5799
21Pyrolidine, 1-[2-(1,3-cyclopentadien-1-yl)ethyl]- a,d843.71.03950.9999
22Furfural a,b,c,d,f,g,h394.10.70991.5799
231-Octene a,b,e,f414.30.1299--
242-Furanmethanol a,d,h414.40.30990.3197
25Pyruvic aldehyde a,d,e434.60.19960.2497
262-Butanone a,d434.70.39960.3097
272(3H)-Furanone, 5-methyl- a,d435.20.38971.7997
282(5H)-Furanone a,d555.70.61980.6098
29Pentane, 2-chloro- a426.30.4698--
305-Methylfuran-2(3H)-one a,d,e986.60.97980.8598
31Spiro[2,4]heptan-4-one a1107.6- 0.2990
322(1H)Pyrimidinone,1-methyl- a397.6--0.5498
333-Cyclobutene-1,2-dione, 3,4-dihydroxy- a298.40.31990.9699
344-Methyl-5H-furan-2-one a,d699.2- 0.2894
351,2-Cyclopentanedione, 3-methyl- a,d1129.40.26970.1997
362,5-Dimethyl-4-hydroxy-3(2H)-furanone a,d4311.00.43991.0895
37Levoglucosenone a,d,g3911.4--0.1696
381-Heptanol, 2-propyl- a12611.9--0.2495
39Phenylglyoxal a10512.90.9098--
40Hydroperoxide, 1-methylhexyl a,b,c,d4313.41.05992.5691
41Benzenecarboxylic acid (Benzoic acid) a,b,c,d,e10514.22.17960.8798
421,4:3,6-Dianhydro-,alpha,-d-glucopyranose a,d6914.6--0.1494
43Beta,-D-Glucopyranoside, methyl 3,6-anhydro- a,d2914.80.2097--
443-Propylglutaric acid a4114.91.44970.8697
454-Hexen-3-one, 4,5-dimethyl- a4115.1- 0.8996
461-Tetradecene a,b,c,d,e,f5516.2- 0.8998
472-Butene, 1,4-diethoxy- a2917.6- 1.1599
481,5-Dihydroxy-4-methyl-1-phenylpentan-3-one a13119.60.1192-
49Biphenyl a,b,c,d,g,h15419.80.3896-
501,2-Ethanediol, monobenzoate a10520.40.3296-
511,6-Anhydro-,beta,-D-glucopyranose (levoglucosan) a,b,c,d,f,g6022.41.83966.3895
525-methylhydantoin a,e17524.40.4998-
533-Hexanol, 2,4-dimethyl- a4525.2- 0.3898
541,4-Benzenedicarboxylic acid, bis(2-hydroxyethyl) ester (Bis(hydroxyethyl) terephthalate) a,b,c19331.040.4798-
55n-Hexadecanoic acid a4333.30.1398-
564-Hydroxy-,gamma,-(4-hydroxyphenyl)-,gamma,-methylbenzenebutanoic acid, methyl ester a21337.0- 0.4590
57Phthalazine-1,4(2H,3H)-dione, 2-(2-methyl-5-nitrophenyl)- a29743.90.4598-
582,6,10,14,18,22-Tetracosahexaene, 2,6,10,15,19,23-hexamethyl-, (all-E)- a6947.80.56990.4596
59N-Benzoyl-dl-alanine a10548.60.1797
603-Phenyl-2-ethoxypropylphthalimide a10448.90.1992-
61Tetrapentacontane, 1,54-dibromo- a6950.10.0892-
62o-(4,6-Diphenyl-1,3,5-triazin-2-yl)phenol a36750.30.2194-
a Proposed identification by comparing the spectrum with the NIST 05 library [19]. b Proposed identification by comparing the spectrum with the Frontier F -SEARCH 3.0 library [20]. c Proposed identification by comparing the spectrum with the literature reference [21]. d Proposed identification by comparing the spectrum with the literature reference [22]. e Proposed identification by com-paring the spectrum with the literature reference [23]. f Proposed identification by comparing the spectrum with the literature reference [24]. g Proposed identification by comparing the spectrum with the literature reference [25]. h Proposed identification by comparing the spectrum with the literature reference [26].
Table 7. Results of the analysis of FR pyrolysis products after washing in detergent and subsequent rinsing.
IDChemical Compoundm/zRt (min)FR-W-D (%)Similarity IndexFR-R-D (%)Similarity Index
1Carbon dioxide a,b,c441.254.889936.8699
2Ethylene oxide a,b,c,d,e291.3- 1.9896
32-Butene, (E)- a,b,c,d,e411.31.2296-
4Methylglyoxal b431.4- 0.9299
5Cyclopropane, ethyl- a,b,e421.50.9497--
61-Hexene a,b,c,d,e411.90.6299-
71-Heptene a,b,d,e412.70.6499-
8Heptane a,b,c,d,e432.90.3993-
9Ethylbenzene a,b,c,d,e,g913.30.7099-
101,3,5-Cycloheptatriene a,b913.74.4599-
111-Octene a,b,d,e414.30.4499-
12Octane a,b,e434.50.3598-
13Butyrolactone a,b,c,e425.8- 0.7098
14Undecane a,c,e575.9- 0.2098
15Bicyclo[4,2,0]octa-1,3,5-triene a1046.20.3999--
161-Nonene a,b,c,e416.50.3499--
17Benzene, propyl- a,b,e917.90.7399--
18(3H)Indazole, 3,3-dimethyl- a,b1188.60.2799--
193-Tridecene, (Z)- a419.30.2999--
20Benzene, butyl- a,c9110.90.4999--
212-Tridecene, (Z)- a,b,c,d,e4112.20.2499--
22Benzene, pentyl- a,c9113.90.55980.9299
23Benzene, hexyl- a,c9116.90.52990.9199
24Benzene, (1-methylenepentyl)- a11818.90.69980.4098
25Benzene, heptyl- a,c9119.70.40980.8799
26Benzene, (1-methylenepentyl)- a11821.6--0.4297
27Benzene, (1-butylhexyl)- a9124.21.31953.4699
28Benzene, octyl- a,c9122.40.37980.7699
29Benzene, (1-propylheptyl)- a9124.40.96992.6399
30Benzene, (1-ethyloctyl)- a9124.90.85992.3199
31Benzene, nonyl- a.9225- 0.4295
32Benzene, (1-methylnonyl)- a10525.71.20993.1299
33Benzene, (1-pentylhexyl)- a9126.51.08982.7399
34Benzene, (1-butylheptyl)- a9126.52.30995.9899
35Benzene, (1-propyloctyl)- a9126.81.65994.1899
36Benzene, (1-ethylnonyl)- a9127.31.48993.5399
37Benzene, decyl- a,b9227.4- 0.2997
38Benzene, (1-methyldecyl)- a10528.12.24994.6199
39Benzene, (1-pentylheptyl)- a9128.71.61993.3799
40Benzene, (1-butyloctyl)- a9128.81.46992.9699
41Benzene, (1-methylenepentyl)- a11828.9- 0.3193
42Benzene, (1-propylnonyl)- a9129.01.16982.1299
43Benzene, (1-ethyldecyl)- a9129.51.05991.7599
44Benzene, (1-methylundecyl)- a10530.31.63992.2499
45Benzene, (1-pentyloctyl)- a9130.81.68992.3799
46Benzene, (1-butylnonyl)- a9130.91.10991.4399
47Benzene, (1-propyldecyl)- a9131.20.84990.9799
48Benzene, (1-ethylundecyl)- a9131.70.73980.8198
49Benzene, (1-methyldodecyl)- a10532.51.09 1.02
502,6,10,14,18,22-Tetracosahexaene, 2,6,10,15,19,23-hexamethyl-, (all-E)- a6947.80.9098--
51Propiohydrazide, 3-phenyl-N2-(2-benzoyloxybenzylideno)-a10548.32.9396-
52n.i.20752.9- 0.0990
a Proposed identification by comparing the spectrum with the NIST 05 library [19]. b Proposed identification by comparing the spectrum with the Frontier F -SEARCH 3.0 library [20]. c Proposed identification by comparing the spectrum with the literature reference [21]. d Proposed identification by comparing the spectrum with the literature reference [22]. e Proposed identification by com-paring the spectrum with the literature reference [23]. f Proposed identification by comparing the spectrum with the literature reference [24]. g Proposed identification by comparing the spectrum with the literature reference [25]. h Proposed identification by comparing the spectrum with the literature reference [26].
Publisher’s Note: MDPI stays neutral with regard to jurisdictional claims in published maps and institutional affiliations.

