1. Introduction
In the last decade, e-commerce has grown due to the increased demand of consumers [
1]. Thus, last-mile deliveries (LMDs) have become crucial for delivering goods to customers, making city centres one of the most important and complex areas. City centres are characterised by a limited area structure, road disruptions, traffic accidents, and congestion, making freight deliveries within cities a challenge [
2,
3,
4].
As observed by Ref. [
5], deliveries in city centres require a large number of trips, vehicles, and kilometres travelled, generating higher costs in goods distribution. Considering this fact, technology has emerged as an essential component for mitigating uncertain future events, e.g., the Internet of things, big data analytics, blockchain technologies, and artificial intelligence [
6]. Among the emerging technologies for LMDs, web map** platforms and application programming interfaces (APIs) are extensively considered due to their stronger spatial analysis capability for route efficiency, route optimisation, travel cost, etc. [
7,
8].
Even though LMD problems have been widely studied, there is still an opportunity for innovative last-mile delivery solutions [
9]. This paper aims to contribute to fulfilling this gap and proposes an analytical model, based on Google API and Google OR, to measure the impact of an n-number of disruptions in the last-mile delivery operation. To validate our approach, we conducted computational experiments using real data from three different cities (i.e., Boston, US; Bogotá, Colombia; and Pamplona, Spain) to evaluate the impact of up to 100 disruptions in different city contexts. These cities were selected because they are located in different geographical areas and present different characteristics in population, history, and urban development. Our results provide managerial insights for key stakeholders (i.e., carriers, consumers, and government) to improve the resilience and capabilities of the cities’ transportation systems.
The remainder of this paper is organised as follows. In
Section 2, we present a related literature review. In
Section 3, we introduce the proposed approach. The multicase study details and results are discussed in
Section 4. Finally, we provide some conclusions and future research directions in
Section 5.
2. Literature Review
Last-mile logistics refers to the direct connection between the service provider and the end customer [
10]. Due to its relevance, the number of articles on city logistics for determining issues, modelling efforts, trends, and gaps has increased [
10]. In this context, understanding and analysing transport behaviour in different cities allows estimating the impact of last-mile operations in cities [
11].
The type of city and its infrastructure play an important role in transport behaviour. From a practical perspective, Ref. [
12] present an analysis of developed and develo** countries’ logistics efficiency. The authors affirm there is a wide range of logistics performance levels among cities due to discrepancies between transport networks, infrastructure, and transport regulations, as well as the influence of the economic sector. In order to control decision making by companies, local governments have established strategies for transport management. Policies and management strategy provision for city logistics tend to be against the management strategies of logistics enterprises [
13]. Refs. [
13,
14] present a collection and analysis of different public policies for urban transport behaviour. Thus, the significant challenges facing last-mile logistics are the infrastructure, local government management, and transport behaviour for decision making [
10].
The inclusion of communication and information technologies makes part of the solution to deal with last-mile logistics [
15]. Some solutions are aimed at understanding urban transport behaviour by collecting and analysing large amounts of data. For example, the use of application programming interfaces (APIs) to carry out efficient scheduling and real-time optimisation of last-mile logistics [
15]. Ref. [
16] recognises the importance of urban transport data to understand transport behaviour in a city for efficient logistics decisions. As a result, the efforts in the development of models and API have increased [
17]. Ref. [
18] presents the strengths and limitations of an API-based approach to studying urban transport.
The accessibility to a massive amount of data has motivated the development of methodologies to treat and use data efficiently. In general, these methodologies focus on data cleaning strategies and data accuracy validation [
6]. From a logistics perspective, managing large amounts of data and making transport decisions are among the challenges of logistics operations [
8]. The inclusion of these data in the models for decision making gives the opportunity to estimate the travelling demand, travelling cost, and the level of congestion in urban areas [
19].
Data models that interact with the geographical structure of cities allow extracting macro- and microscale transport information [
20]. As a result, web map** platforms, such as OpenStreetMap and Google Maps, have emerged for supporting decision making in transport operations [
8,
21,
22]. Ref. [
8] presents an analysis in which they look at the relationship between travel times and congestion levels in a city. The authors show that these studies shed light on transport behaviour. Similar studies show the relevance of these studies for policymaking, urban transport [
8,
18,
23,
24], emergency management [
25], and environment protection [
25,
26].
Some applications of Google Maps API include vehicle routing problems [
25]. Ref. [
27] studies the public transport of 13 German cities to determine the average of a reasonable detour in passenger transport. Although studies on traffic behaviour and its potential disruptions have been found, there is a lack of research related to measuring the impact of multiple disruptions on transportation operations [
28]. Several commercial and industrial projects are looking to develop strategies to manage and reduce the impact of disruptions in transport operations [
29]. This leads us to the following research questions:
Aiming to close the research and practical gap, this article presents routing strategies to manage disruptions in urban transport. Routing decisions are based on a statistical analysis of data from the Google Maps API to understand urban transport behaviour and the impact of disruptions in terms of congestion. In this field, studies determine the routing decisions under the criterion of the shortest path. These studies do not consider possible variations in the route, i.e., the occurrence of a disruption in the shortest path.
3. Proposed Approach
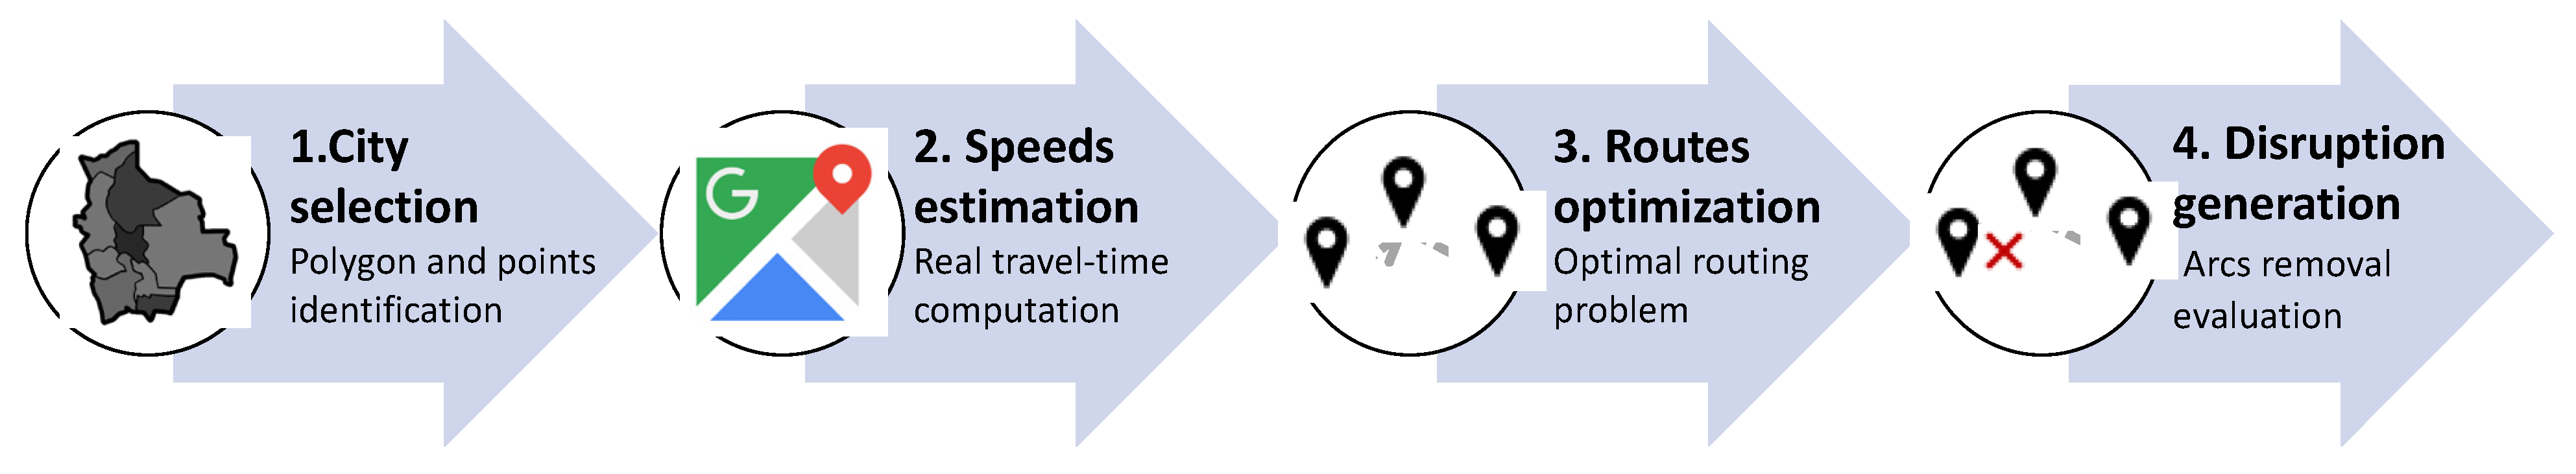
In this section, we present a new method for the collection of data and the analysis of disruptions in last-mile delivery operations that allows comparing different cities and/or regions.
Figure 1 shows the general representation of the proposed approach.
In the first step, we select the city to be studied. Using a geographic information system (GIS) software, a polygon in a geospatial vector data format defines the geographic boundaries of the city. These geographic boundaries may correspond to any region, neighbourhood, or other geographic area specified a priori by the decision maker. Once the polygon has been defined, we generate m random points (i.e., customers) inside its geographic boundaries. As pointed out by Ref. [
30], this random generation makes it possible to subsequently estimate real traffic data.
The second step consists of estimating the corresponding distances and speeds between each pair of points generated in the previous step. To do so, we use the Google Maps Directions API [
31]. According to Ref. [
25], the main benefits of using Google Maps API are the easy preparation of the data set, the utilisation of updated road data and road congestion, and the distinction between peak hours and off-peak hours. Therefore, using the travel information calculated by Google API is a promising, easy-to-use, and low-cost method to retrieve real-time traffic data [
30].
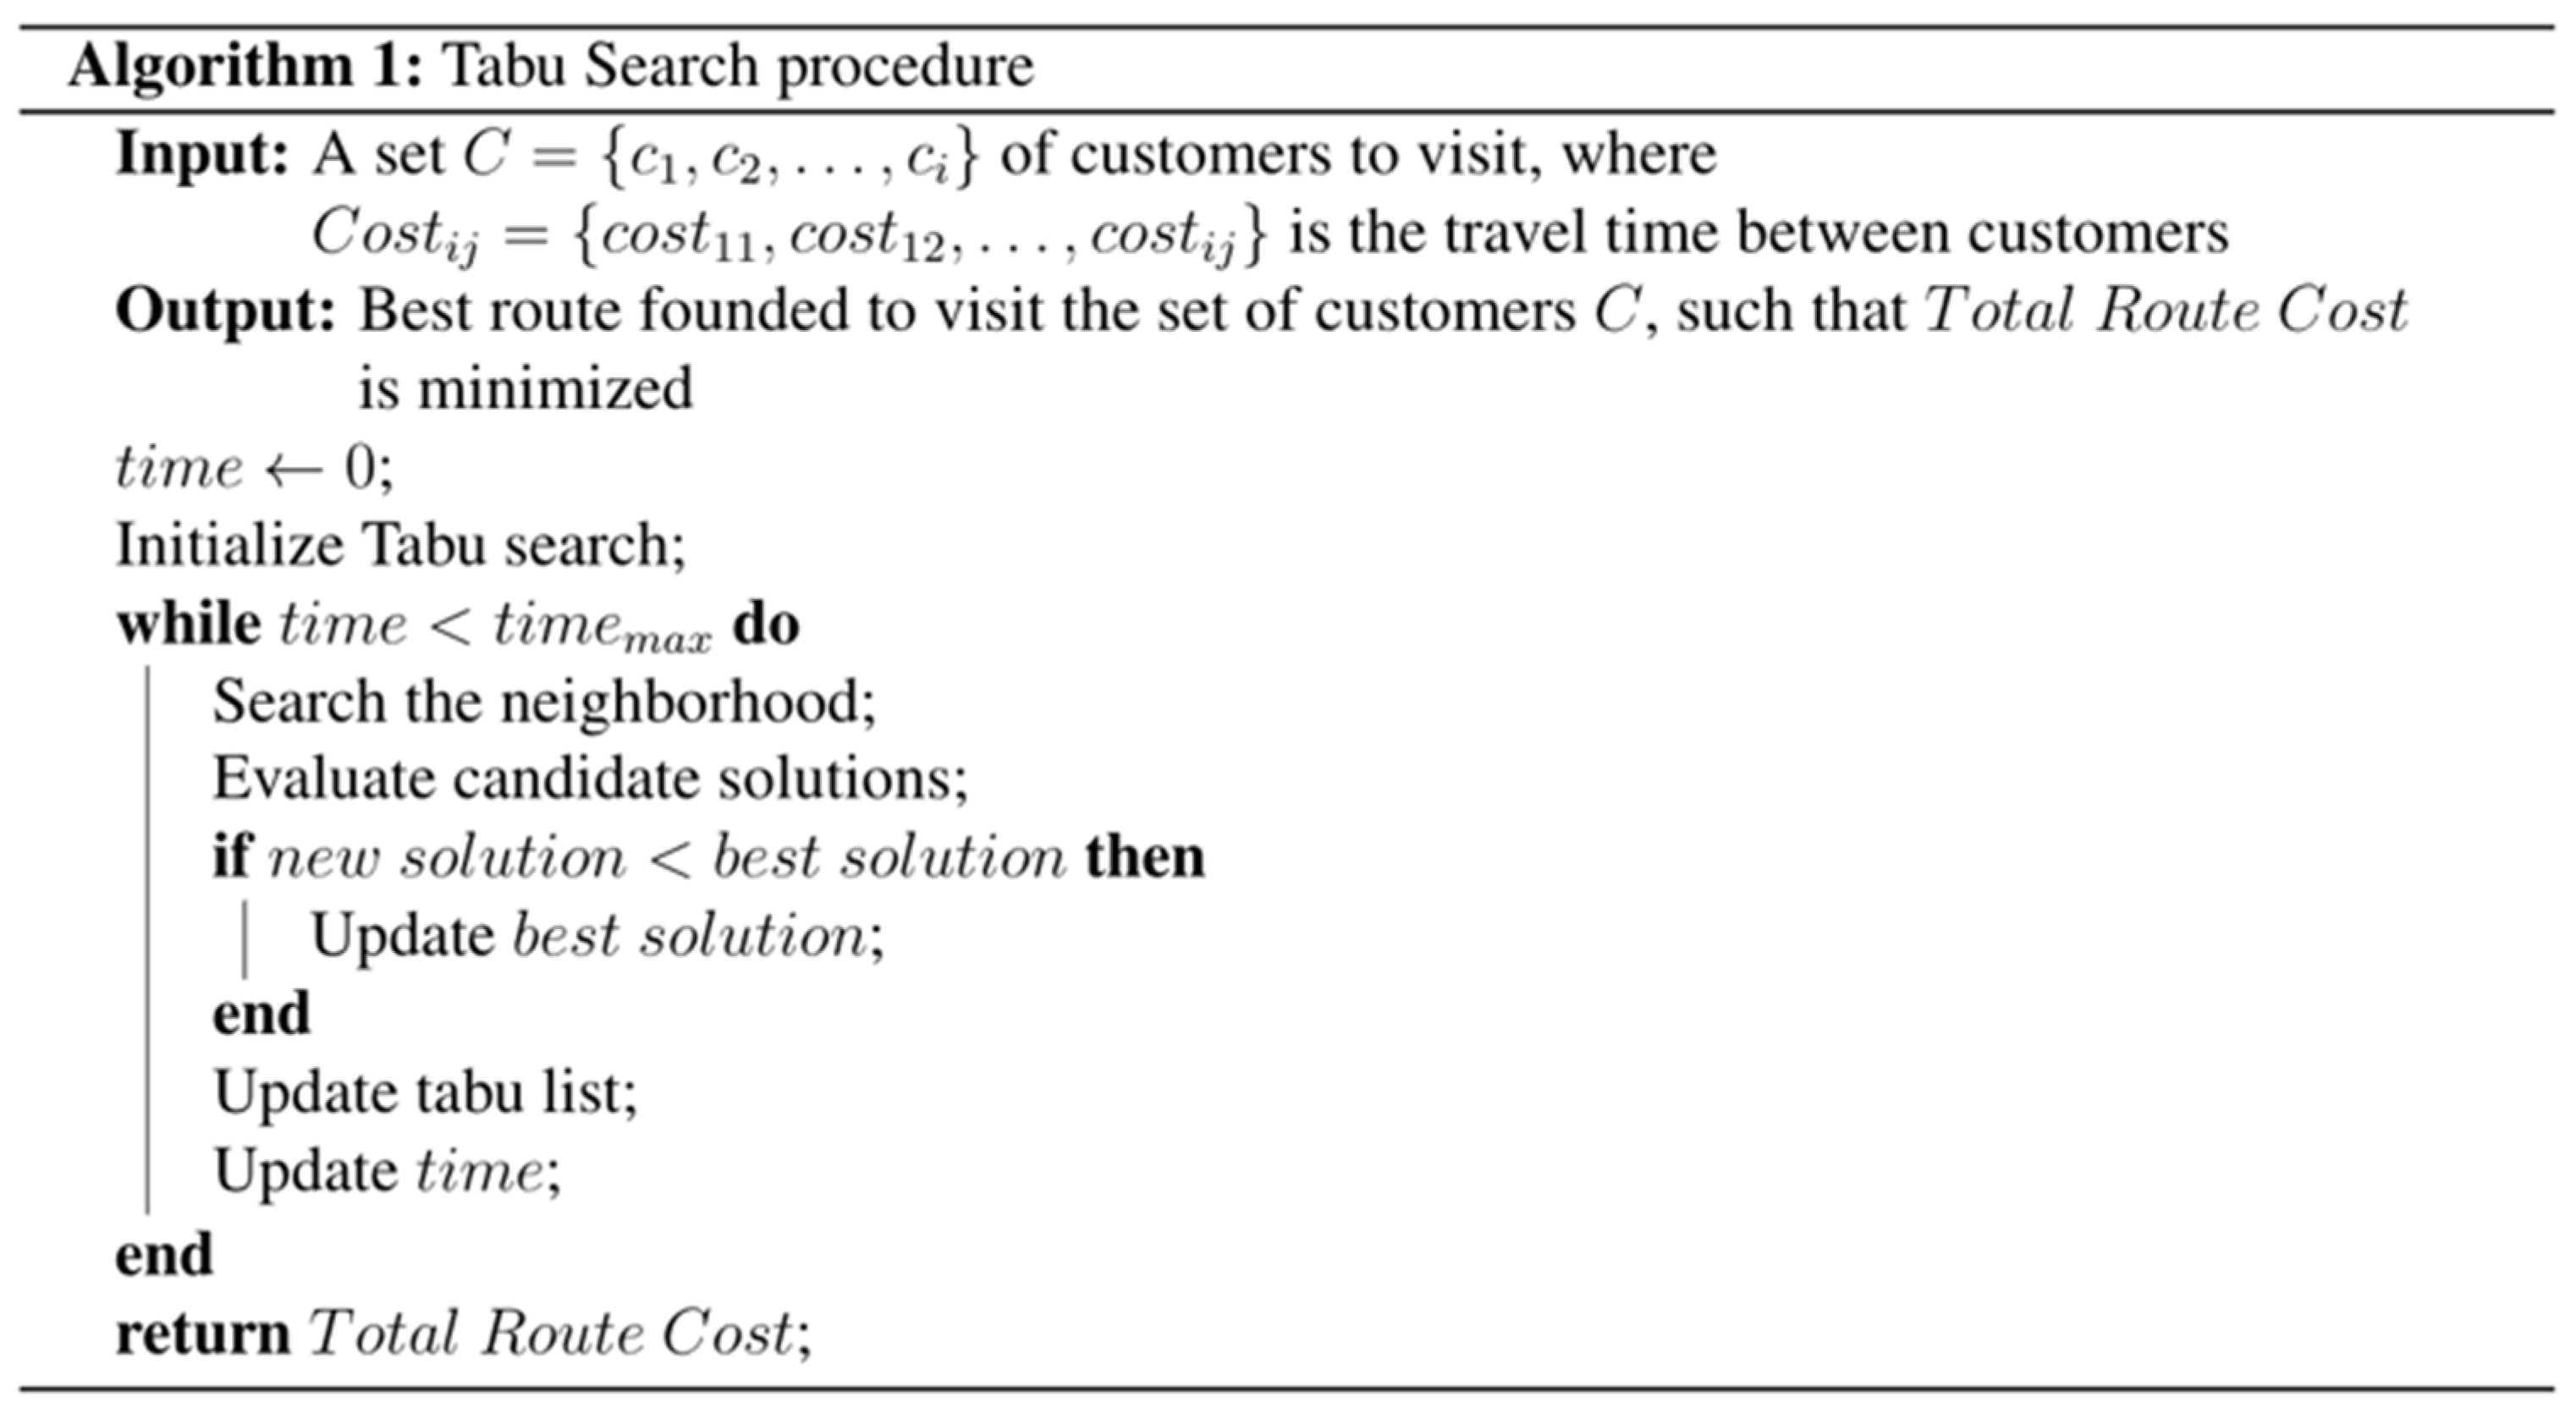
Thirdly, we optimise the routing operation to visit n different combinations of the random customers generated in the first step (see
Figure 2). This optimisation is done by solving the traditional vehicle routing problem (VRP) through Google OR-Tools and using the tabu search heuristic [
32]. On the one hand, Google OR-Tools is an open-source optimisation library, tuned for solving the VRP and its several variants, as well as other traditional problems in operations research [
33]. On the other hand, tabu-search-based heuristics is a very competitive procedure that has traditionally provided very practical results [
34]. Although we used Google OR-Tools due to its high performance [
35], there are other well-known and open-source libraries such as VRPy or VRPH that could be adapted to our approach. Other valuable approaches to solving VRPs are those based on simheuristics procedures [
36], which also allow the resolution of routing problems quickly.
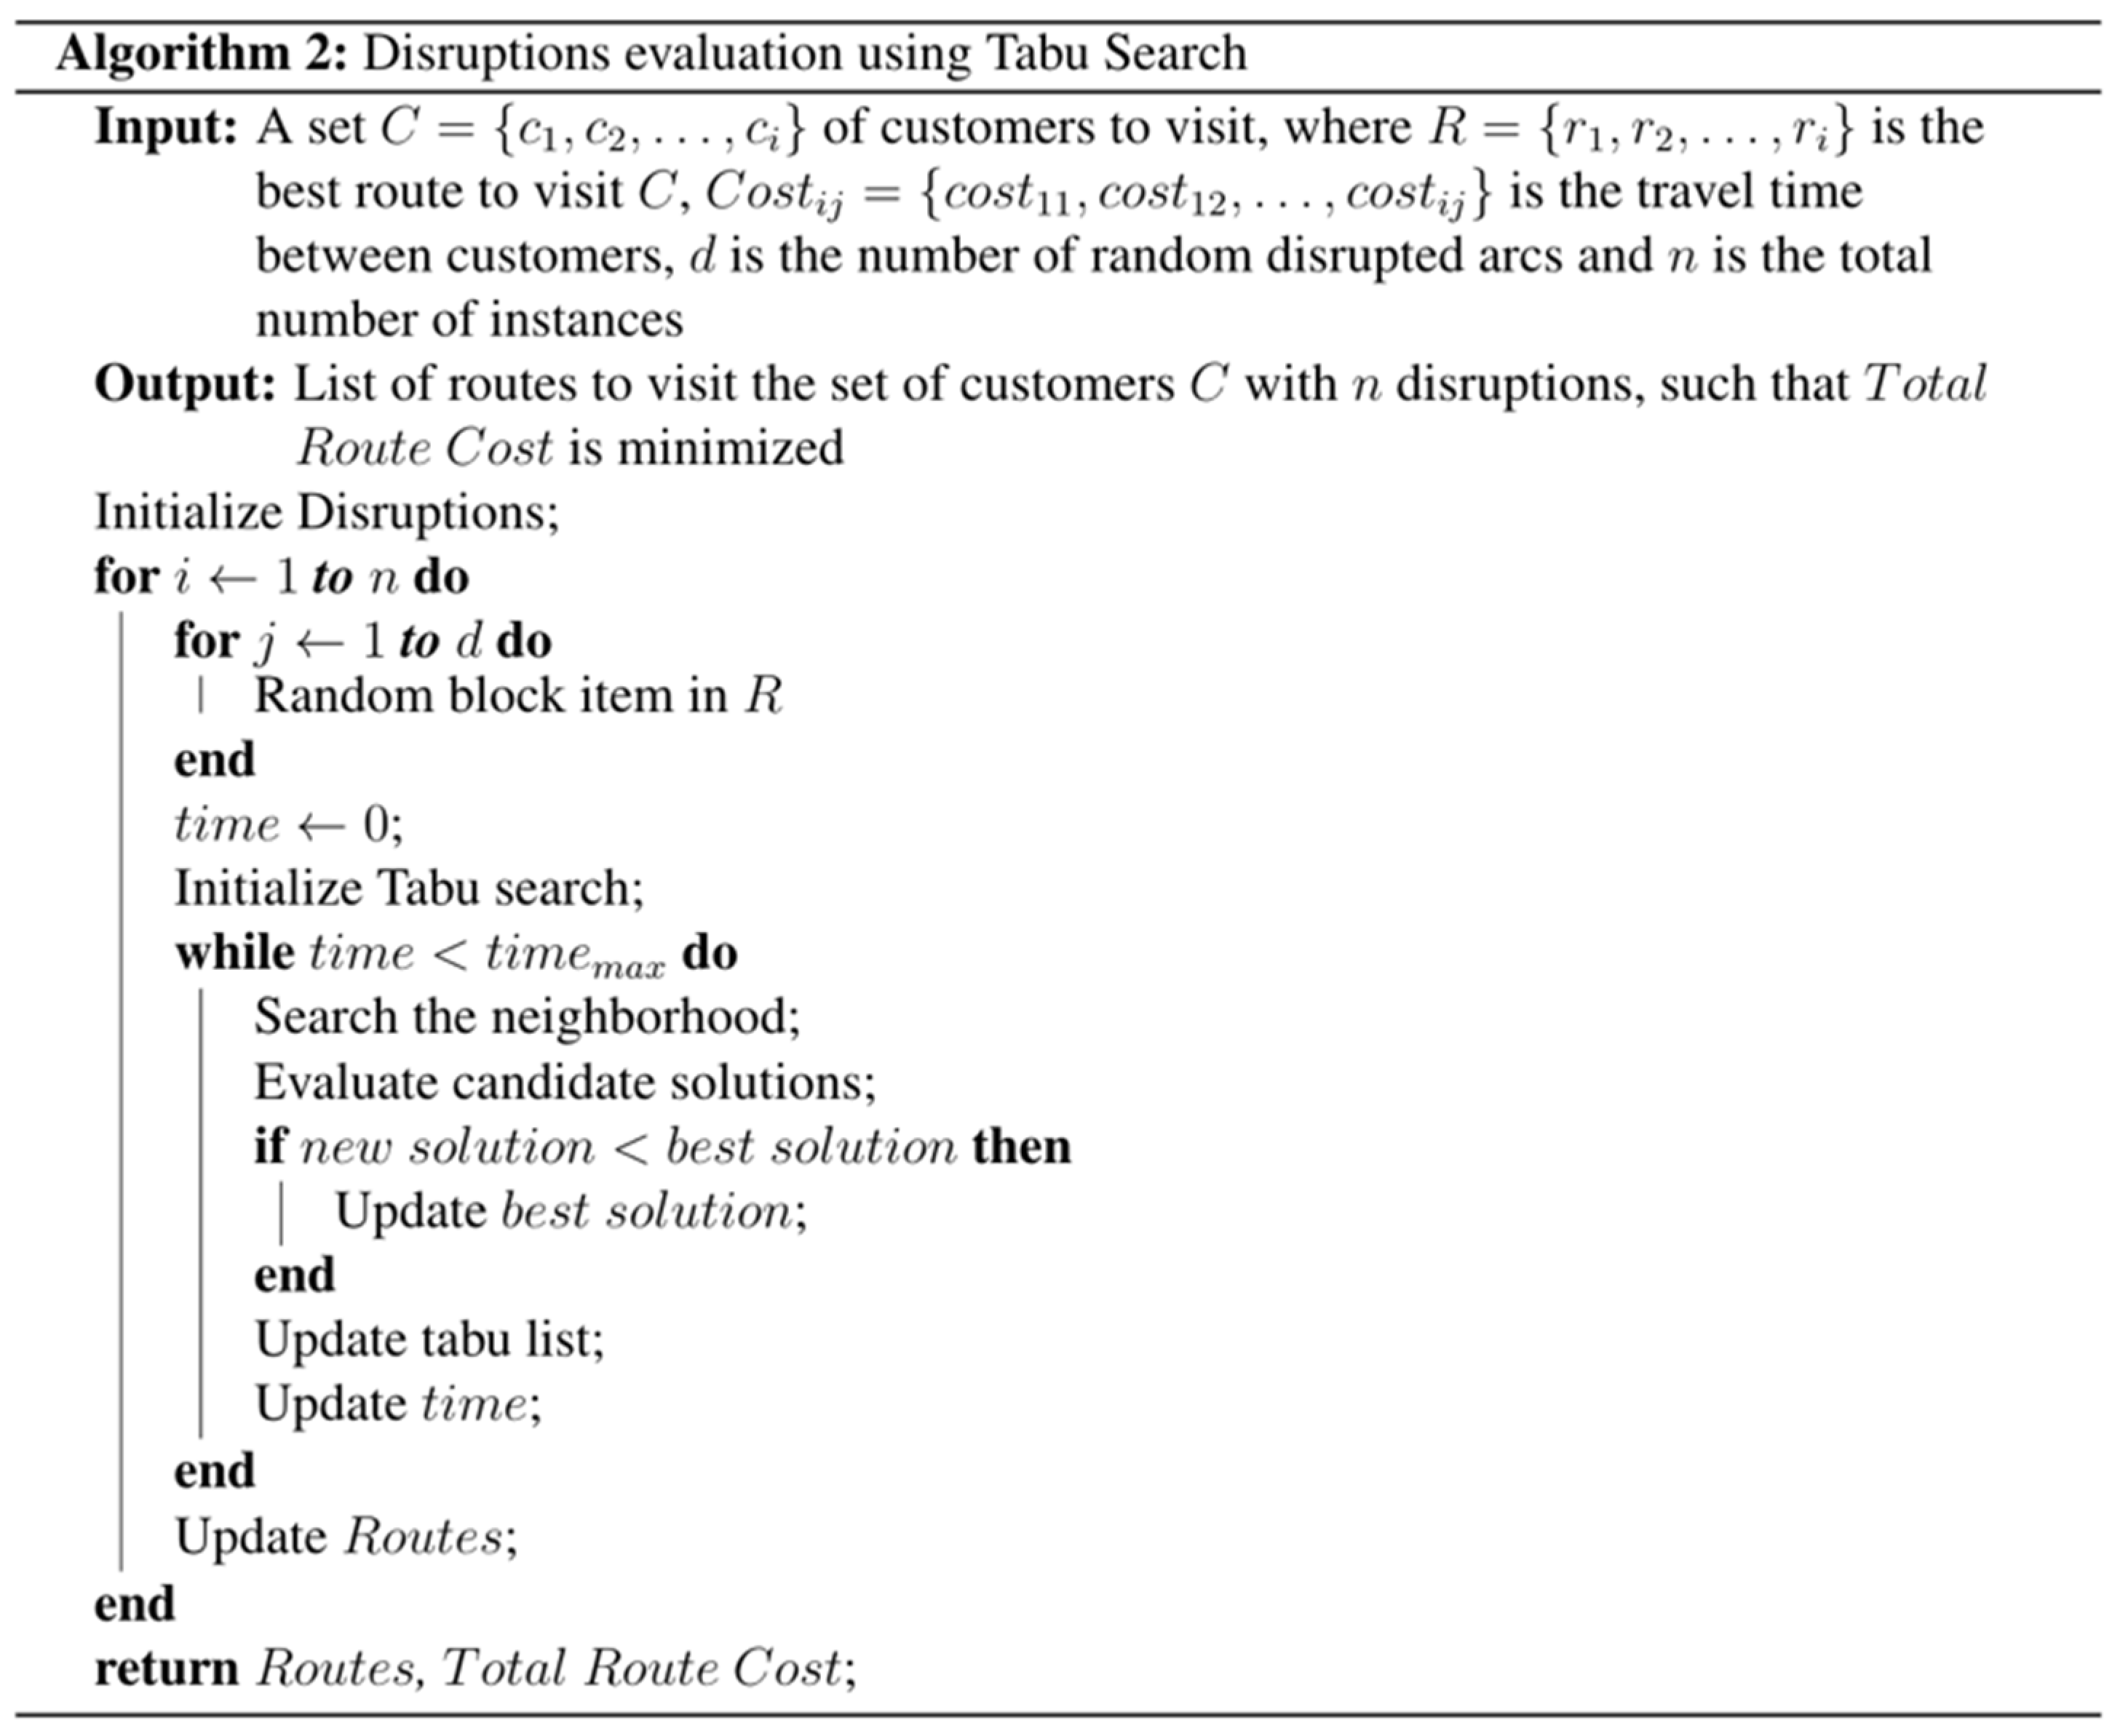
In the fourth step, we generate 1-to-
d disruptions into the optimal routes founded during the third step (see
Figure 3). Disruptions in last-mile delivery can be caused by different internal factors (e.g., mechanical failures) and external factors (e.g., car accidents or road works) [
37]. In our approach, we consider only external factors and assume that those accidents (or road works) imply the closure or slow access to certain roads. Therefore, disruptions mathematically mean the removal of up to d arcs in the optimal routing solution and entail a nonoptimal route with overtime associated. Finally, we compute and compare these overtimes to define the impact of d disruptions in the last-mile delivery operation.
4. Computational Experiments and Results
Delivering goods inside cities is a complex and dynamic operation that, according to each context, has unique issues to deal with [
38]. For example, unstable local freight policies, lack of infrastructure, unplanned settlements (e.g., slums) with difficult access, etc., are some of the peculiar aspects that are addressed by larger cities in develo** economies [
30]. Moreover, although European and US cities share similar living standards and levels of wealth, their characteristics are quite different. For example, there are less dense but larger cities in the US [
39], while Europe has medieval-structured cities, and their citizens have a higher proportion of using green modes of urban mobility [
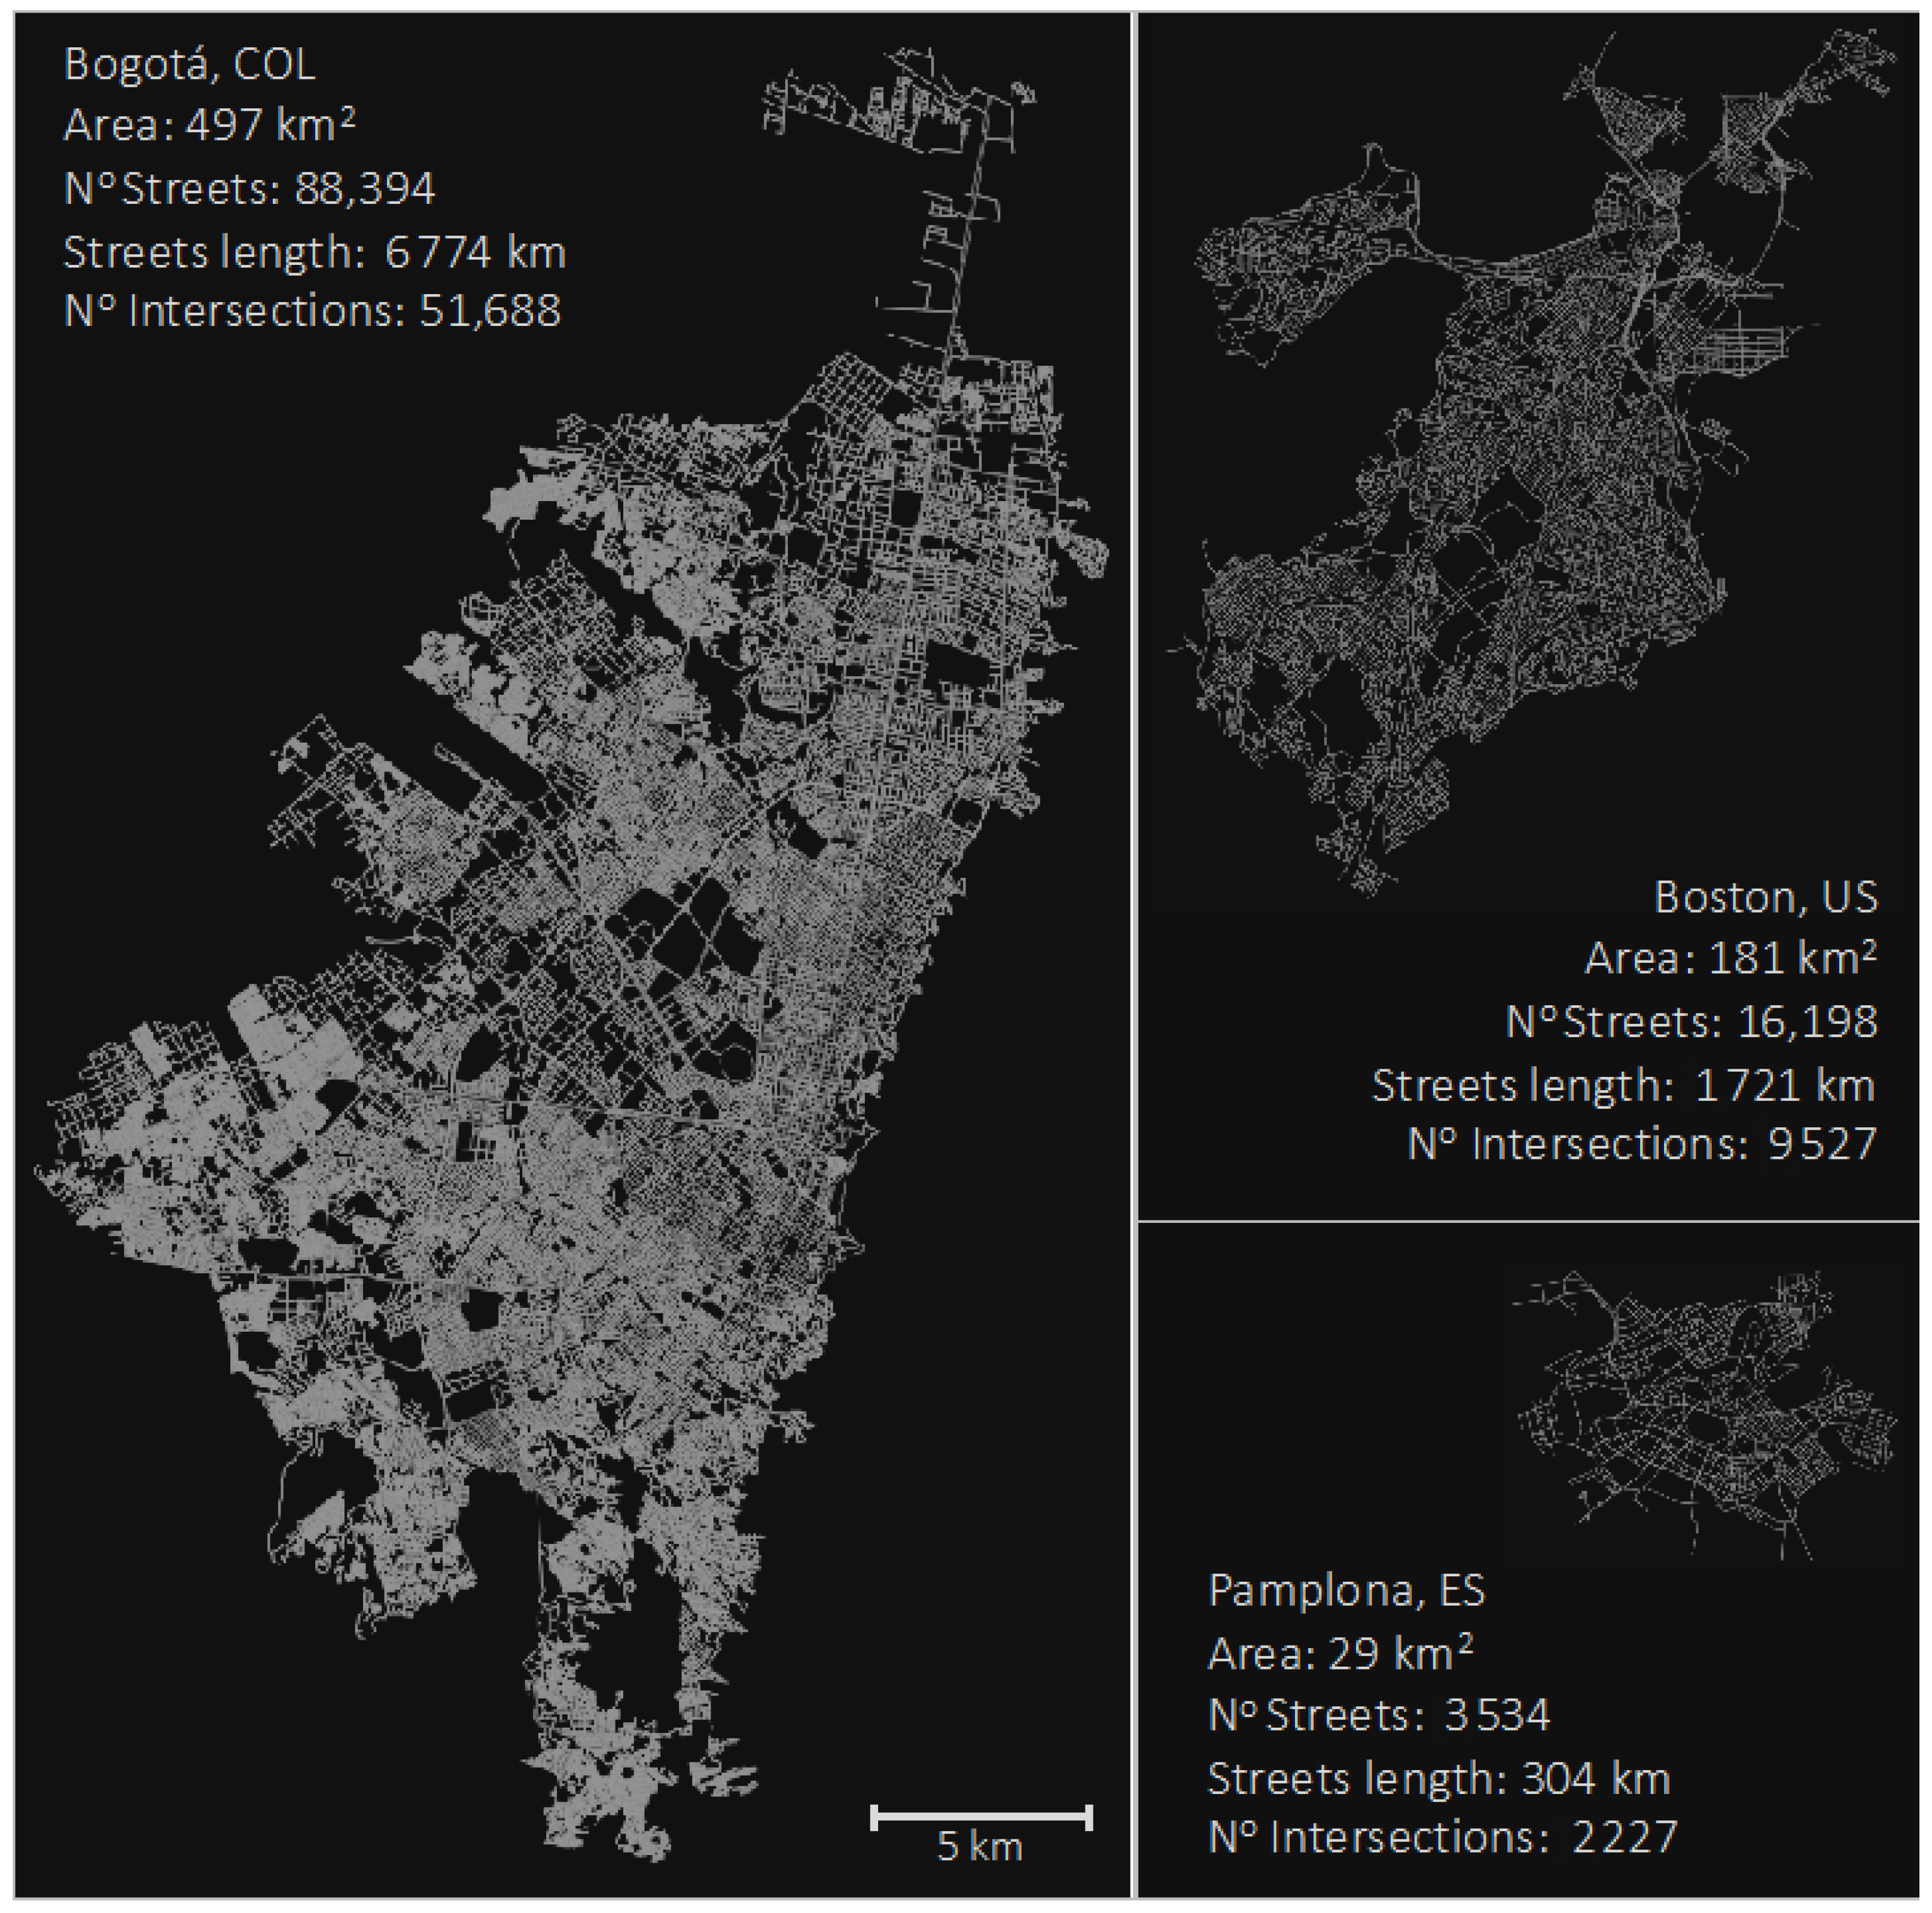
38]. In order to evaluate and compare the impact of disruptions in different cities’ context, a multicase study was carried out using three different cities around the world: Boston (US), Bogotá (Colombia), and Pamplona (Spain).
Boston (US), founded in 1630, has an area of about 127 km
2. Although Boston has an estimated resident population of 700,000, the Greater Boston population is more than 8 million inhabitants [
40]. Bogotá, founded in 1538, is the capital of Colombia and is the largest city. Its population is around 7.5 million inhabitants (DANE, 2020) and has an area of about 497 km2. Finally, Pamplona (Spain), the capital of the Autonomous Community of Navarre and founded in 75 BC, has an estimated resident population of 210.000 and an area of about 25 km2 [
41]. We implement the proposed approach in each of these three cities, which contrasts in size, culture, and infrastructure characteristics, in order to measure and compare the impact of disruptions in the last-mile delivery operation (see
Figure 4).
The approach was run using the Python interface version 3.7.4 and a time limit of 5 min per instance on an Intel(R) 8-Core (TM) i9 personal computer with 2.3 GHz and 16 GB RAM. First, we generated 50 different instances from 20 to 70 customers to visit per city. After implementing the tabu search procedure (
Figure 2), we generated 1-to-
d disruptions, where
d is the number of customers evaluated in each instance (
Figure 3). The objective is to analyse the relationship between the number of customers, disruptions, and both the total travelled time and distance.
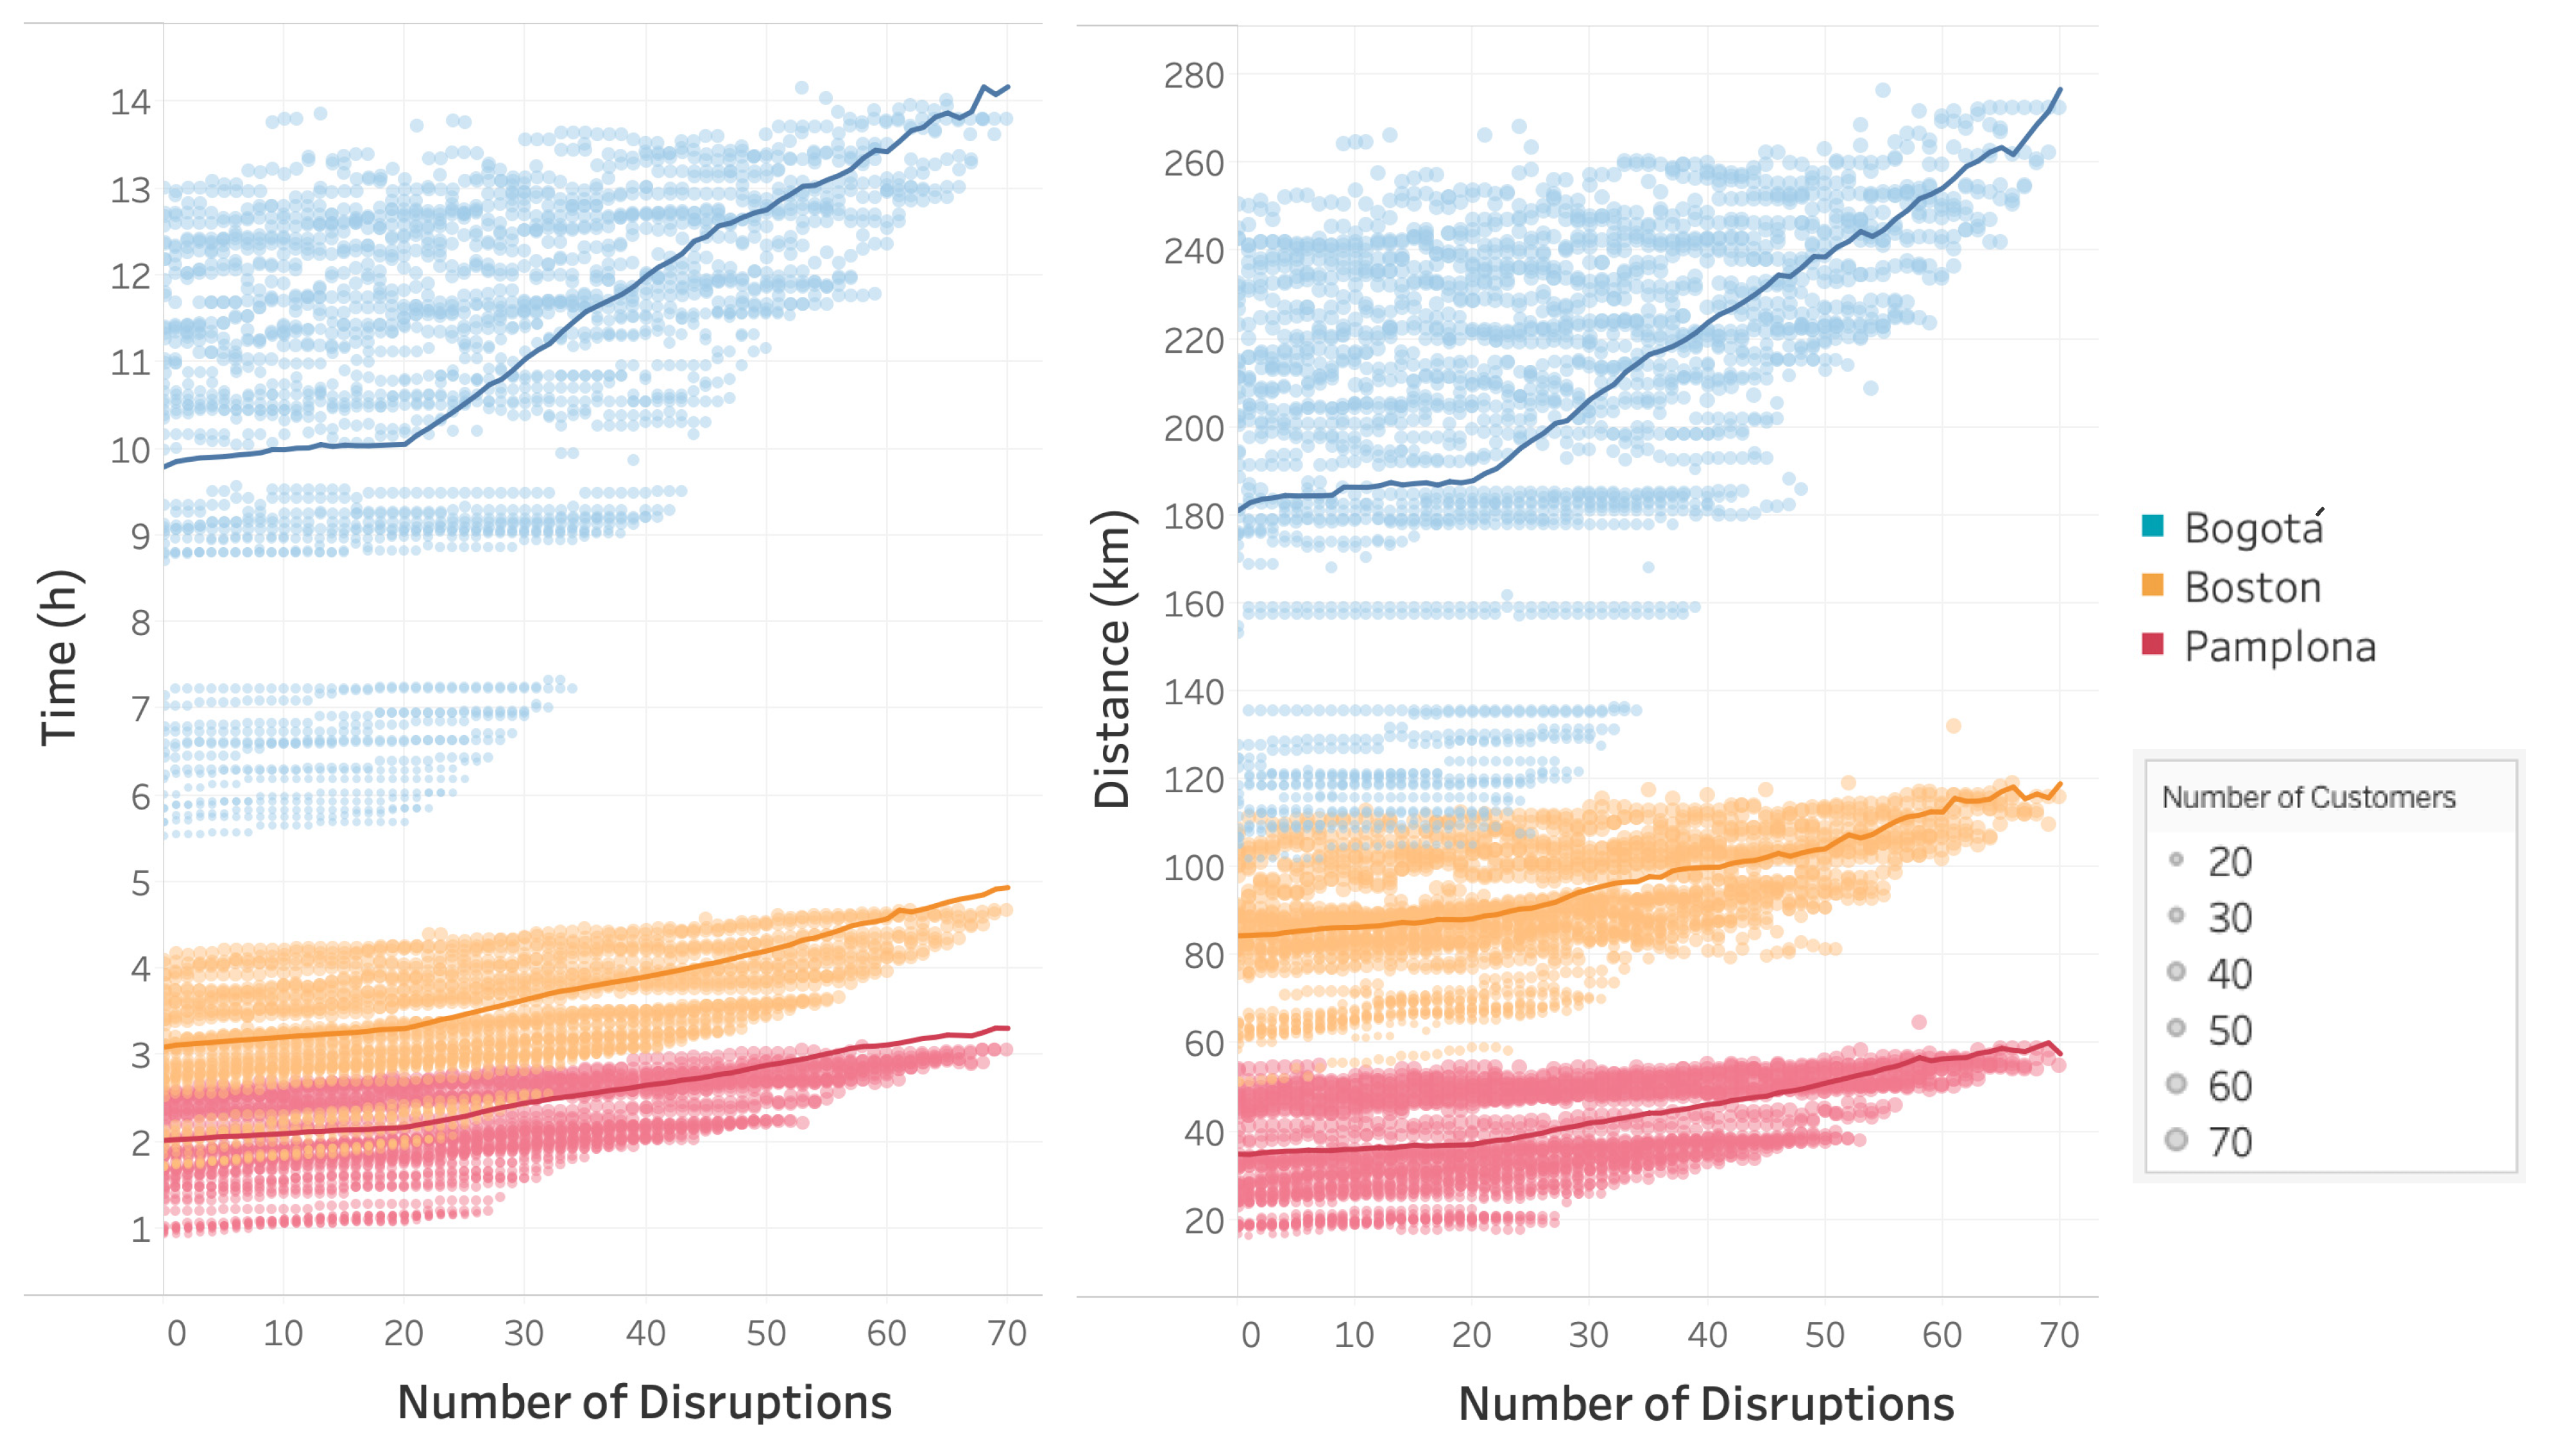
Table 1 and
Figure 5 show the obtained results in terms of travelled distance and time. In the average results, Bogotá has the highest travelled time (10.5 h) and distance (199.5 km), followed by Boston and Pamplona. However, regarding the impact of disruptions, each arc removed increases the average travelled time by 3.2%, 8.0%, and 9.7% in Bogotá, Boston, and Pamplona, respectively. That is, the impact of disruptions is smaller in larger cities. We obtained similar results in terms of distance, as each arc removed increases the average travelled distance by 4.0%, 5.1%, and 8.1% in Bogotá, Boston, and Pamplona, respectively. There is no linear proportion between time and distance, as in urban logistics the shortest path does not guarantee the shortest time.
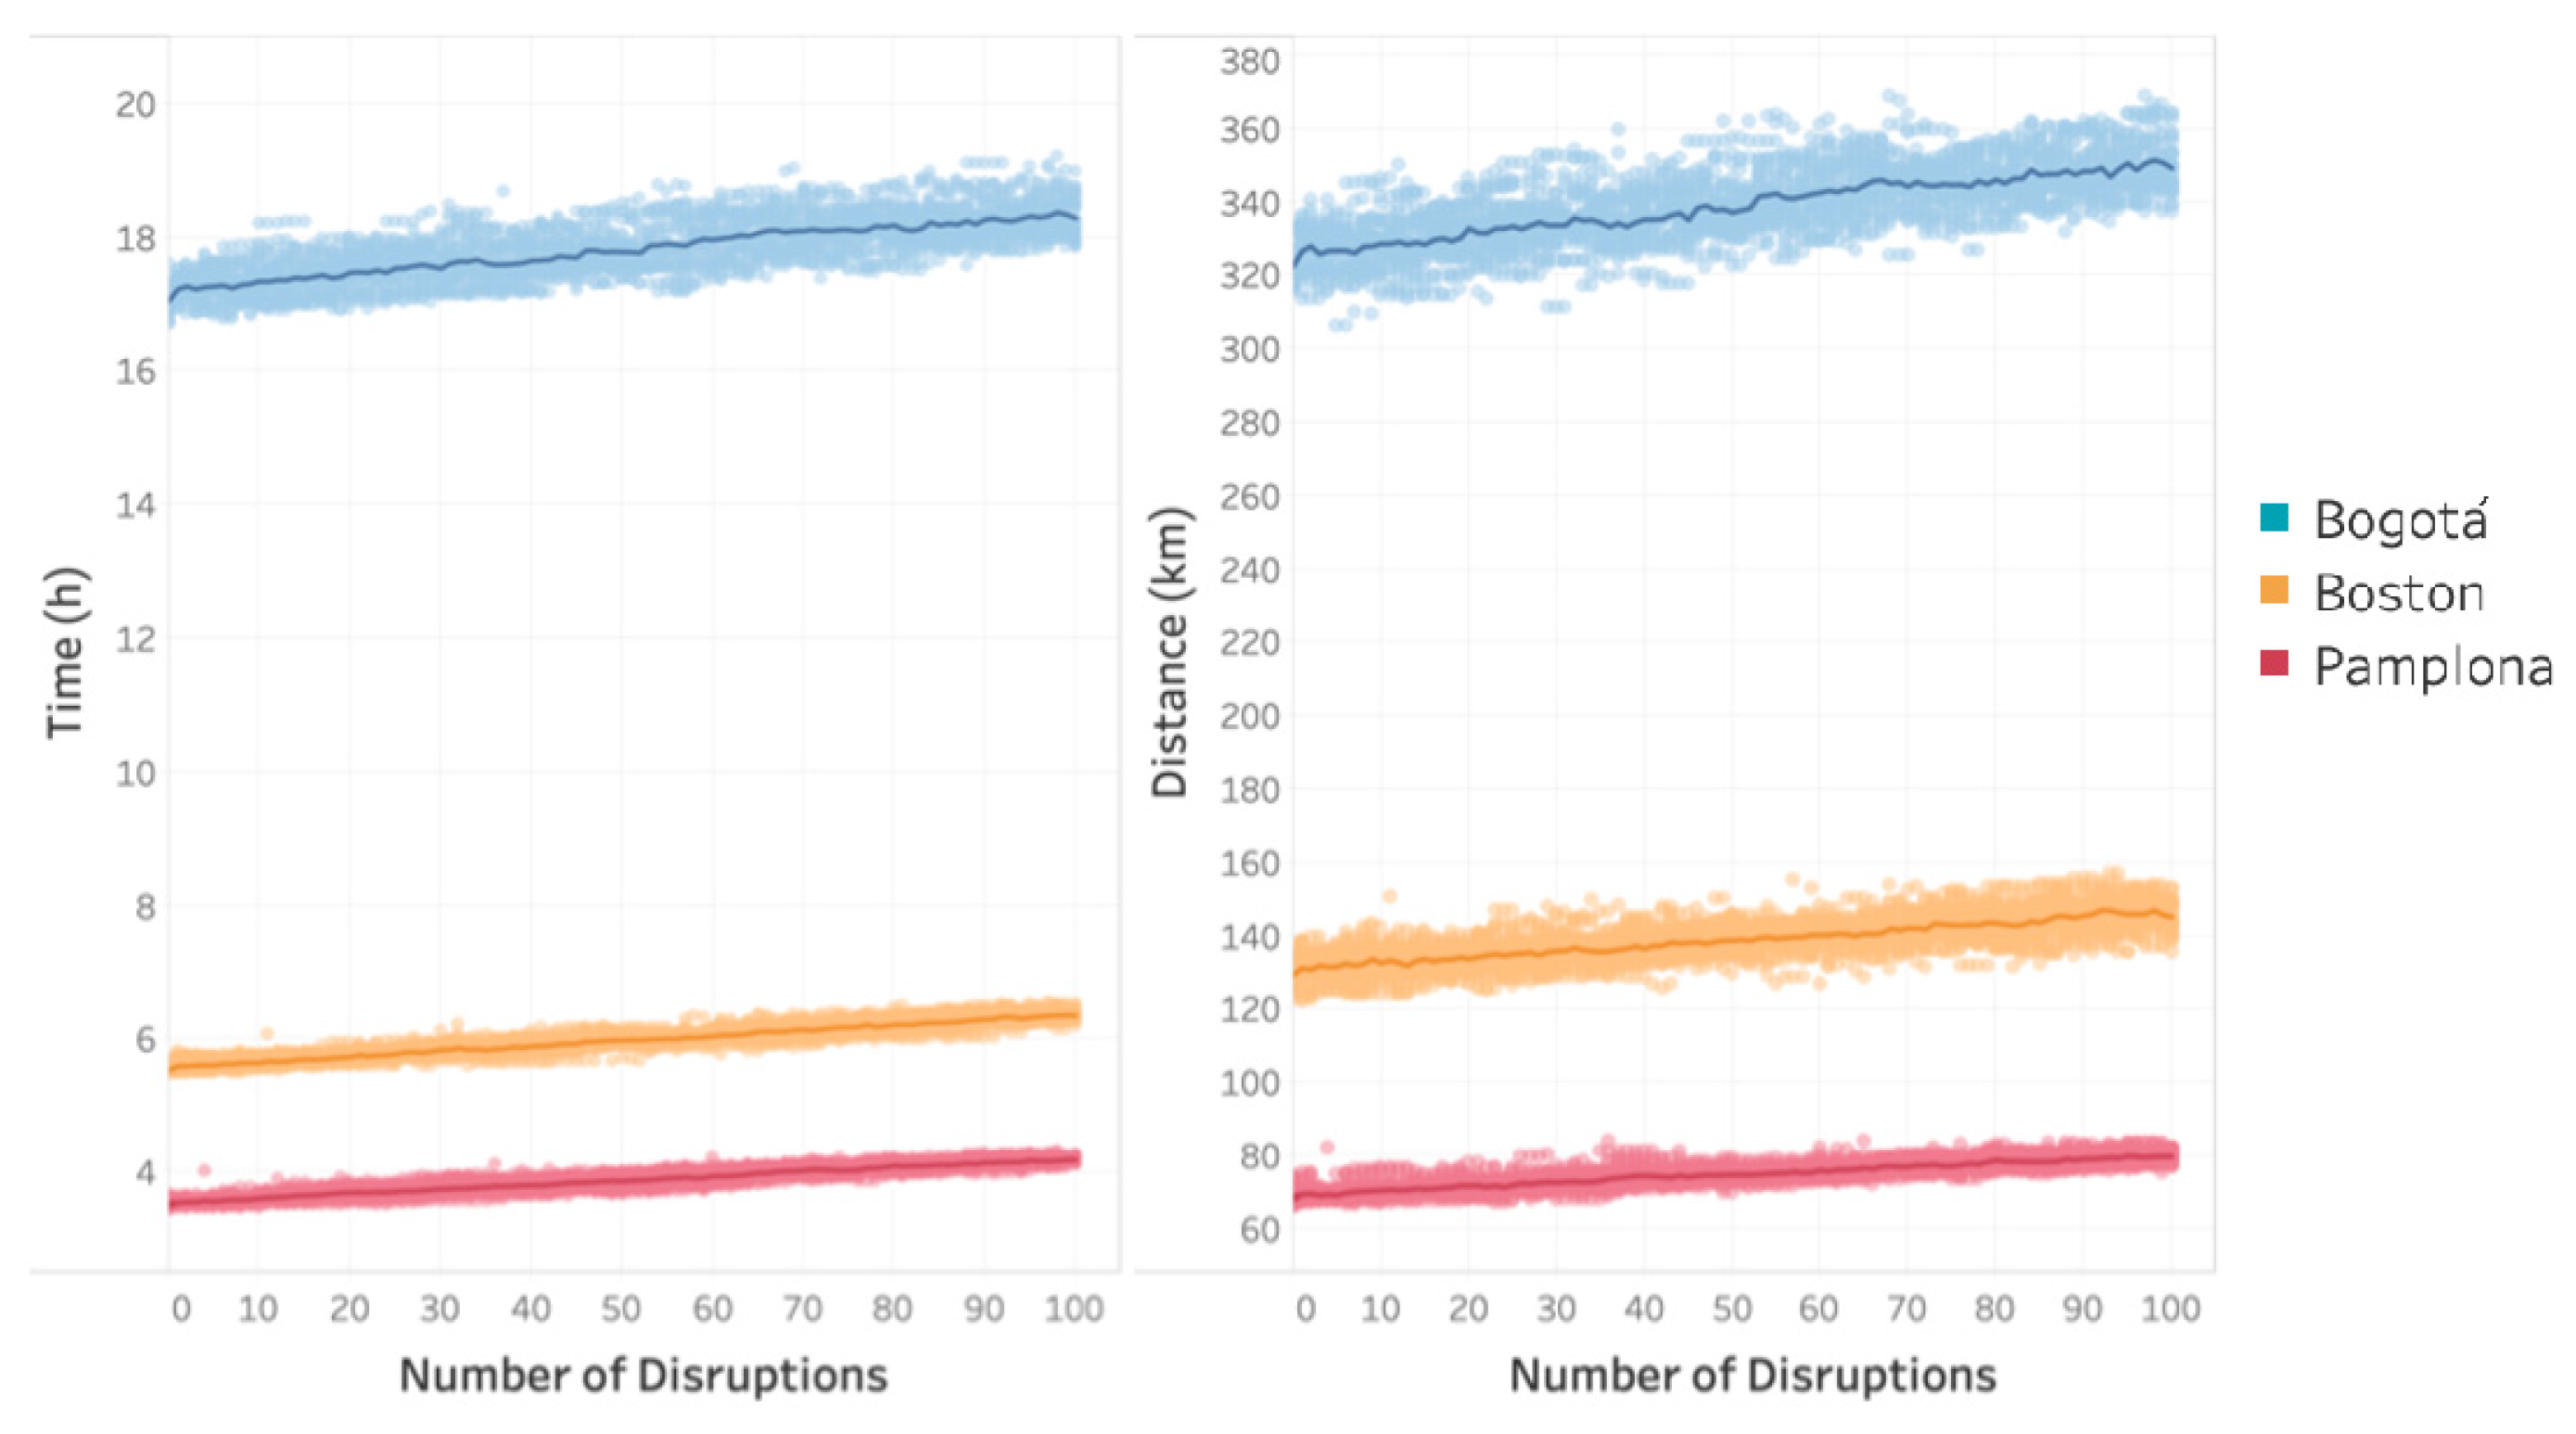
Secondly, we generated 50 different instances with 100 different customers to evaluate the impact of a larger number of disruptions in scenarios with the same name of potential customers to visit per city. The results obtained for this configuration are shown in
Table 2 and
Figure 6. It is evident, again, that size and congestion in a larger city such as Bogotá imply both the longest travel time and distance. On average, delivering to 100 customers is 3.5 and 1.4 times slower in Bogotá than in Boston and Pamplona, respectively. We can also see that variance is higher in Bogotá than in the other cities. Specifically, the standard deviation is 0.46 h and 10.45 km in Bogotá, 0.25 h and 6.1 km in Boston, and 0.21 h and 3.74 km in Pamplona. Finally, regarding the impact of disruptions, each arc removed (for 100-customer instances) increases on average the travelled time by 4%, 8%, and 10% in Bogotá, Boston, and Pamplona, respectively. These results are similar to those obtained in smaller instances (i.e., 20 to 70 customers) and endorse the conclusion that larger cities are more sensitive to the disruption of arcs.
Finally, the results allow us to conclude that the impact of disruptions in the transportation network depends on the city’s road network and the dispersion of customers’ location. This fact is related to the number of streets and alternative routes connecting customers and distribution centres. For example, a disruption in cities with a limited road network can cause the route to be completely redefined due to the absence of alternative routes. In terms of customer location, the distribution could be scattered depending on the city size. For example, customers can be dispersed in cities like Bogotá or Boston, while in Pamplona, the customers tend to be concentrated in certain zones. Thus, a disruption in small cities such as Pamplona can restrict access to a set of customers, while in large cities, a disruption may affect one or few customers due to the number of customers per km2. In these cases, the greater the number of disruptions, the longer the travel times and distances are.
5. Conclusions
This paper proposed a model based on Google API and Google OR-Tools to measure the impact of disruptions in the last-mile delivery operation. Our model considers customers’ geographic information, speed estimation between nodes, routing optimisation, and disruption evaluation. The proposed method was validated on a set of real data from three different cities, i.e., Boston, US; Bogotá, Colombia; and Pamplona, Spain. For the computational experiments, we generated random locations of customers for each city, and the evaluated disruptions considered the total travelled time and distance. The results allow us to conclude that the impact of disruptions in the transportation network depends on the city size, the city’s road network, and the dispersion of customers’ location. In this paper, the larger the city is, the most sensitive the disruption of arcs is, having an increase in the travelled distance up to 4% instead of 8% obtained by the smaller city. Additionally, the results provided managerial insights for key stakeholders to improve the resilience and capabilities of the cities’ transportation systems.
In terms of future research, there are opportunities to include a city’s population density or real delivery information of a parcel company to represent more real-like scenarios. Moreover, the impact of disruptions in peak times in terms of costs and CO2 emissions, considering different levels of disruptions, can also be studied. Furthermore, another direction for future research is to design robust routes for having a minimal impact on deliveries when disruptions occur. Finally, other solution methods and cities could be tested.

 ,
, 


