
Methods to Increase Fatigue Life at Rib to Deck Connection in Orthotropic Steel Bridge Decks

Abstract
:1. Introduction
1.1. General Introduction
1.2. Researches on Fatigue at Rib to Deck Connections in OSD

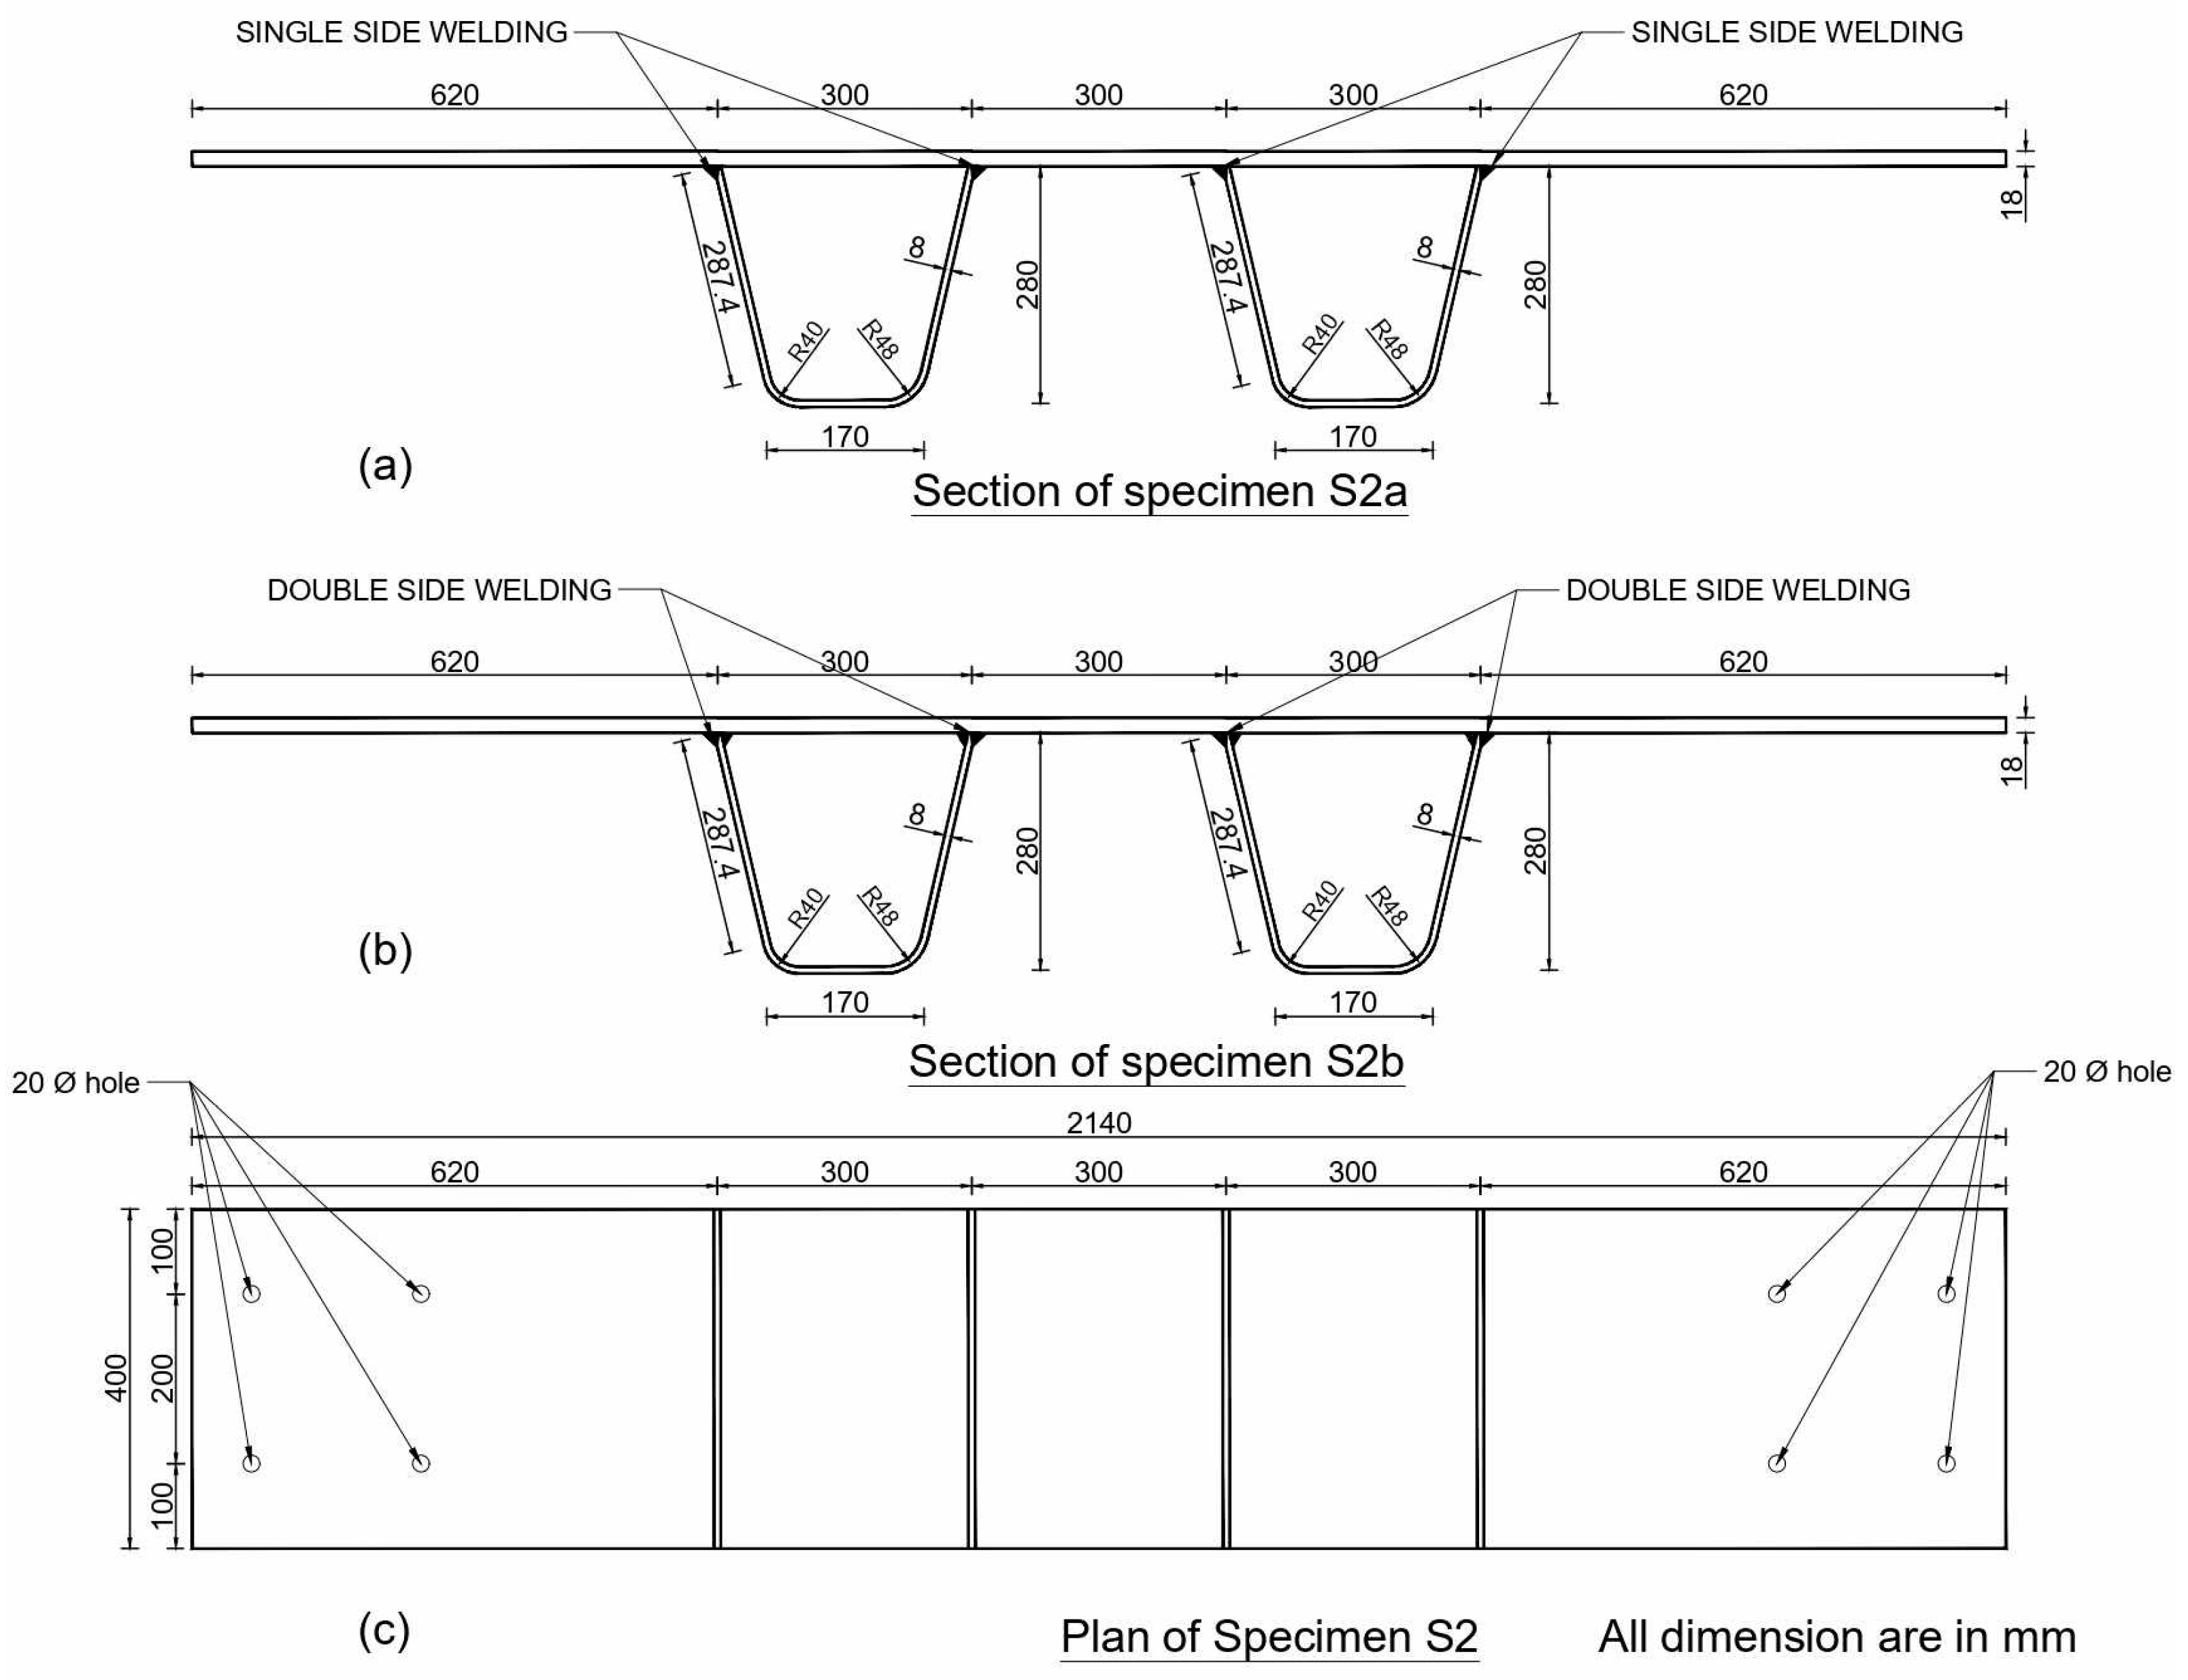
| Thickness of | Welded Side | σhs | Δσ (%) | Δσr (%) | |
|---|---|---|---|---|---|
| Deck (mm) | Rib (mm) | ||||
| 18 | 8 | 2 | 46.30 | 7.80 | 30.50 |
| 18 | 8 | 1 | 49.91 | 29.74 | |
| 18 | 6 | 2 | 35.48 | 8.43 | |
| 18 | 6 | 1 | 38.47 | ||
| 16 | 8 | 2 | 59.41 | 13.21 | 34.47 |
| 16 | 8 | 1 | 67.26 | 29.65 | |
| 16 | 6 | 2 | 44.18 | 17.43 | |
| 16 | 6 | 1 | 51.88 | ||
| 14 | 8 | 2 | 76.15 | 13.28 | 36.59 |
| 14 | 8 | 1 | 86.26 | 34.15 | |
| 14 | 6 | 2 | 55.75 | 15.34 | |
| 14 | 6 | 1 | 64.30 | ||
| 12 | 8 | 2 | 121.28 | 9.51 | 24.02 |
| 12 | 8 | 1 | 132.81 | 22.95 | |
| 12 | 6 | 2 | 97.79 | 10.46 | |
| 12 | 6 | 1 | 108.02 | ||
- σhs is the hotspot stress at the weld.
- Δσ is the percentage higher stress value in the single weld with reference to double weld.
- Δσr is the percentage higher stress in 8 mm ribbed specimens with reference to 6 mm ribbed specimens, taking all other parameters as constant.
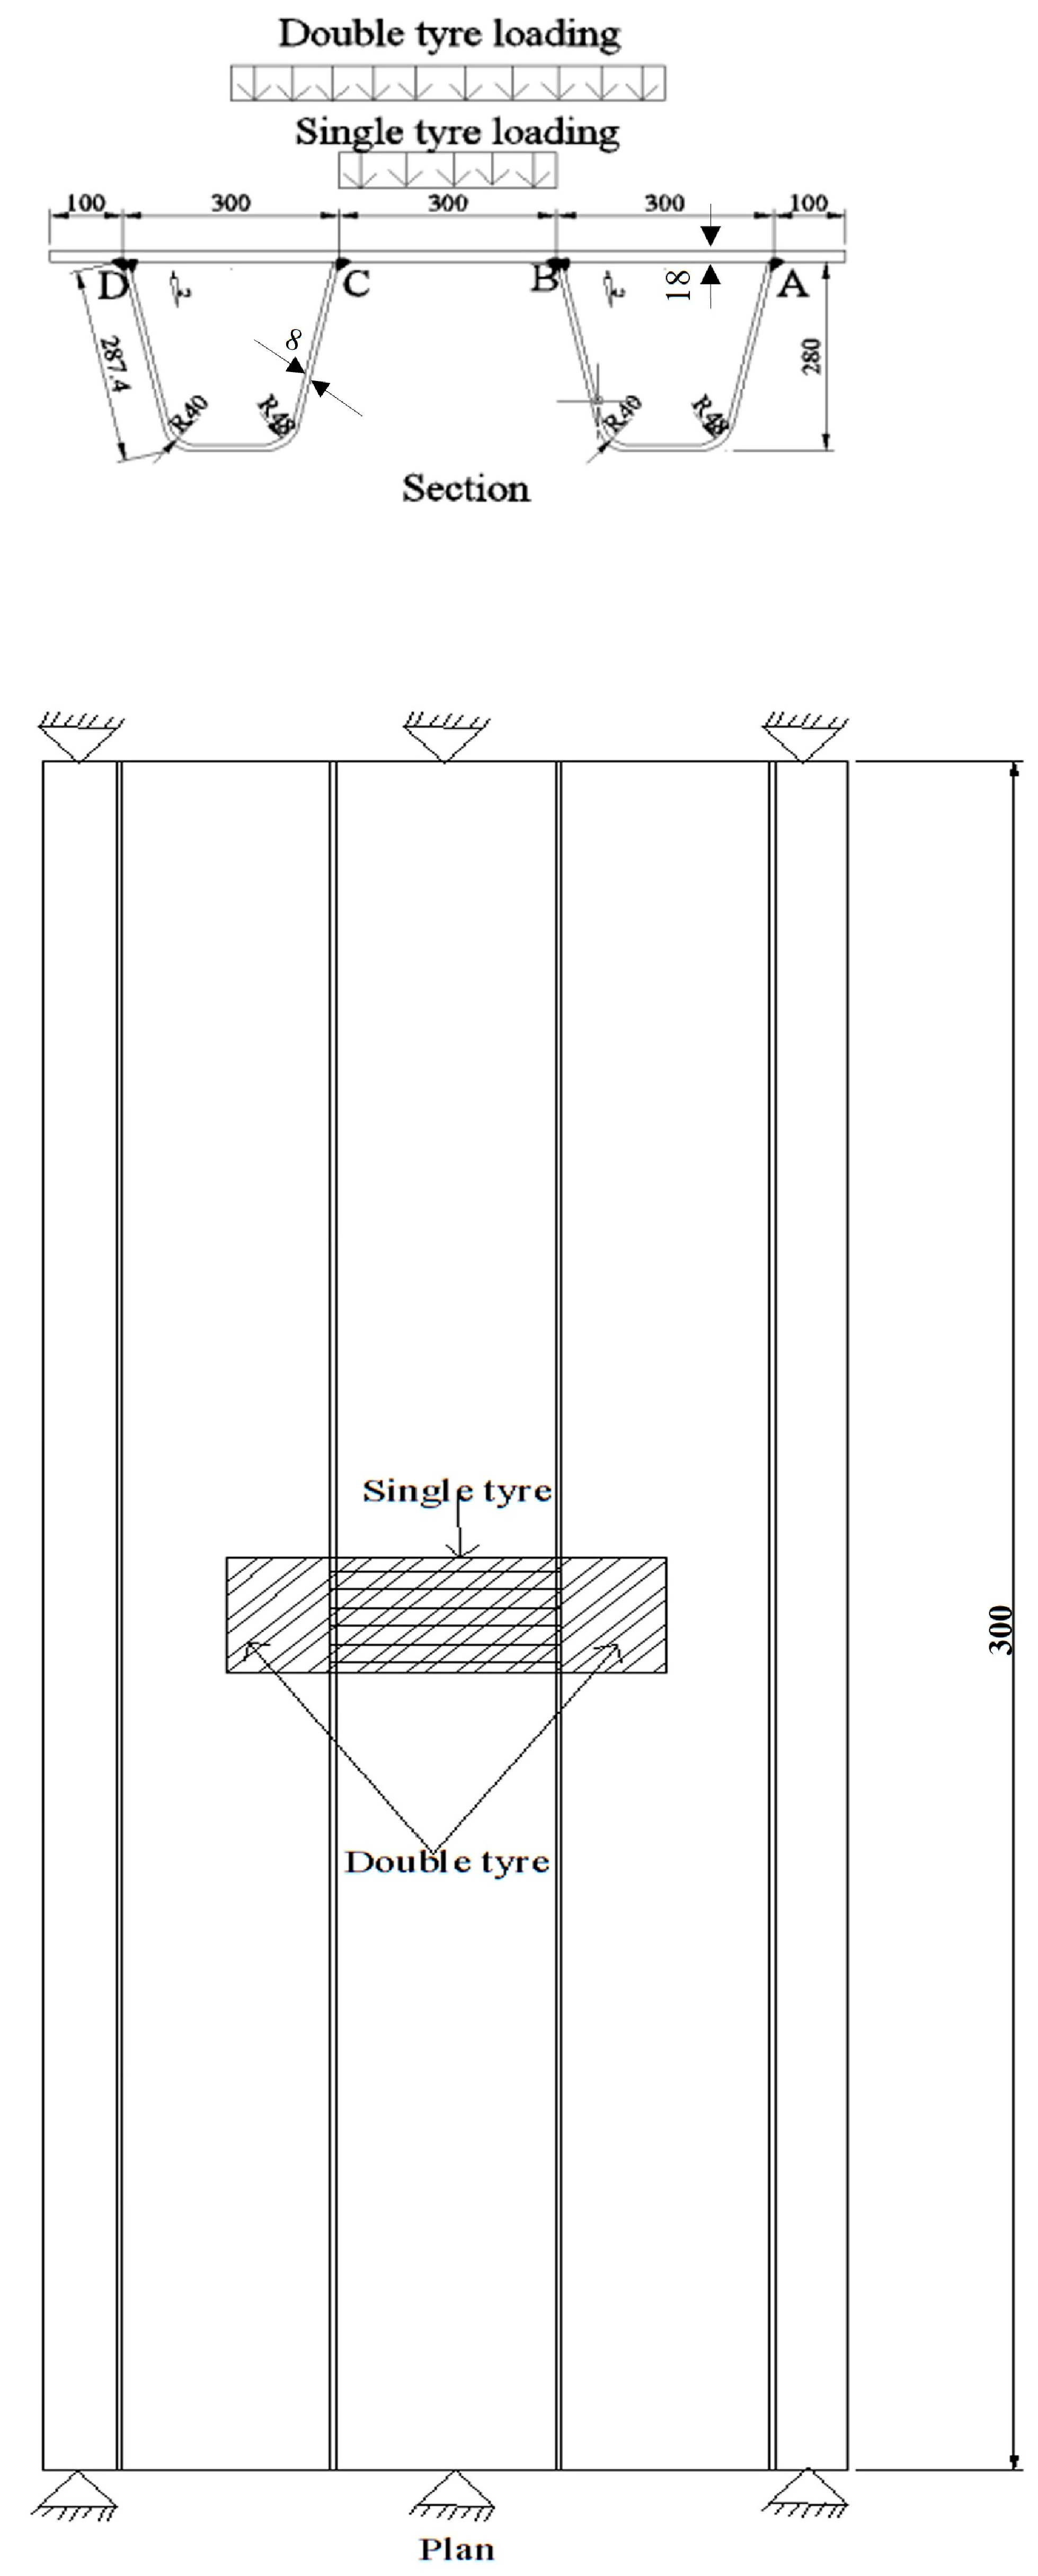
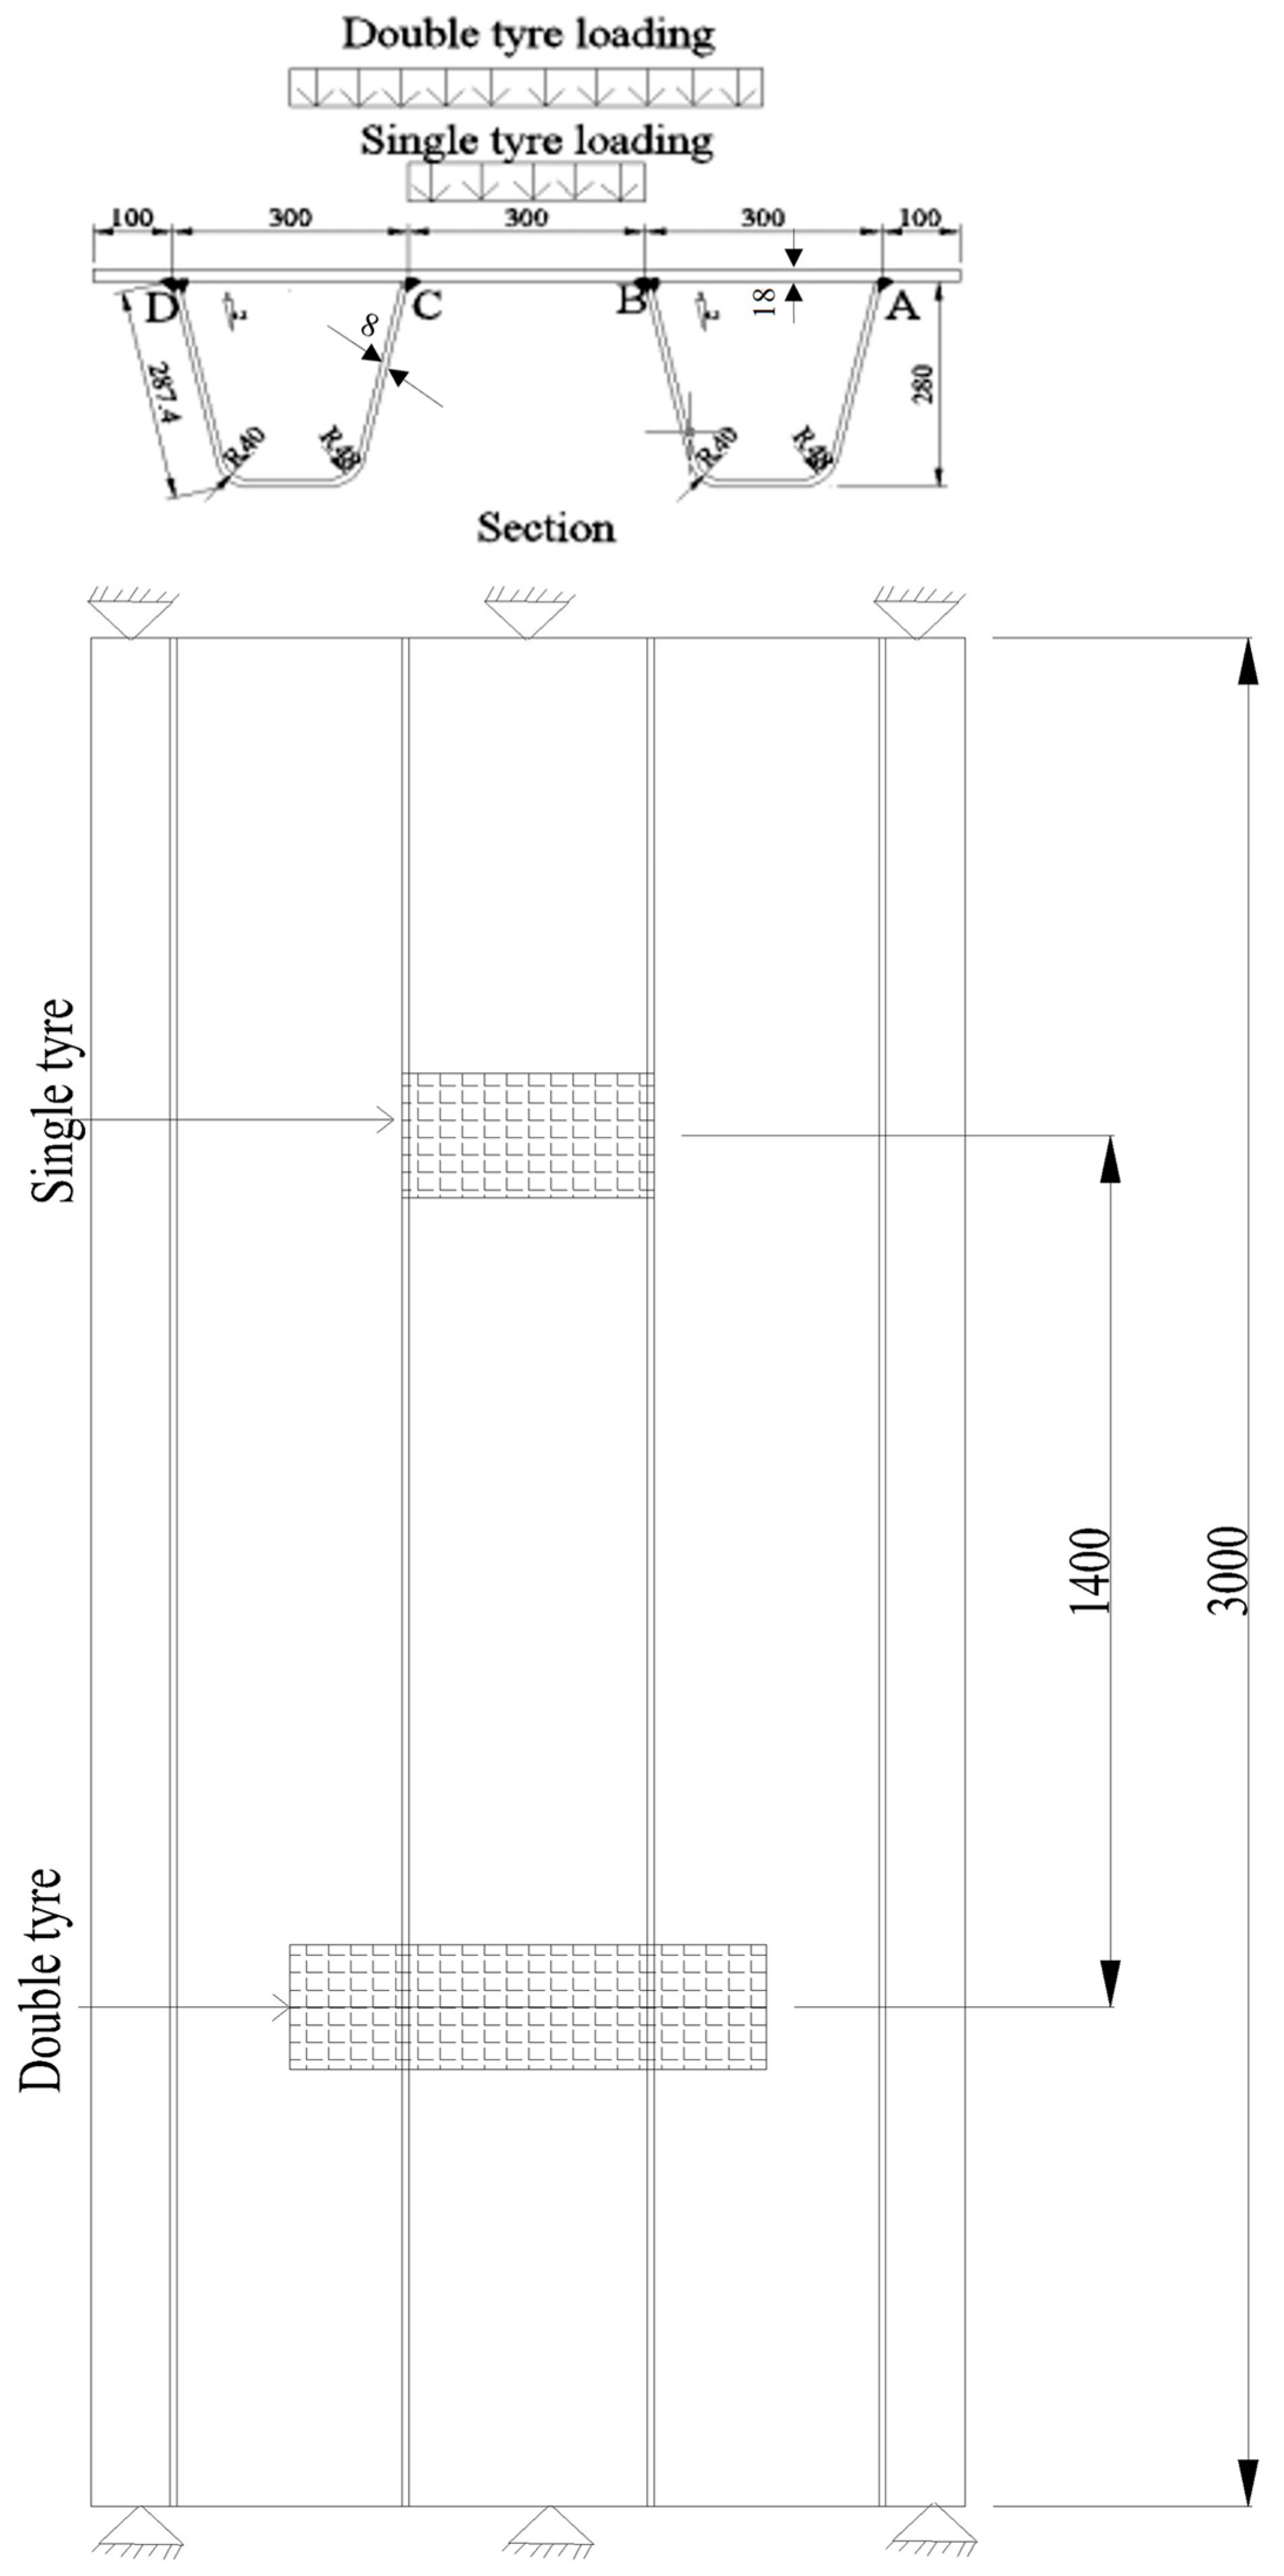
4. Simulations of Models Similar to Field Structures
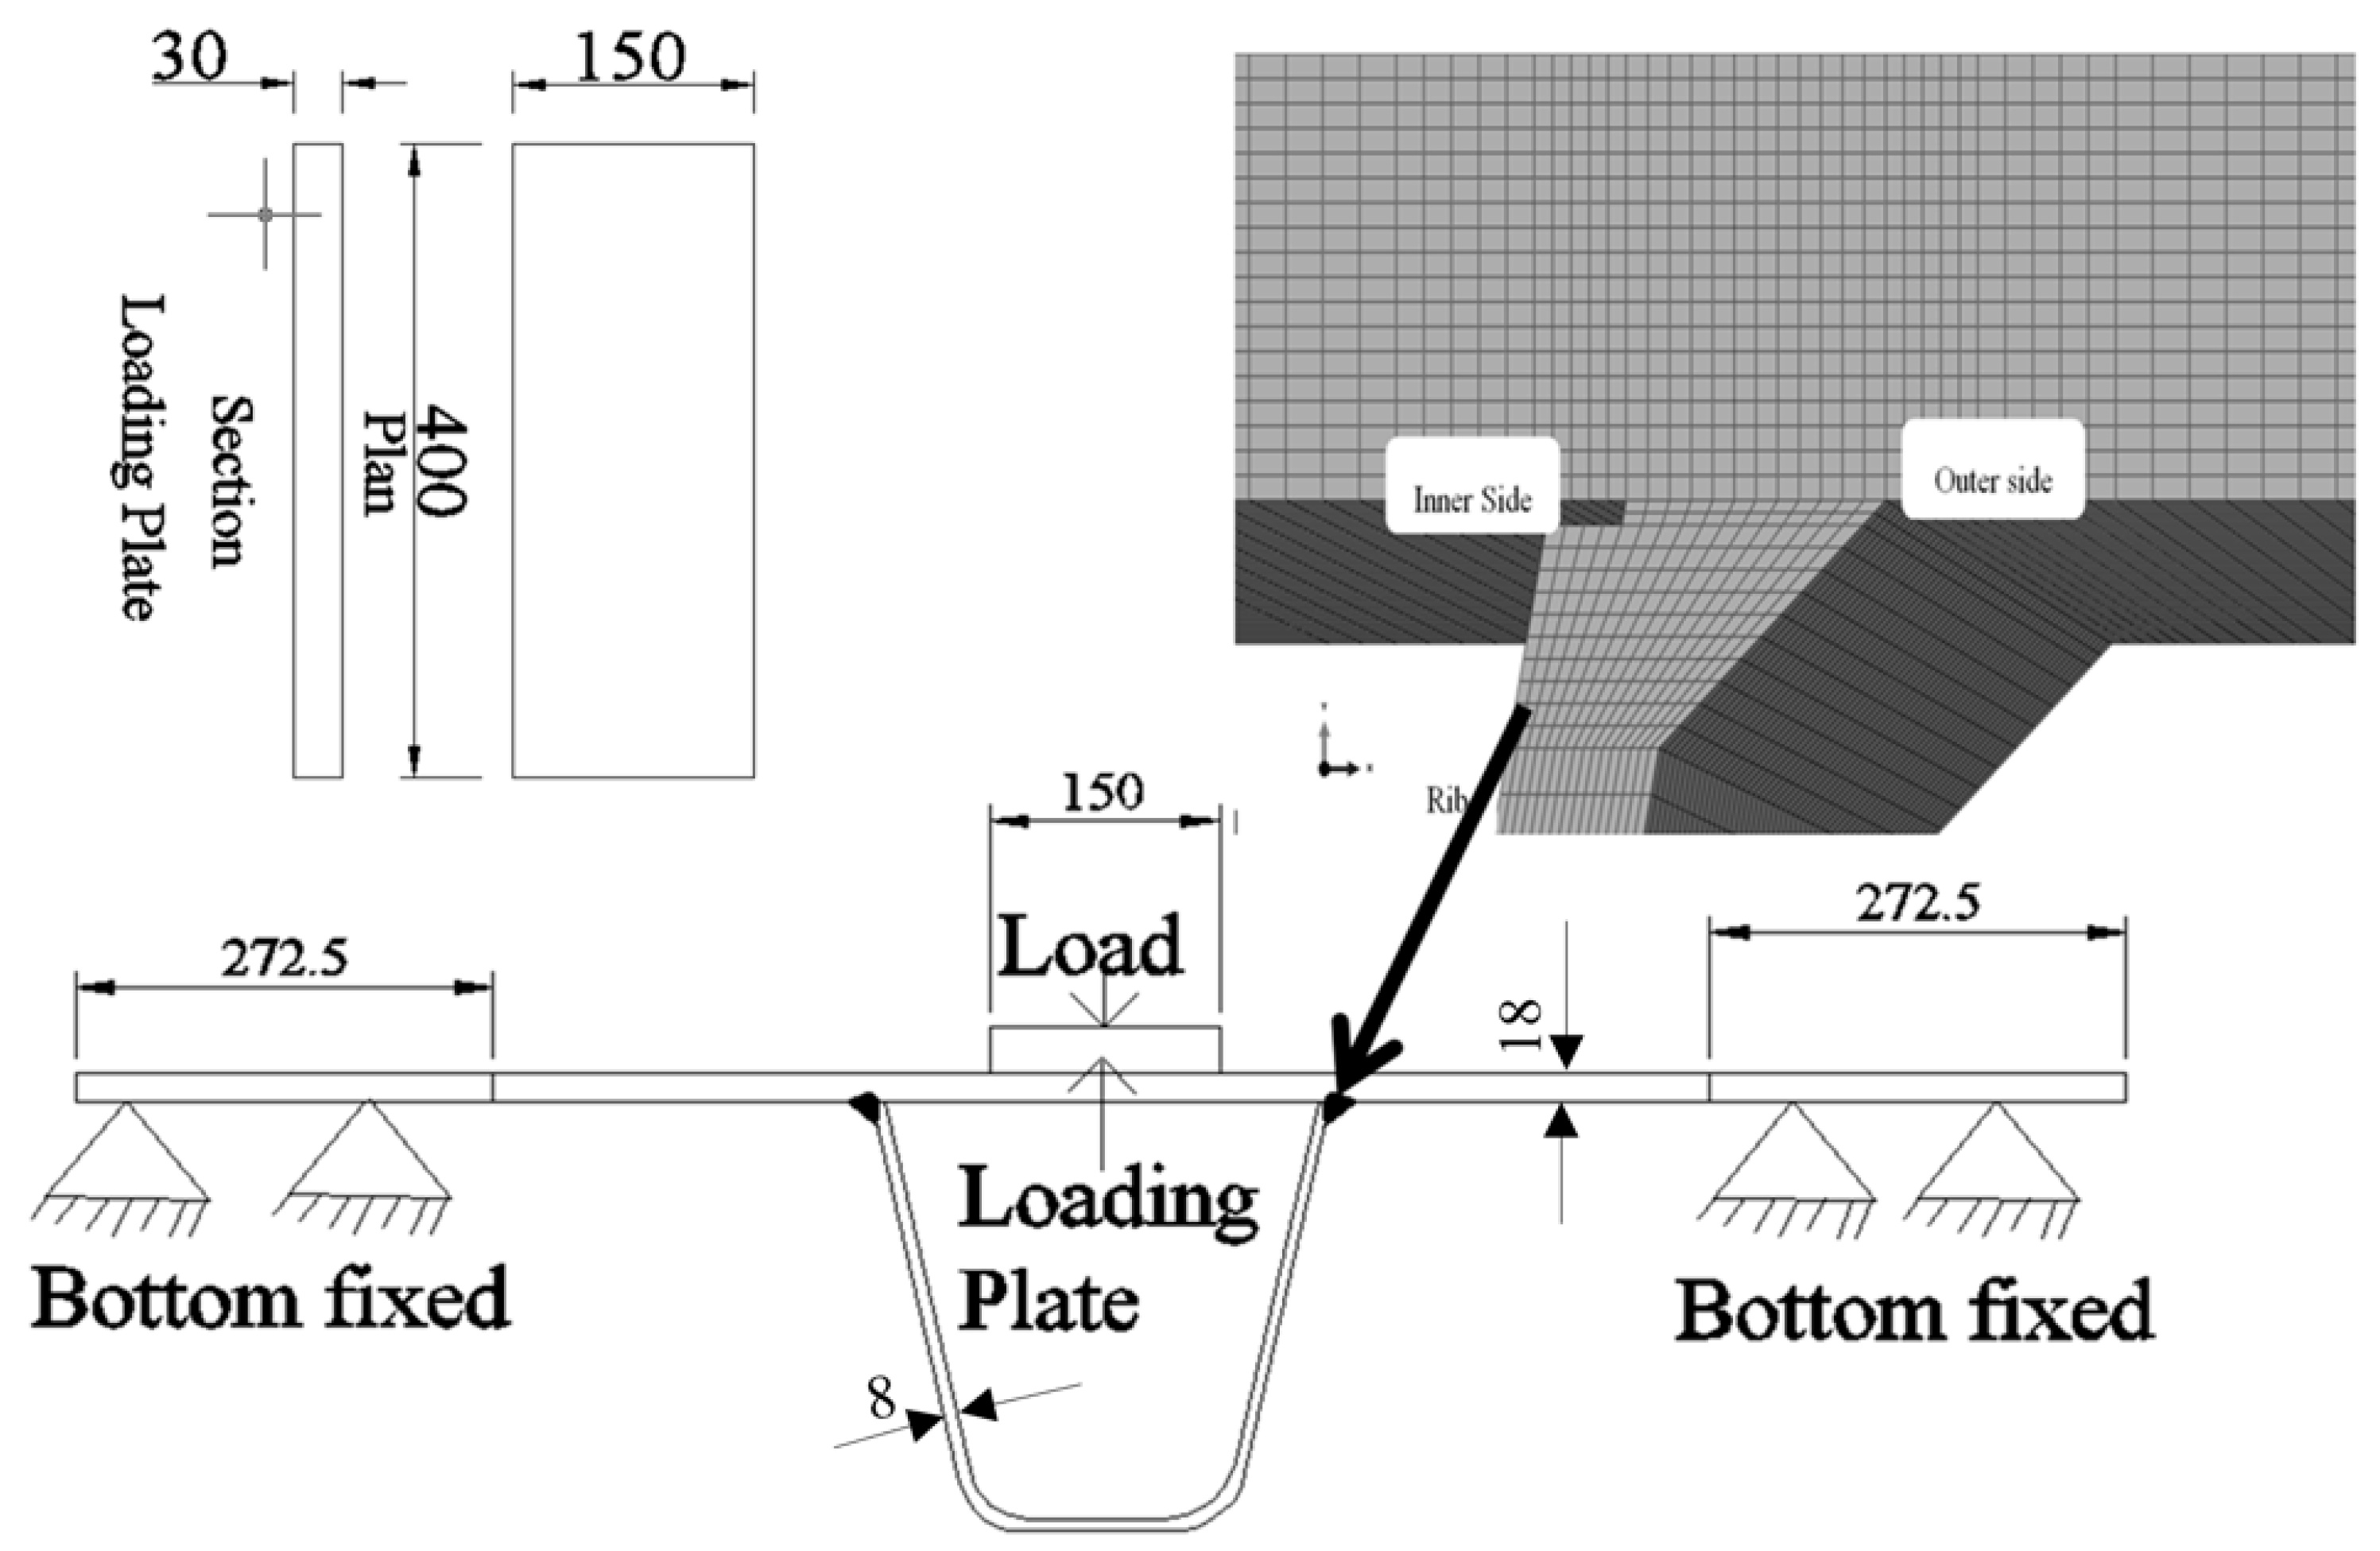
4.1. Single Ribbed Model
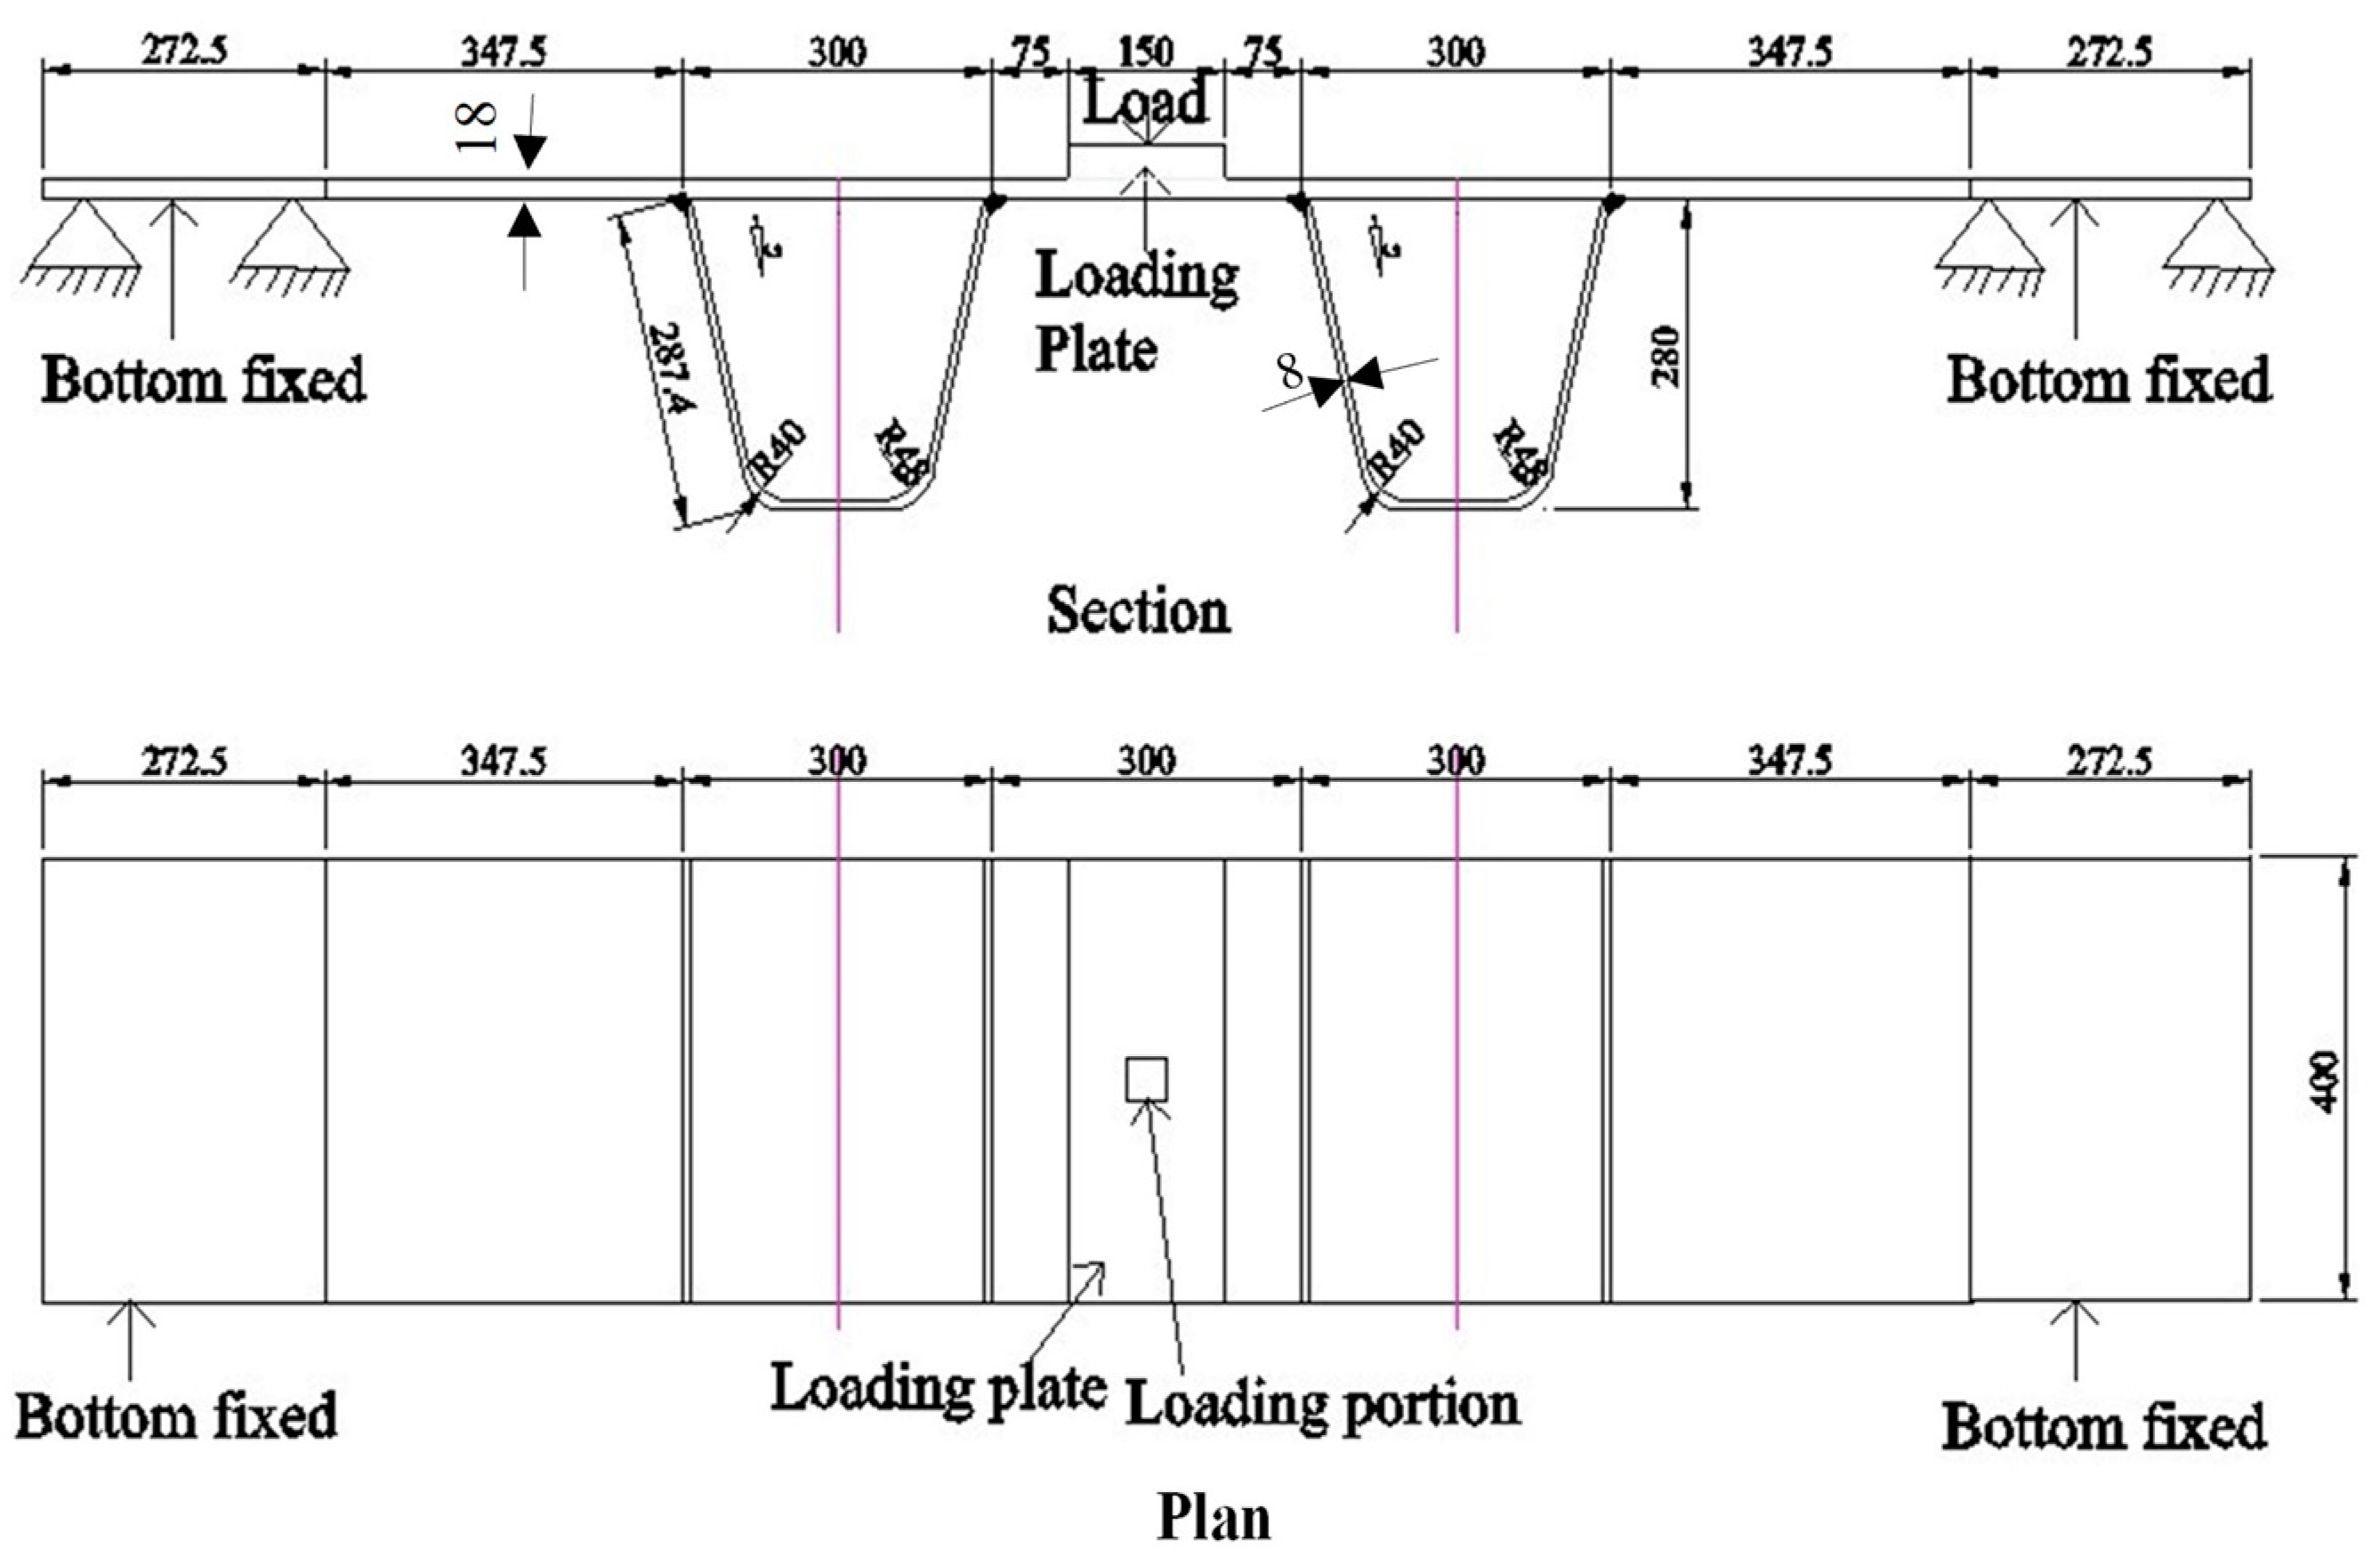
4.2. Double-Ribbed Specimen
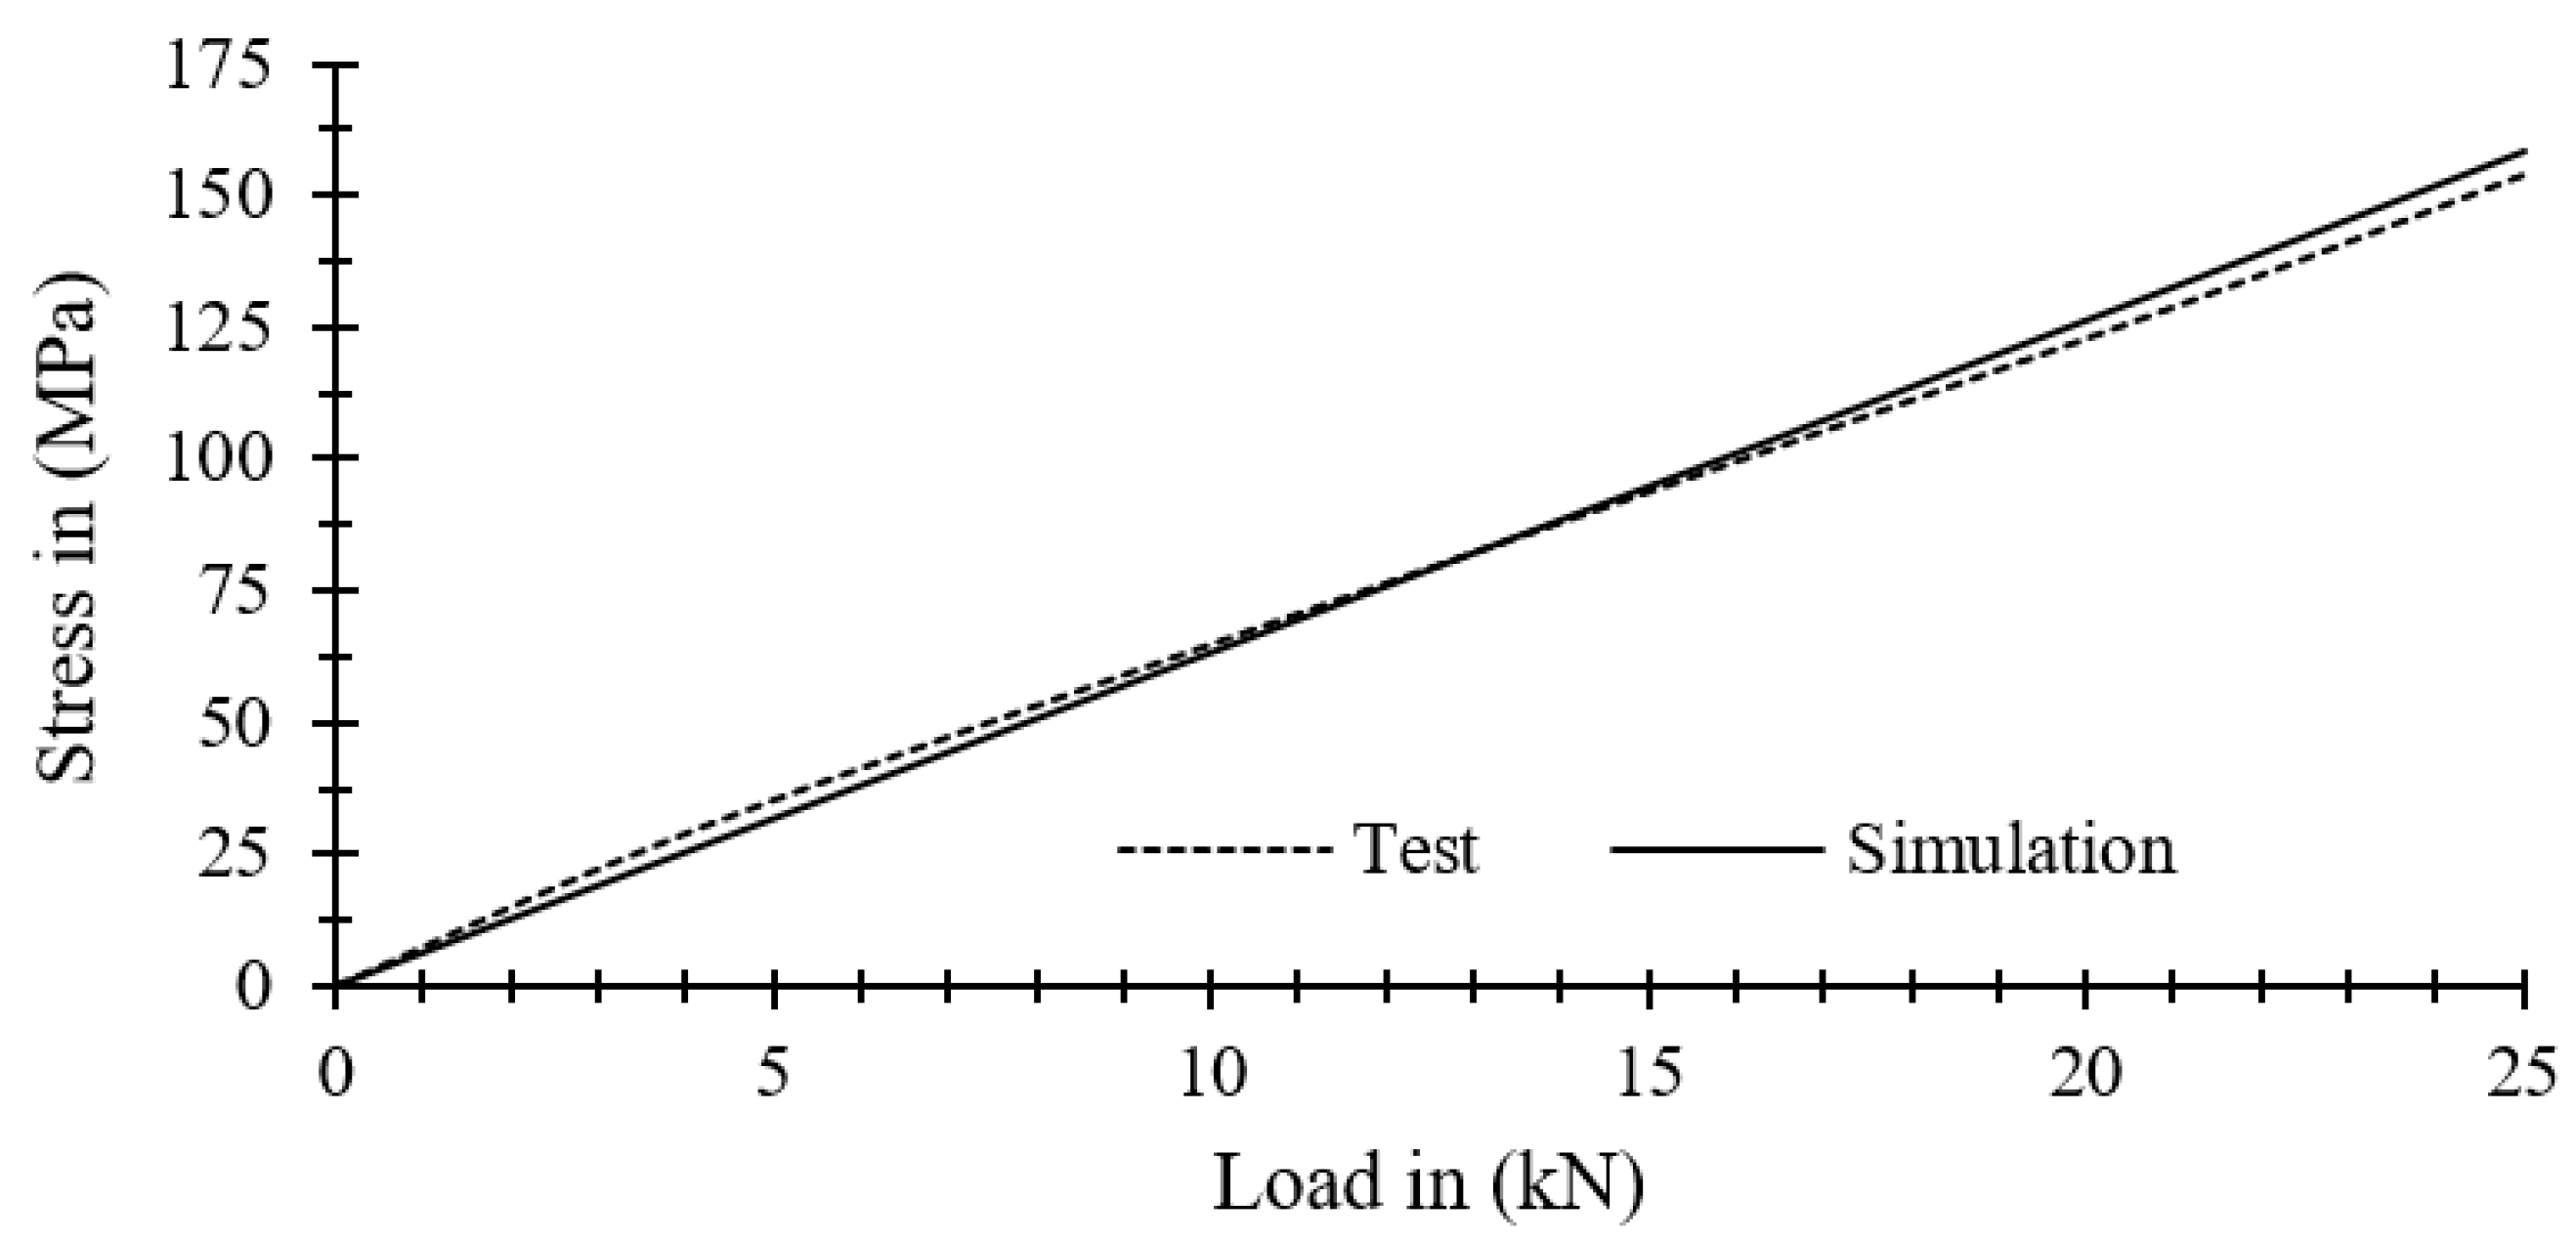
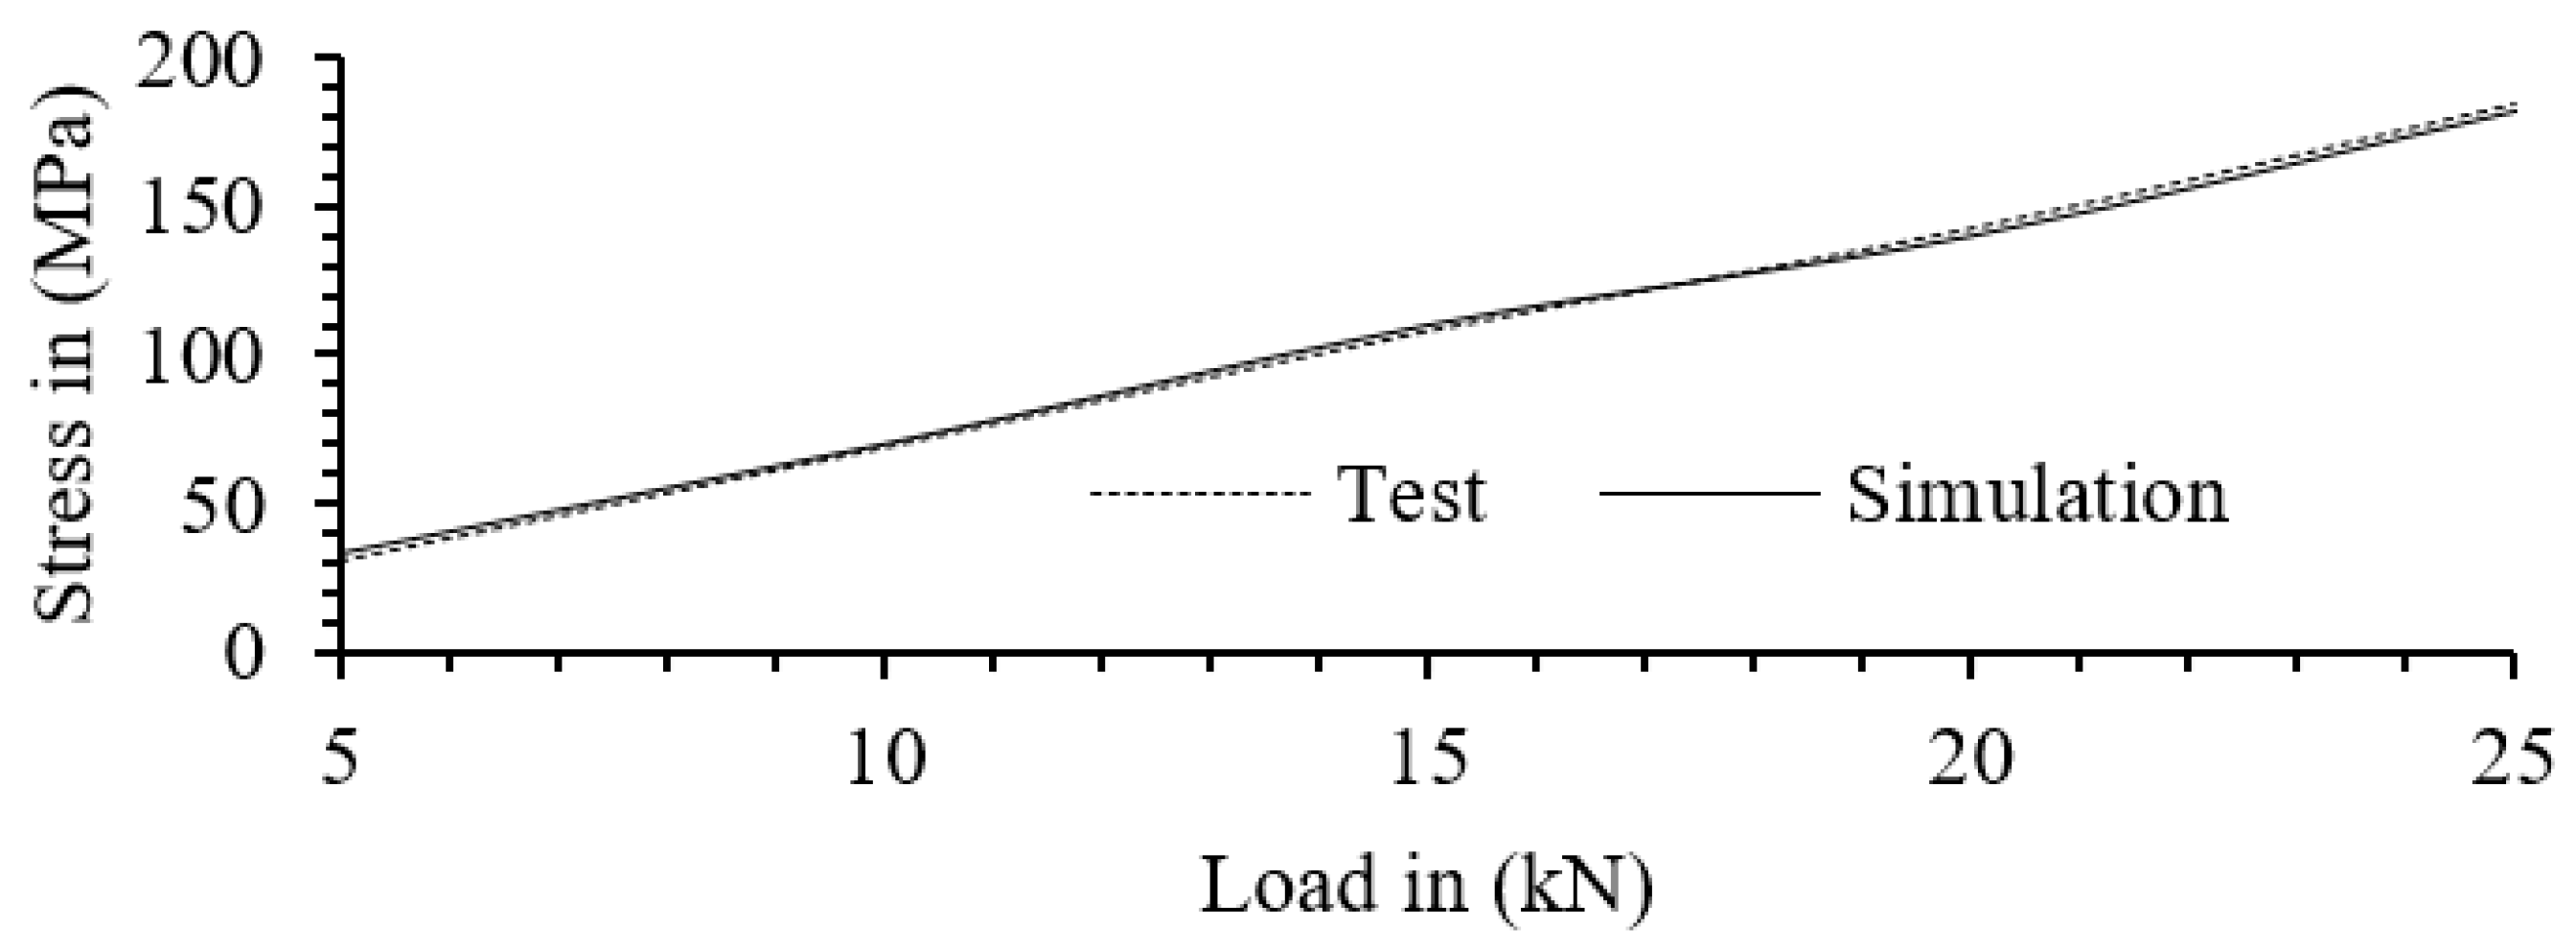
5. Validation of Simulation Results
6. Analysis
7. Discussion and Limitations
8. Conclusions
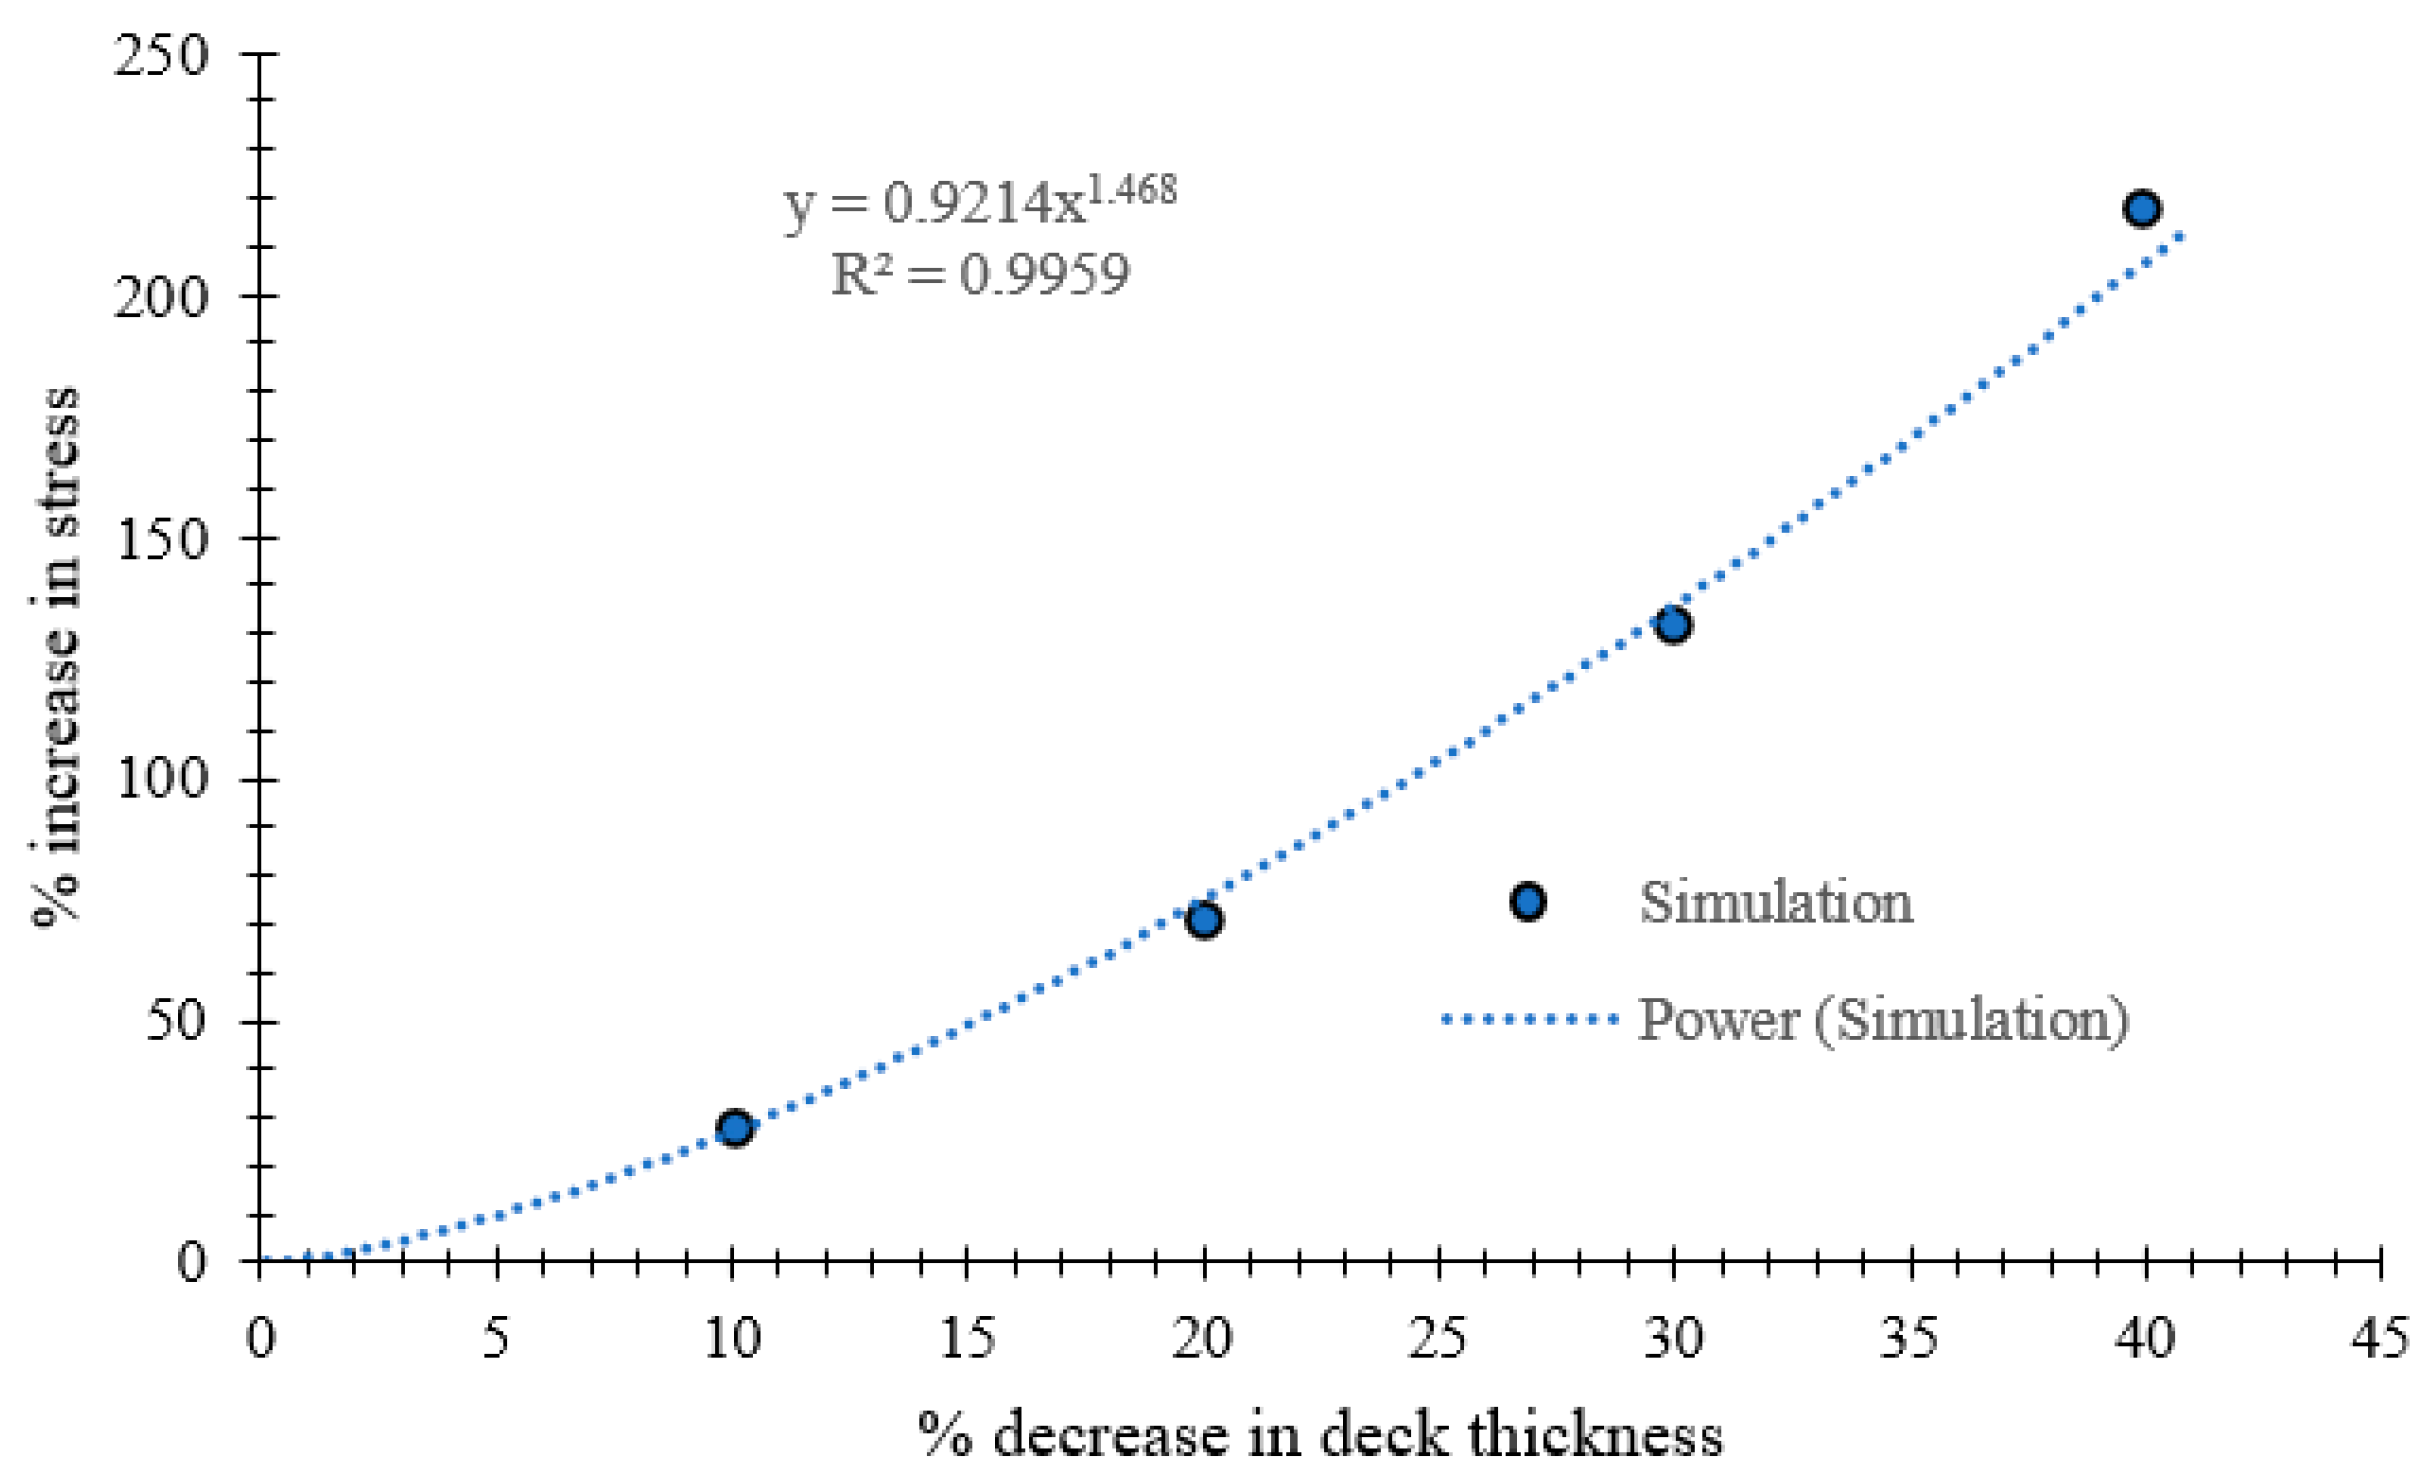
- The decks are the most important component influencing the fatigue life at rib to deck connection. The percentage of stress increase with percentage decrease in deck thickness follows a power relation with coefficient 0.9214 and exponent 1.468, with a coefficient of determination R2 equal to 0.9959. Therefore, an increase in deck thickness increases the fatigue life significantly.
- Thicker ribs increase stress concentration which may be due to an increase in stiffness.
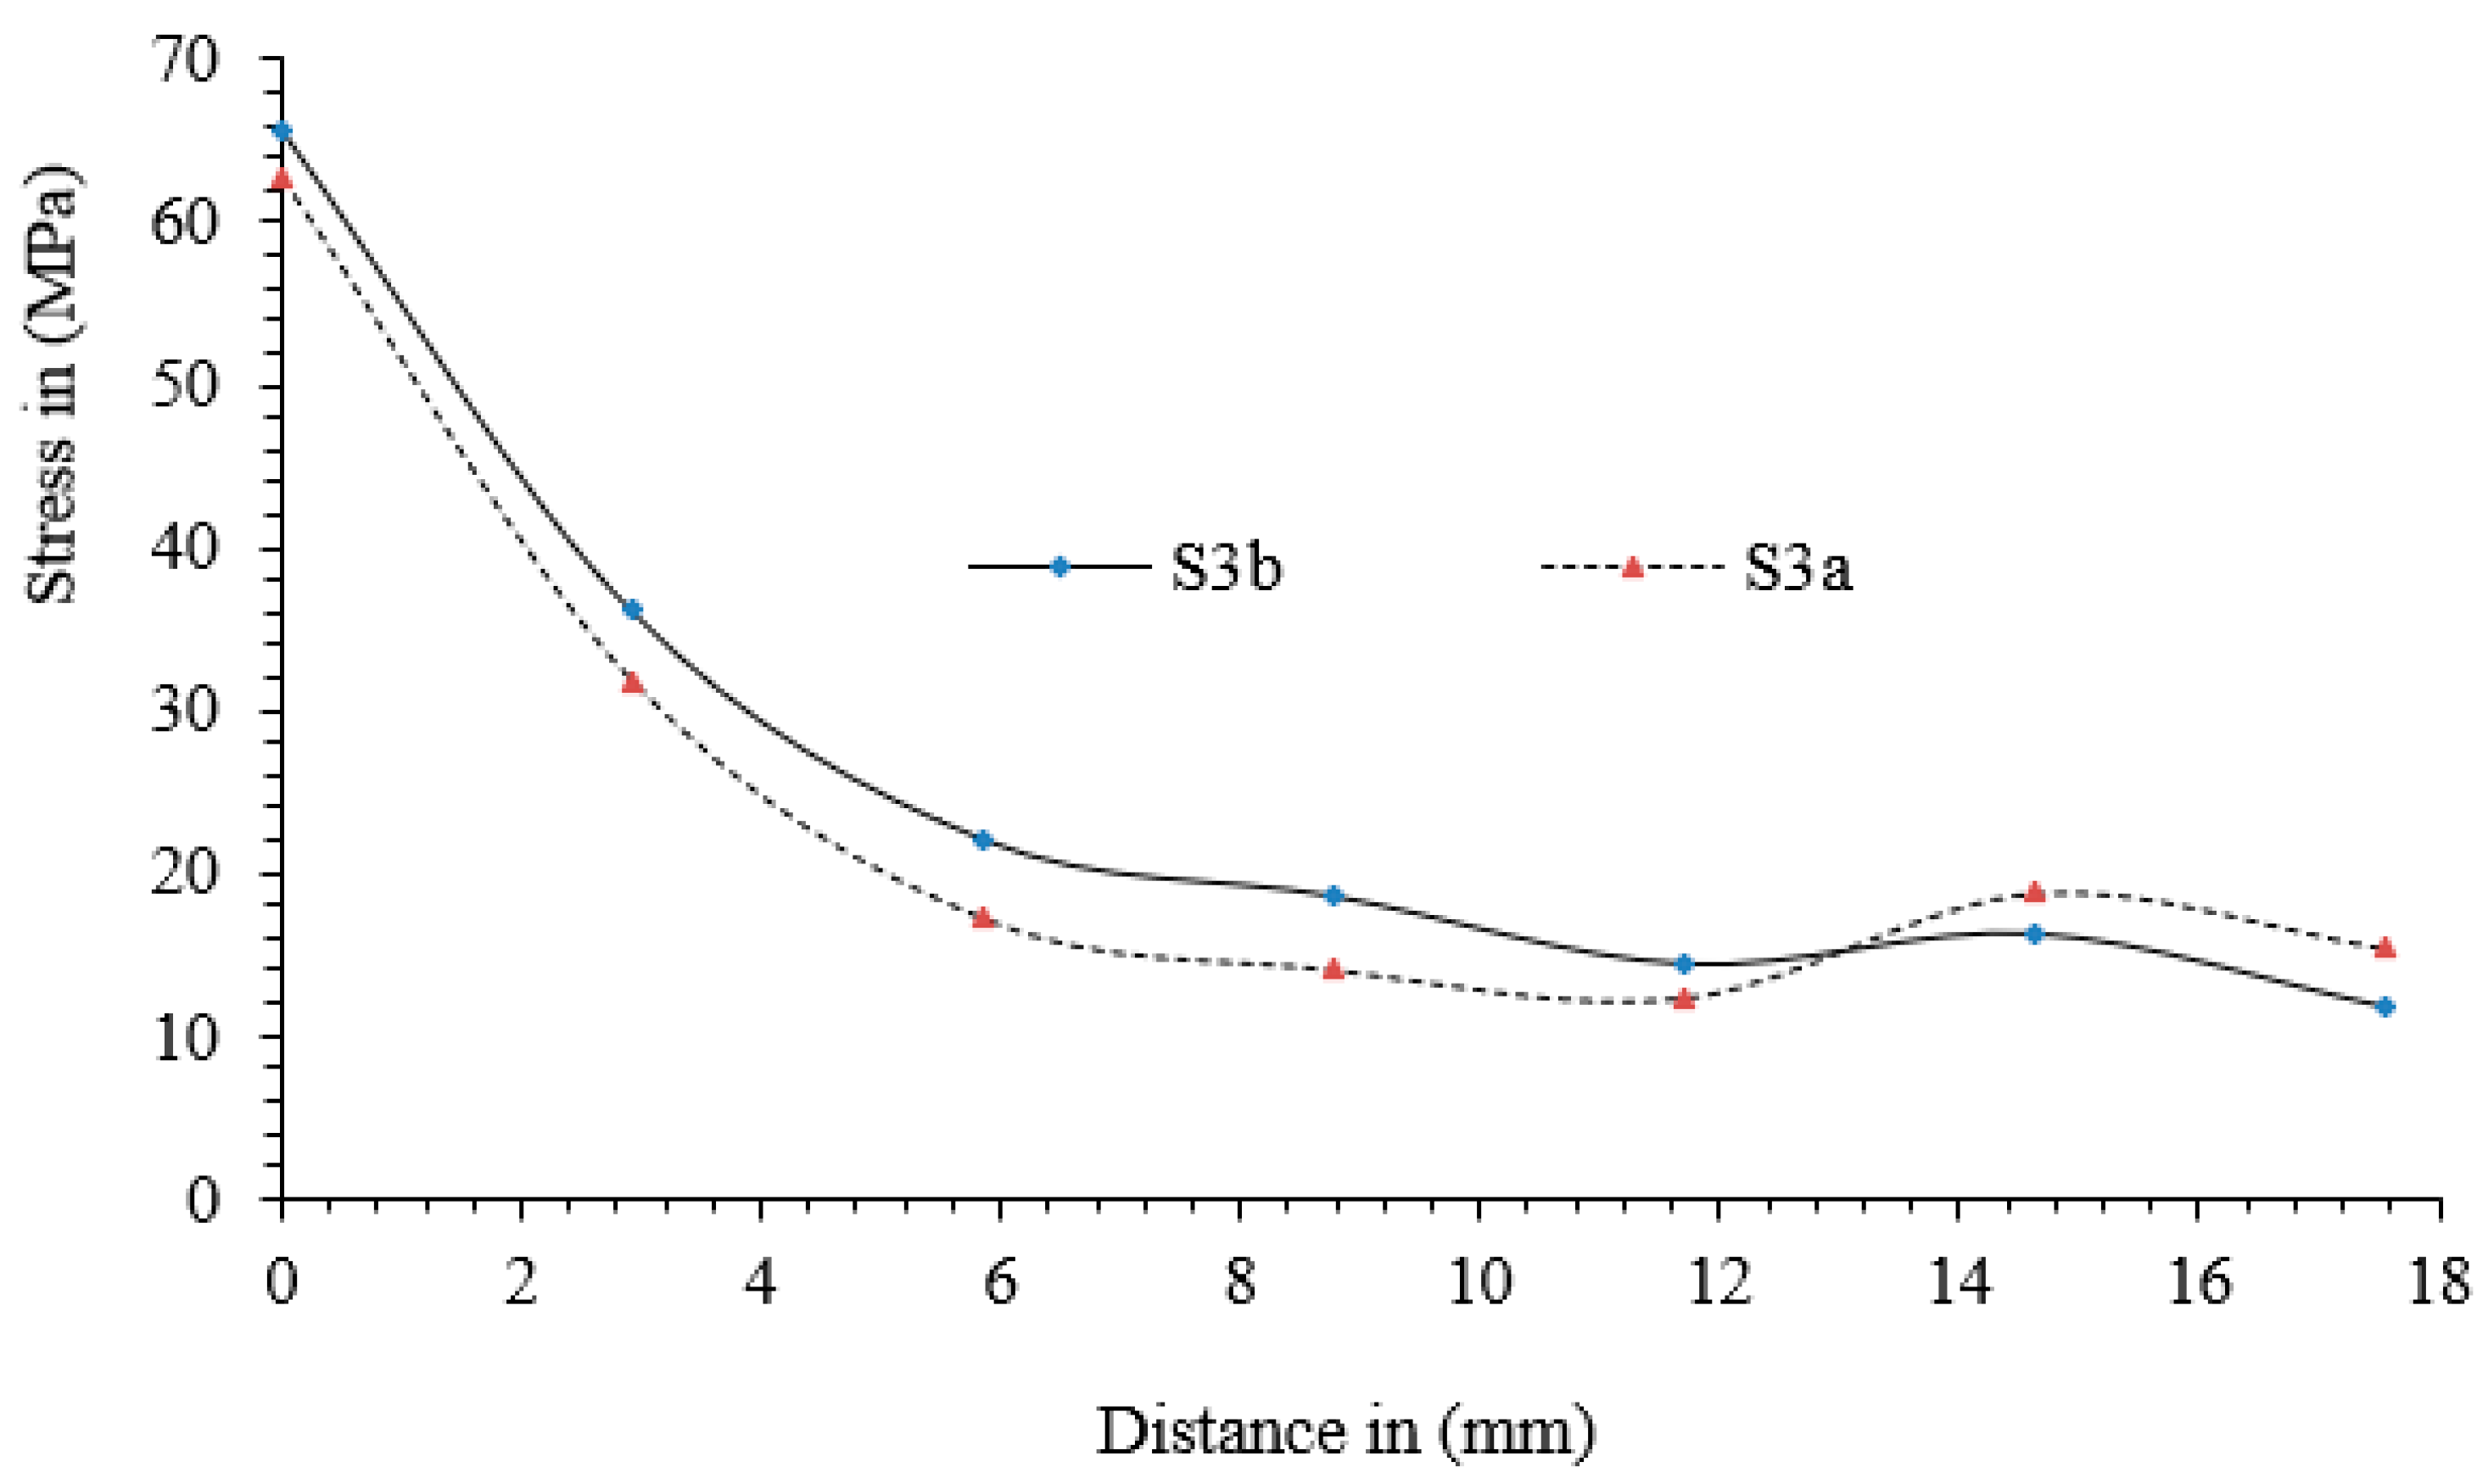
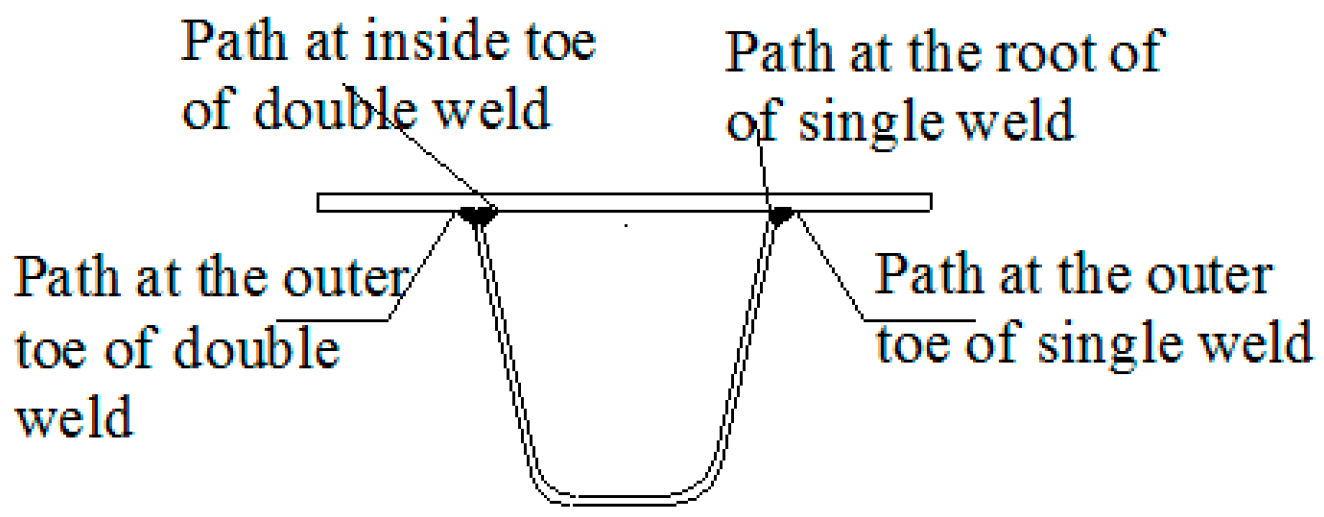
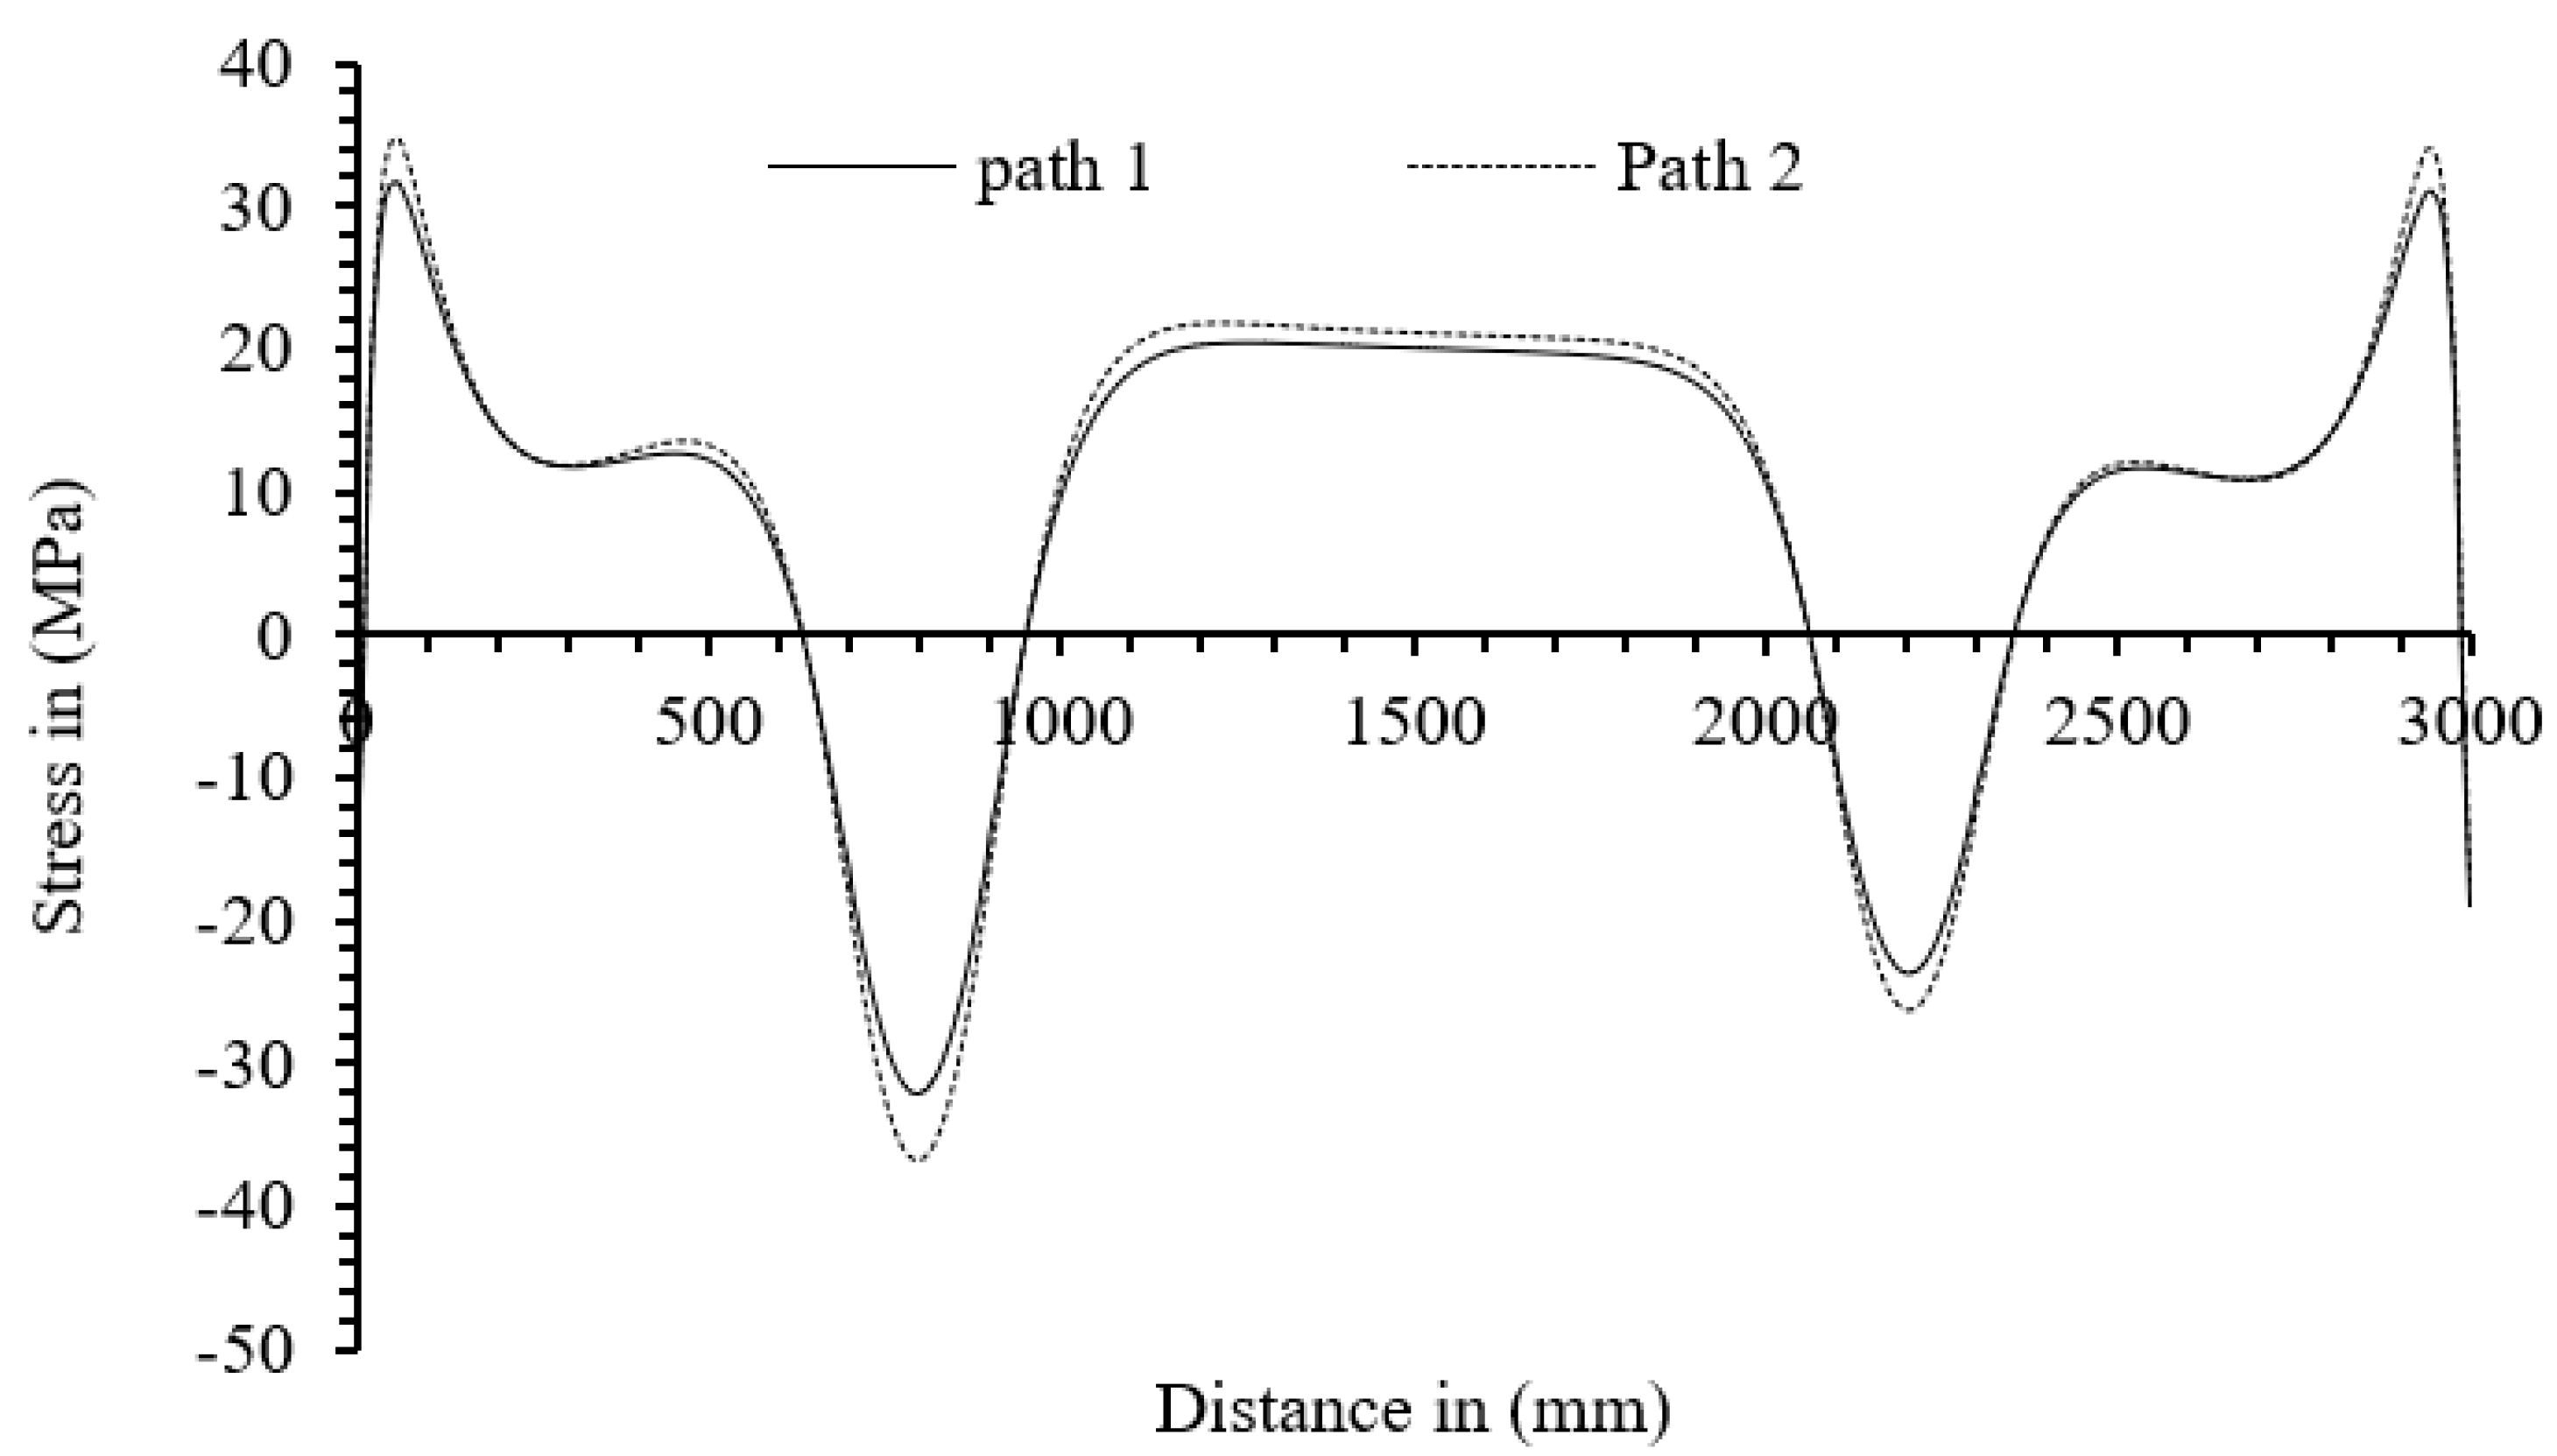
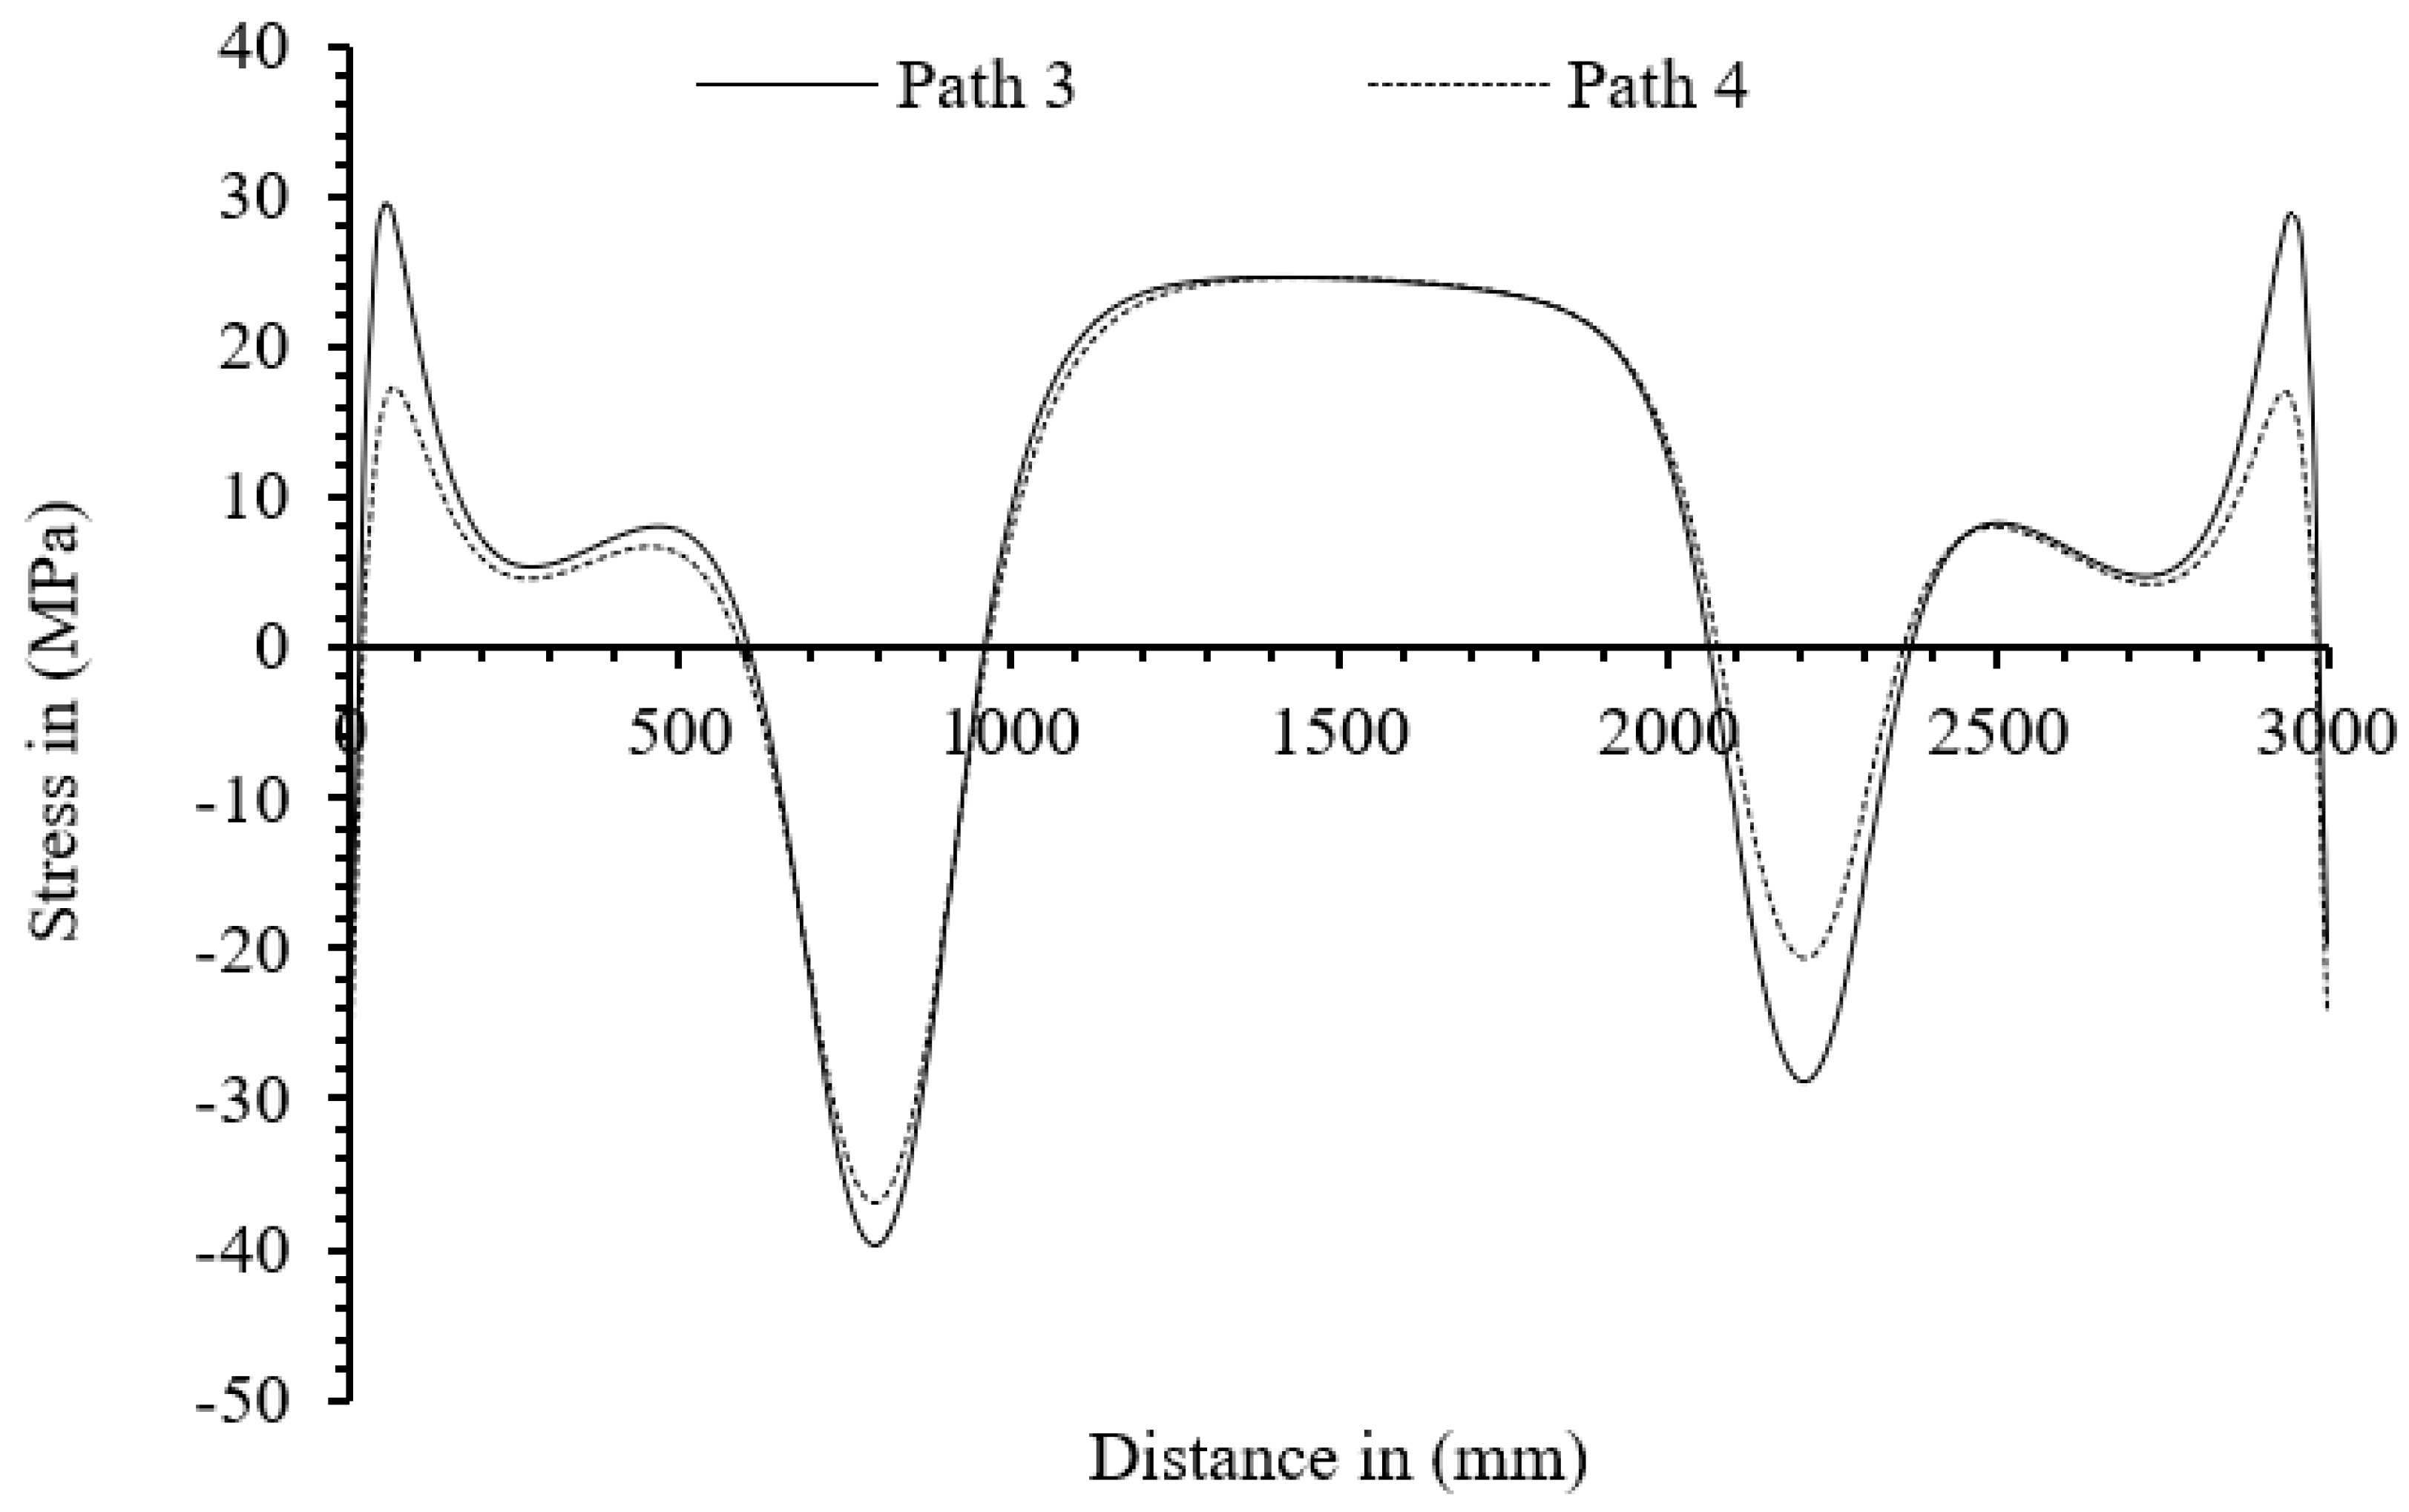
- The overall stress concentration on the outer side of the closed stiffener at toe at the deck of double welded connection is maximum; however, on the inner side of the closed stiffener, the tensile stress concentration at the weld root of single welded connection is significantly higher than weld toe of double welded connection. Therefore, in general the fatigue cracks are expected to initiate on the outer side of closed stiffener at the weld toe at deck and the fatigue life of double welded connection is expected to be shortest, but in situation when micro cracks or weld defects are present at the inner side of the rib or if the crack initiate on the inner side of the rib, the cracks at the weld root of single welded connections can propagate much faster than the double welded connections.
- An increase in weld penetration slightly increases stress concentration possibly due to increase in stiffness at the connection.
- Double welds concentrate more stress which decrease fatigue life; however, for deep weld penetration the degradation of parent material is more severe so lower weld penetration from both sides may reduce the flaws during welding hence reduce the probability of crack initiation.
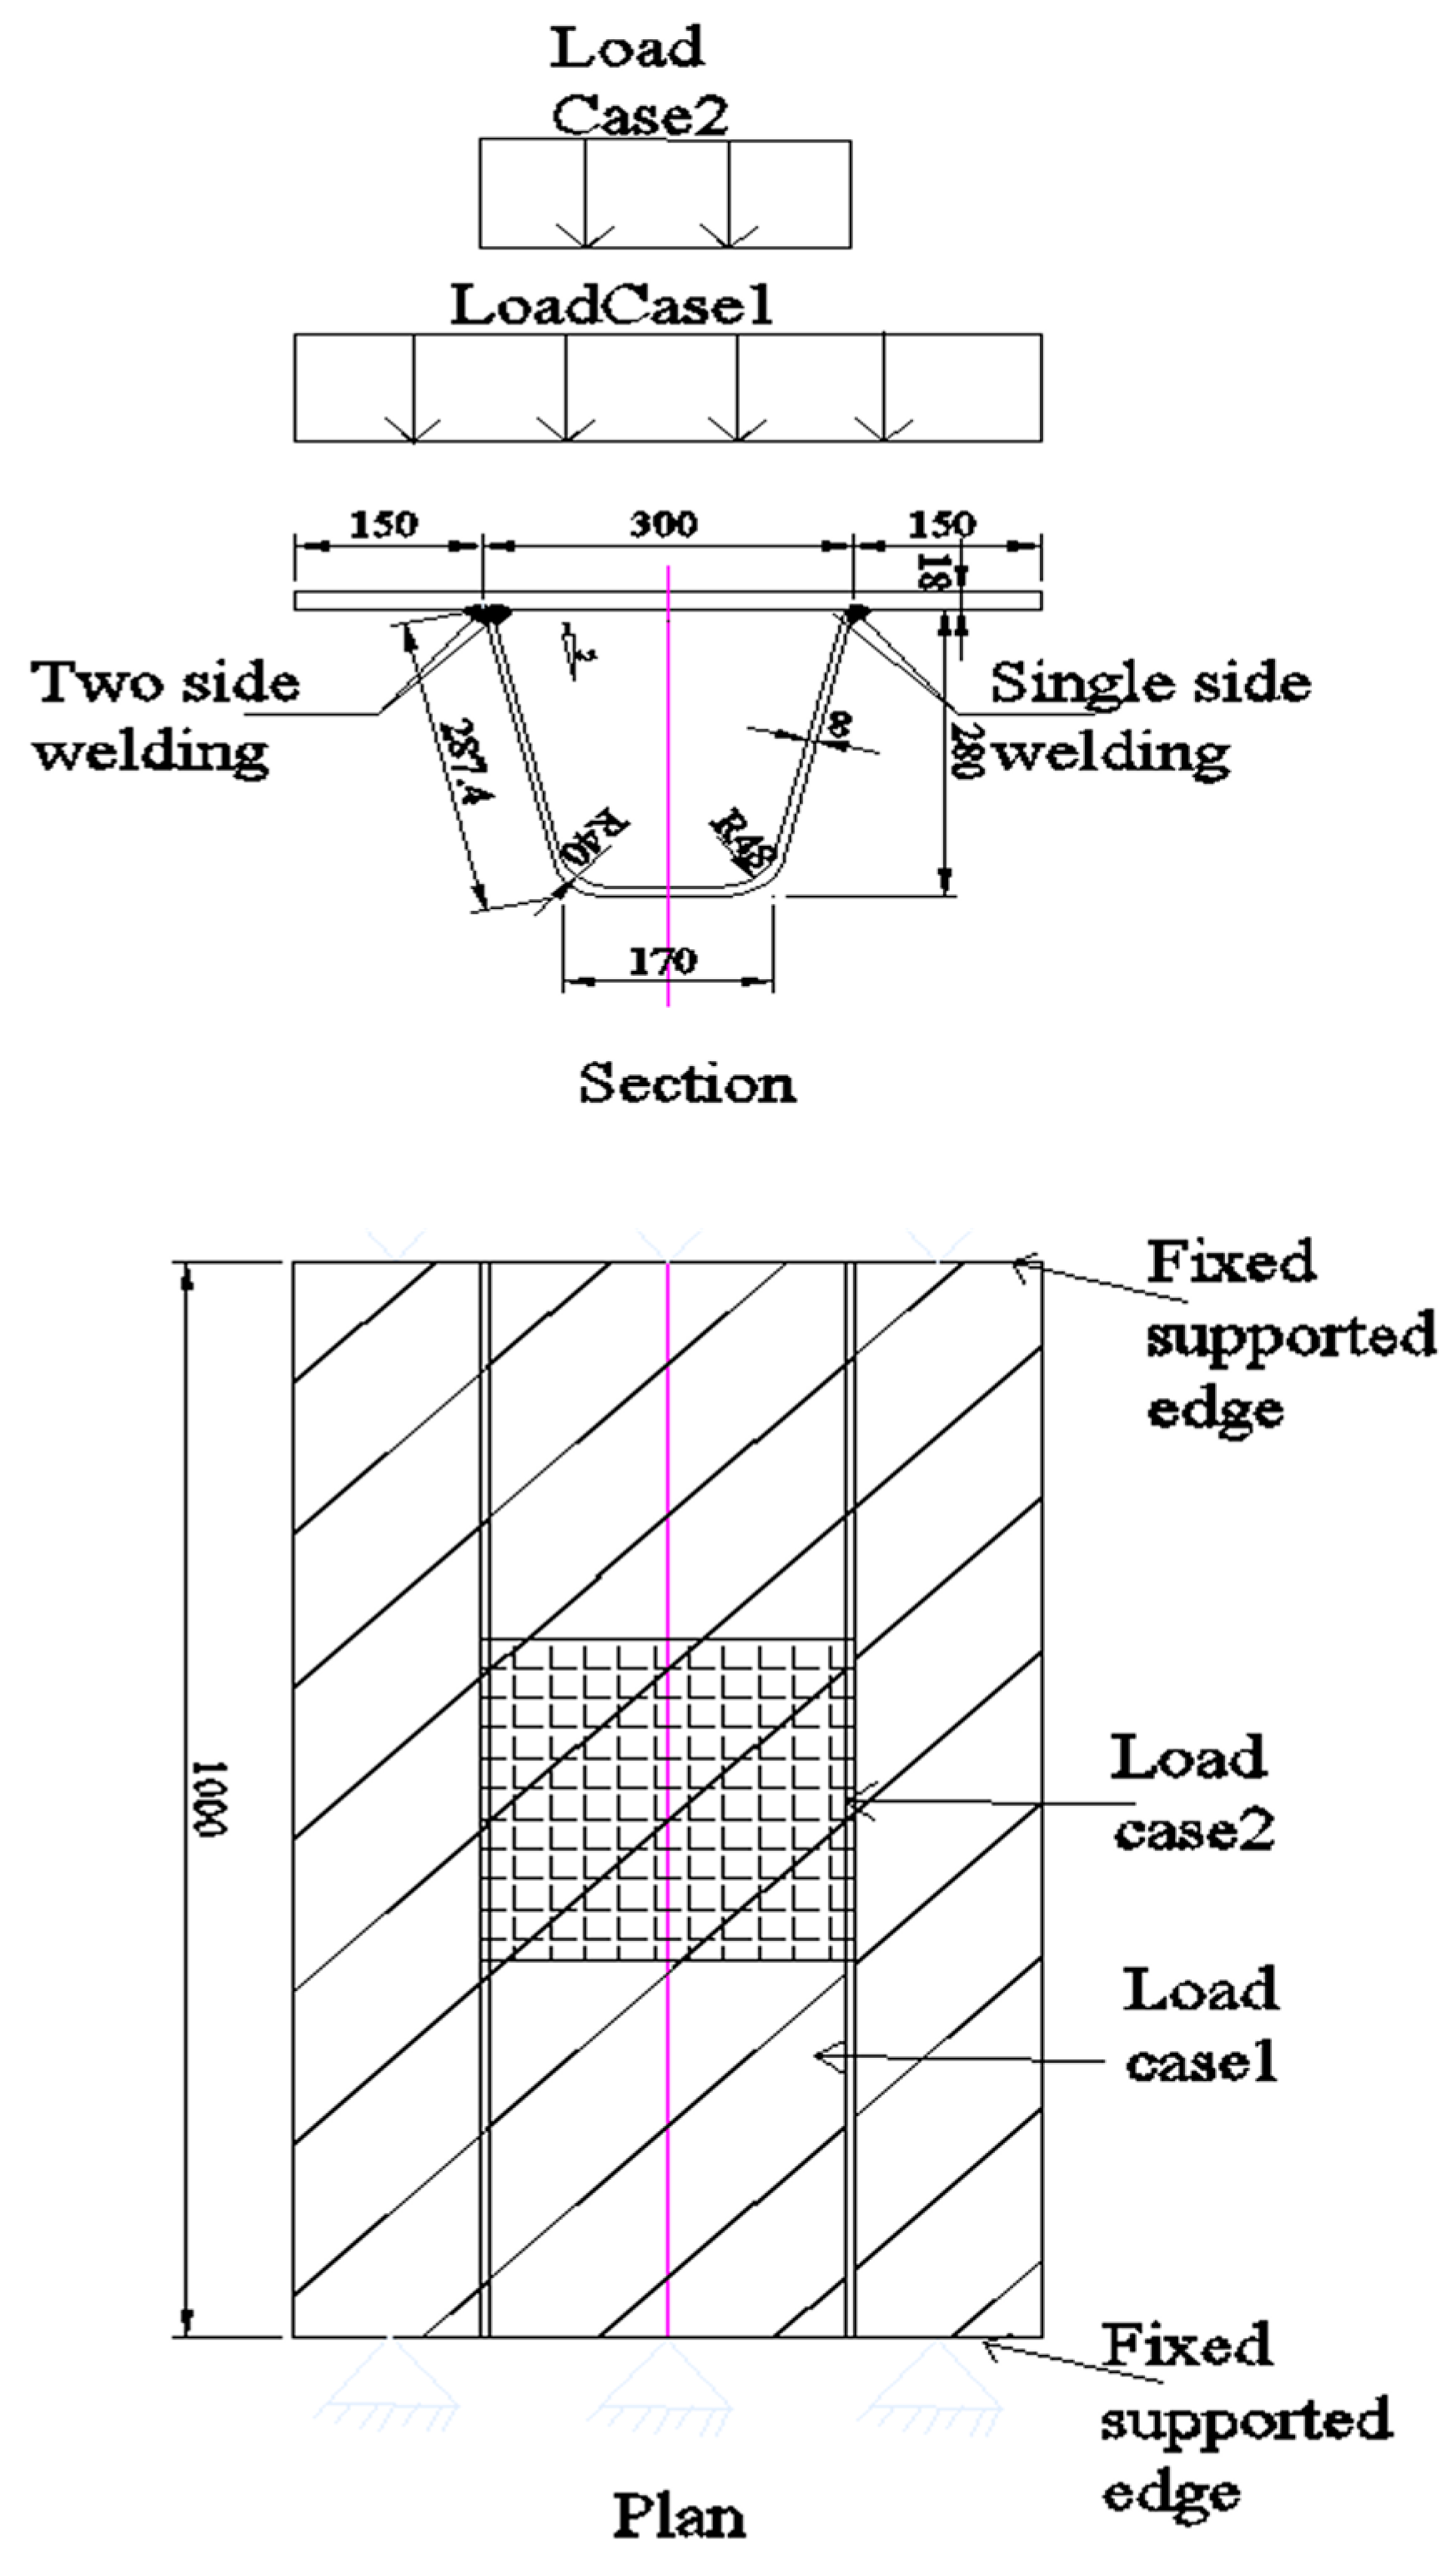
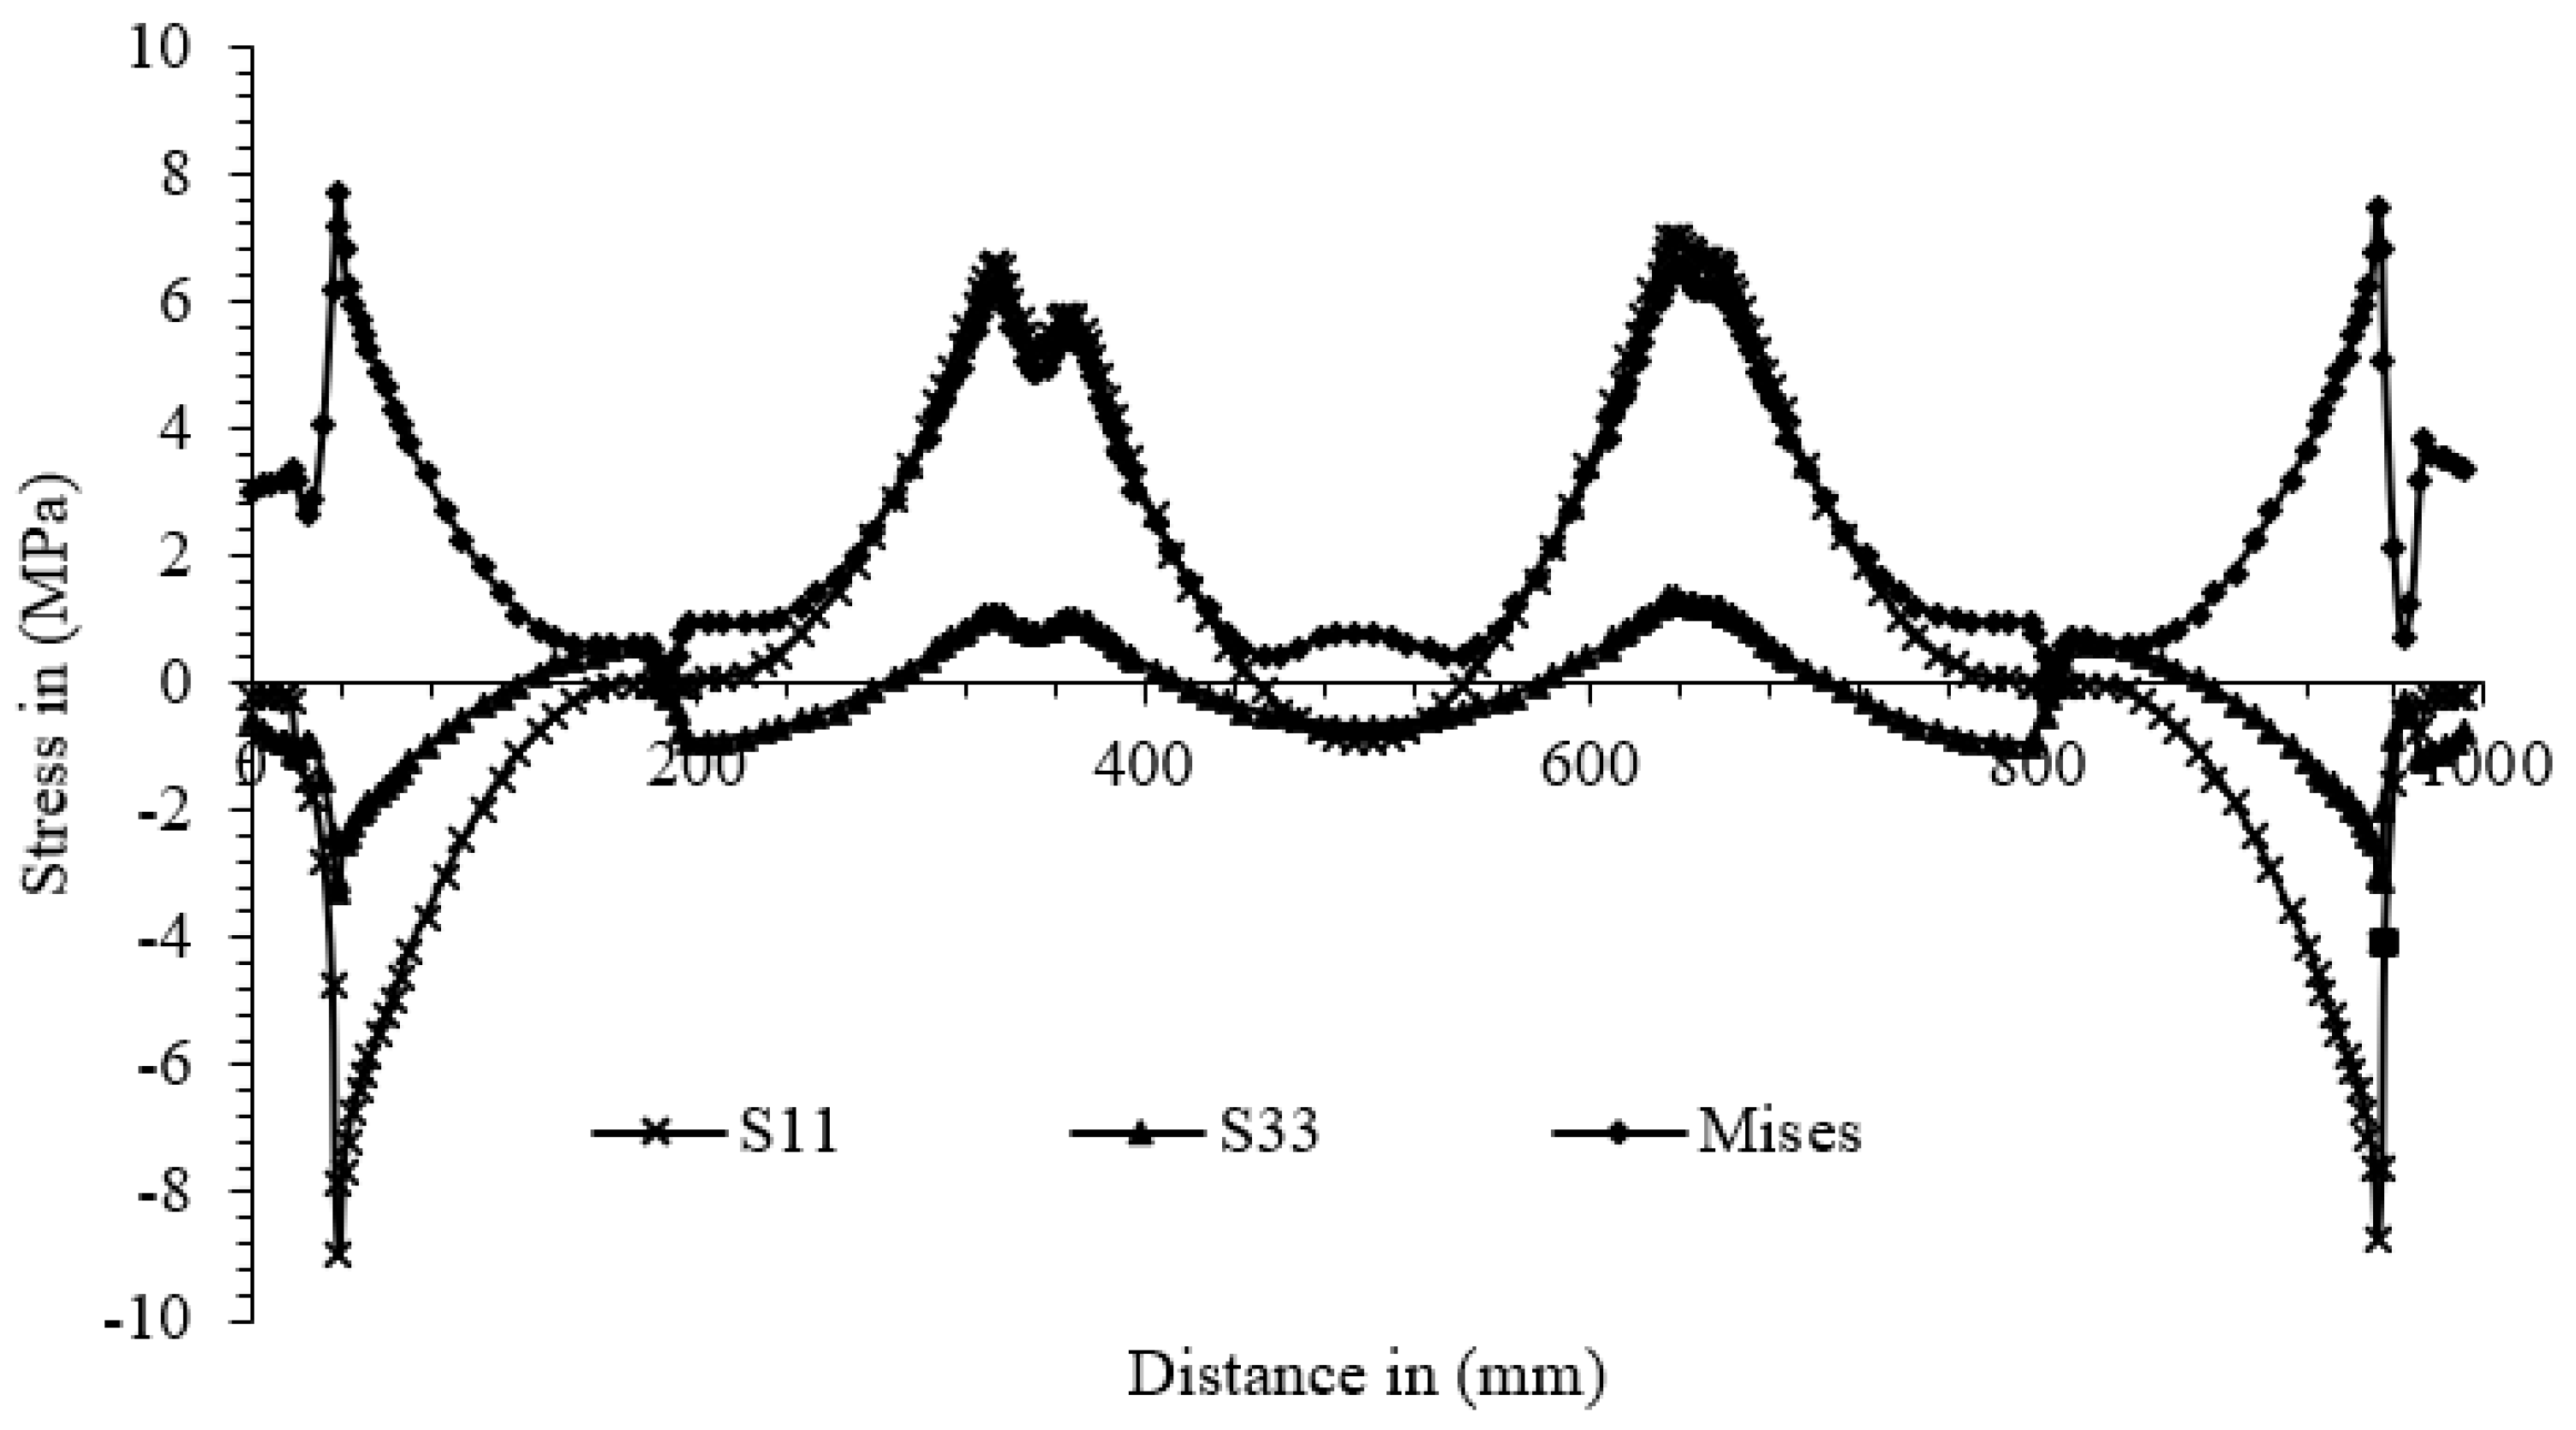
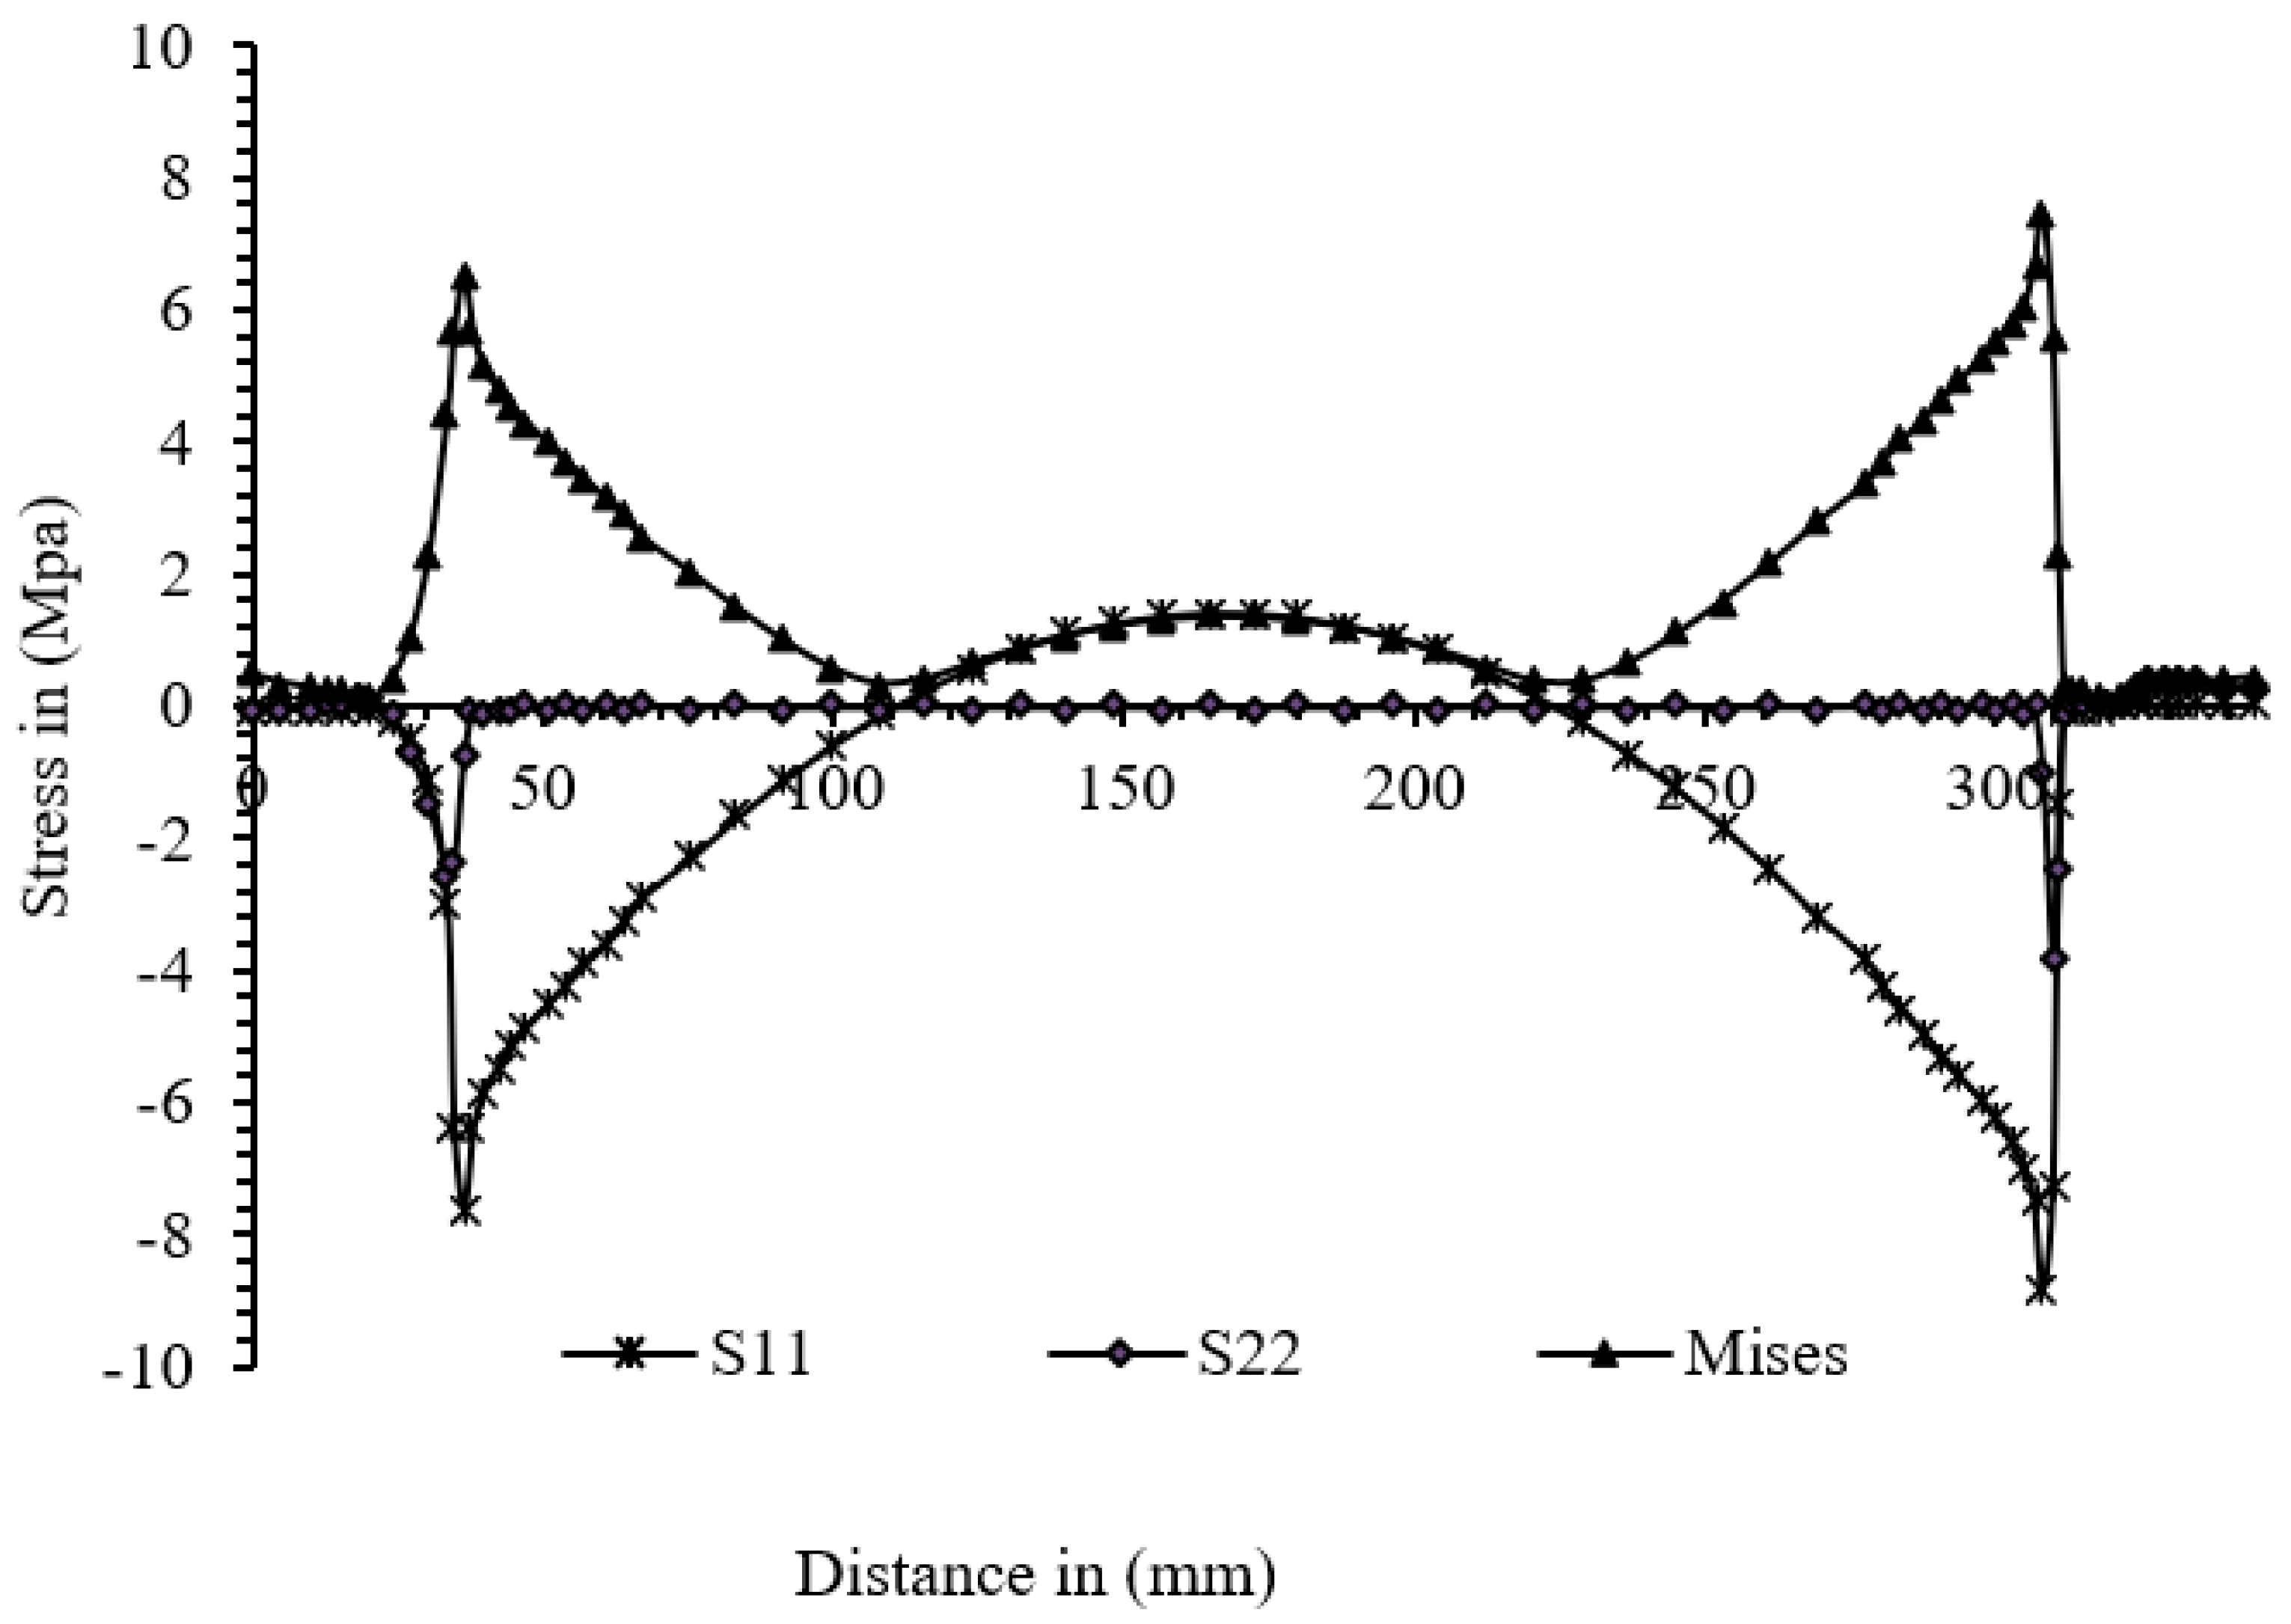
- The position of load also plays role in stress concentration. In Table 7, stress concentration at root is highest when the load is located entirely in between the two legs of a closed stiffener. Therefore, in this case the fatigue cracks are likely to occur at weld root.
Author Contributions
Funding
Data Availability Statement
Conflicts of Interest
References
- Kolstein, M.H. Fatigue Classification of Welded Joints on Orthotropic Steel Bridge Decks. Ph.D. Thesis, Delft University, Delft, The Netherlands, 2007. [Google Scholar]
- US Department of Transportation of Federal Highway Administration. Manual for Design, Construction and Maintenance of Orthotropic Steel Deck Bridges; Federal Highway Administration: Washington, DC, USA, 2012.
- Stephens, R.I.; Fatemi, A.; Stephens, R.R.; Fuchs, H.O. Metal Fatigue in Engineering; John Wiley & Sons: New York, NY, USA, 2000. [Google Scholar]
- Fricke, W. Fatigue analysis of welded joints: State of development. Mar. Struct. 2003, 16, 185–200. [Google Scholar] [CrossRef]
- Radaj, D. Review of Fatigue Strength assessment of nonwelded and welded structures based on local parameters. Int. J. Fatigue 1996, 18, 153–170. [Google Scholar] [CrossRef]
- Maddox, S.J. Fatigue Strength of Welded Structures; Woodhead Publishing: Sawston, UK, 1991. [Google Scholar]
- **ao, Z.G.; Yamada, K.; Inoue, J.; Yamaguchi, K. Fatigue cracks in longitudinal ribs of steel orthotropic deck. Int. J. Fatigue 2006, 28, 409–416. [Google Scholar] [CrossRef]
- American Association of State Highway and Transportation Officials (AASTHO). LRFD Bridge Design Specifications, 5th ed.; AASTHO: Washington, DC, USA, 2010. [Google Scholar]
- Japan Road Association (JRA). Japanese Specifications for Steel Bridges; Japan Road Association: Tokyo, Japan, 2002. (In Japanese) [Google Scholar]
- JTG D64-2015; Specification for Design of Highway Steel Bridge. S.K. Kataria & Sons: Delhi, India, 2015.
- European Committee of Standardization. Eurocode 3, Design for Steel Structures, Part2: Steel Bridges; European Committee of Standardization: Brussels, Belgium, 2003. [Google Scholar]
- **ao, Z.G.; Yamada, K.; Ya, S.; Zhao, X.L. Stress analyses and fatigue evaluation of rib-to-deck joints in steel orthotropic decks. Int. J. Fatigue 2008, 30, 1387–1397. [Google Scholar] [CrossRef]
- Pfeil, M.S.; Battista, R.C.; Mergulhao, A.J.R. Stress Concentration in Steel bridge orthotropic decks. J. Constr. Steel Res. 2005, 61, 1172–1184. [Google Scholar] [CrossRef]
- Kainuma, S.; Yang, M.; Jeong, Y.S.; Inokuchi, S.; Kawabata, A.; Uchida, D. Experiment on fatigue behavior of rib-to-deck weld root in orthotropic steel decks. J. Constr. Steel Res. 2016, 119, 113–122. [Google Scholar] [CrossRef]
- Sim, H.B.; Uang, C.M. Stress analysis and parametric study on full-Scale fatigue tests of rib-to-deck welded joints in steel orthotropic decks. J. Bridge Eng. 2012, 17, 765–773. [Google Scholar] [CrossRef]
- Samol, Y.; Kentaro, Y.; Toshiyuki, I. Fatigue Evaluation of Rib-to-Deck Welded Joints of Orthotropic Steel Bridge Deck. J. Bridge Eng. 2011, 16, 492–499. [Google Scholar]
- Dung, C.V.; Sasaki, E.; Tajima, K.; Susuki, T. Investigation on the effect of Weld penetration on Fatigue Strength of Rib-to-Deck Joints in Orthotropic Steel Decks. Int. J. Steel Struct. 2015, 15, 299–310. [Google Scholar] [CrossRef]
- Mori, T. Influence of weld penetration of fatigue strength of single sided fillet welded joints. J. Constr. Steel JSSC 2003, 10, 9–15. (In Japanese) [Google Scholar]
- Miki, C.; Tateishi, K. Fatigue damage in orthotropic steel bridge decks and retrofit works. Int. J. Steel Struct. 2006, 19, 255–267. [Google Scholar]
- Nagy, W.; Van Bogaert, P.; De Backer, H. LEFM based fatigue design for welded connections in orthotropic steel bridge decks. Procedia Eng. 2015, 133, 758–769. [Google Scholar] [CrossRef]
- Murakosi, J.; Hirano, S.; Harada, H. Effect of Deck Plate Thickness of Orthotropic Steel Deck on Fatigue Durability; Centre for Advanced Engineering Structural Assessment and Research (CAESAR), PWRI: Tsukuba, Japan, 2008.
- Aygül, M. Fatigue Strength of Welded Details in Steel Bridges with Orthotropic Plates. Master’s Thesis, Chalmers University of Technology, Goteborg, Sweden, 2004. [Google Scholar]
- K C, D. Parametric Analysis on Fatigue Life at Rib-to-Deck Connection in OSD. Master’s Thesis, Huazhong University of Science and Technology, Wuhan, China, 2017. [Google Scholar]
- Zhu, A.; Ouyang, S.; Chen, Y.; Sun, Y. Fatigue test and life evaluation of rib-to-deck connections in orthotropic steel bridge decks. J. Constr. Steel Res. 2022, 197, 107442. [Google Scholar] [CrossRef]
- Hobbacher, A. Recommendations for Fatigue Design of Welded Joints and Components; International Institute of Welding: Paris, France, 2008. [Google Scholar]
- ABAQUS User Manual, Version 6.12; Dassault Systemes Simulia, Inc.: Johnston, RI, USA, 2012.
- DNV-RP-C203; Fatigue Design of Offshore Steel Structures. Det Norske Veritas AS: Høvik, Norway, 2012.
- **ao, Z.G.; Yamada, K. A method of determining geometric stress for fatigue strength evaluation of steel welded joints. Int. J. Fatigue 2004, 26, 1277–1293. [Google Scholar] [CrossRef]
- Kühn, B.; Lukic, M.; Nussbaumer, A.; Günther, H.P.; Helmerich, R.; Herion, S.; Kolstein, M.H.; Walbridge, S.; Androic, B.; Dijkstra, O.; et al. Assessment of Existing Steel Structures: Recommendations for Estimation of Remaining Fatigue Life (No. BOOK); Joint Research Center: Aachen, Germany, 2008. [Google Scholar]
- Yang, H.; Wang, P.; Qian, H.; Niu, S.; Dong, P. An experimental investigation into fatigue behaviors of single-and double-sided U rib welds in orthotropic bridge decks. Int. J. Fatigue 2022, 159, 106827. [Google Scholar] [CrossRef]


| Stress (MPa) Produced at Different Loadings | Remark | |||||
|---|---|---|---|---|---|---|
| 5 kN | 20 kN | 25 kN | 35 kN | 40 kN | ||
| HSS in S2a (MPa) | 32.050 | 128.201 | 160.251 | 224.241 | 253.985 | IIW [25] |
| 31.637 | 126.547 | 158.183 | 221.349 | 251.527 | DNV [27] | |
| HSS in S2b (MPa) | 32.454 | 129.816 | 162.270 | 227.179 | 259.632 | IIW [25] |
| 32.187 | 128.046 | 160.056 | 223.329 | 256.090 | DNV [27] | |
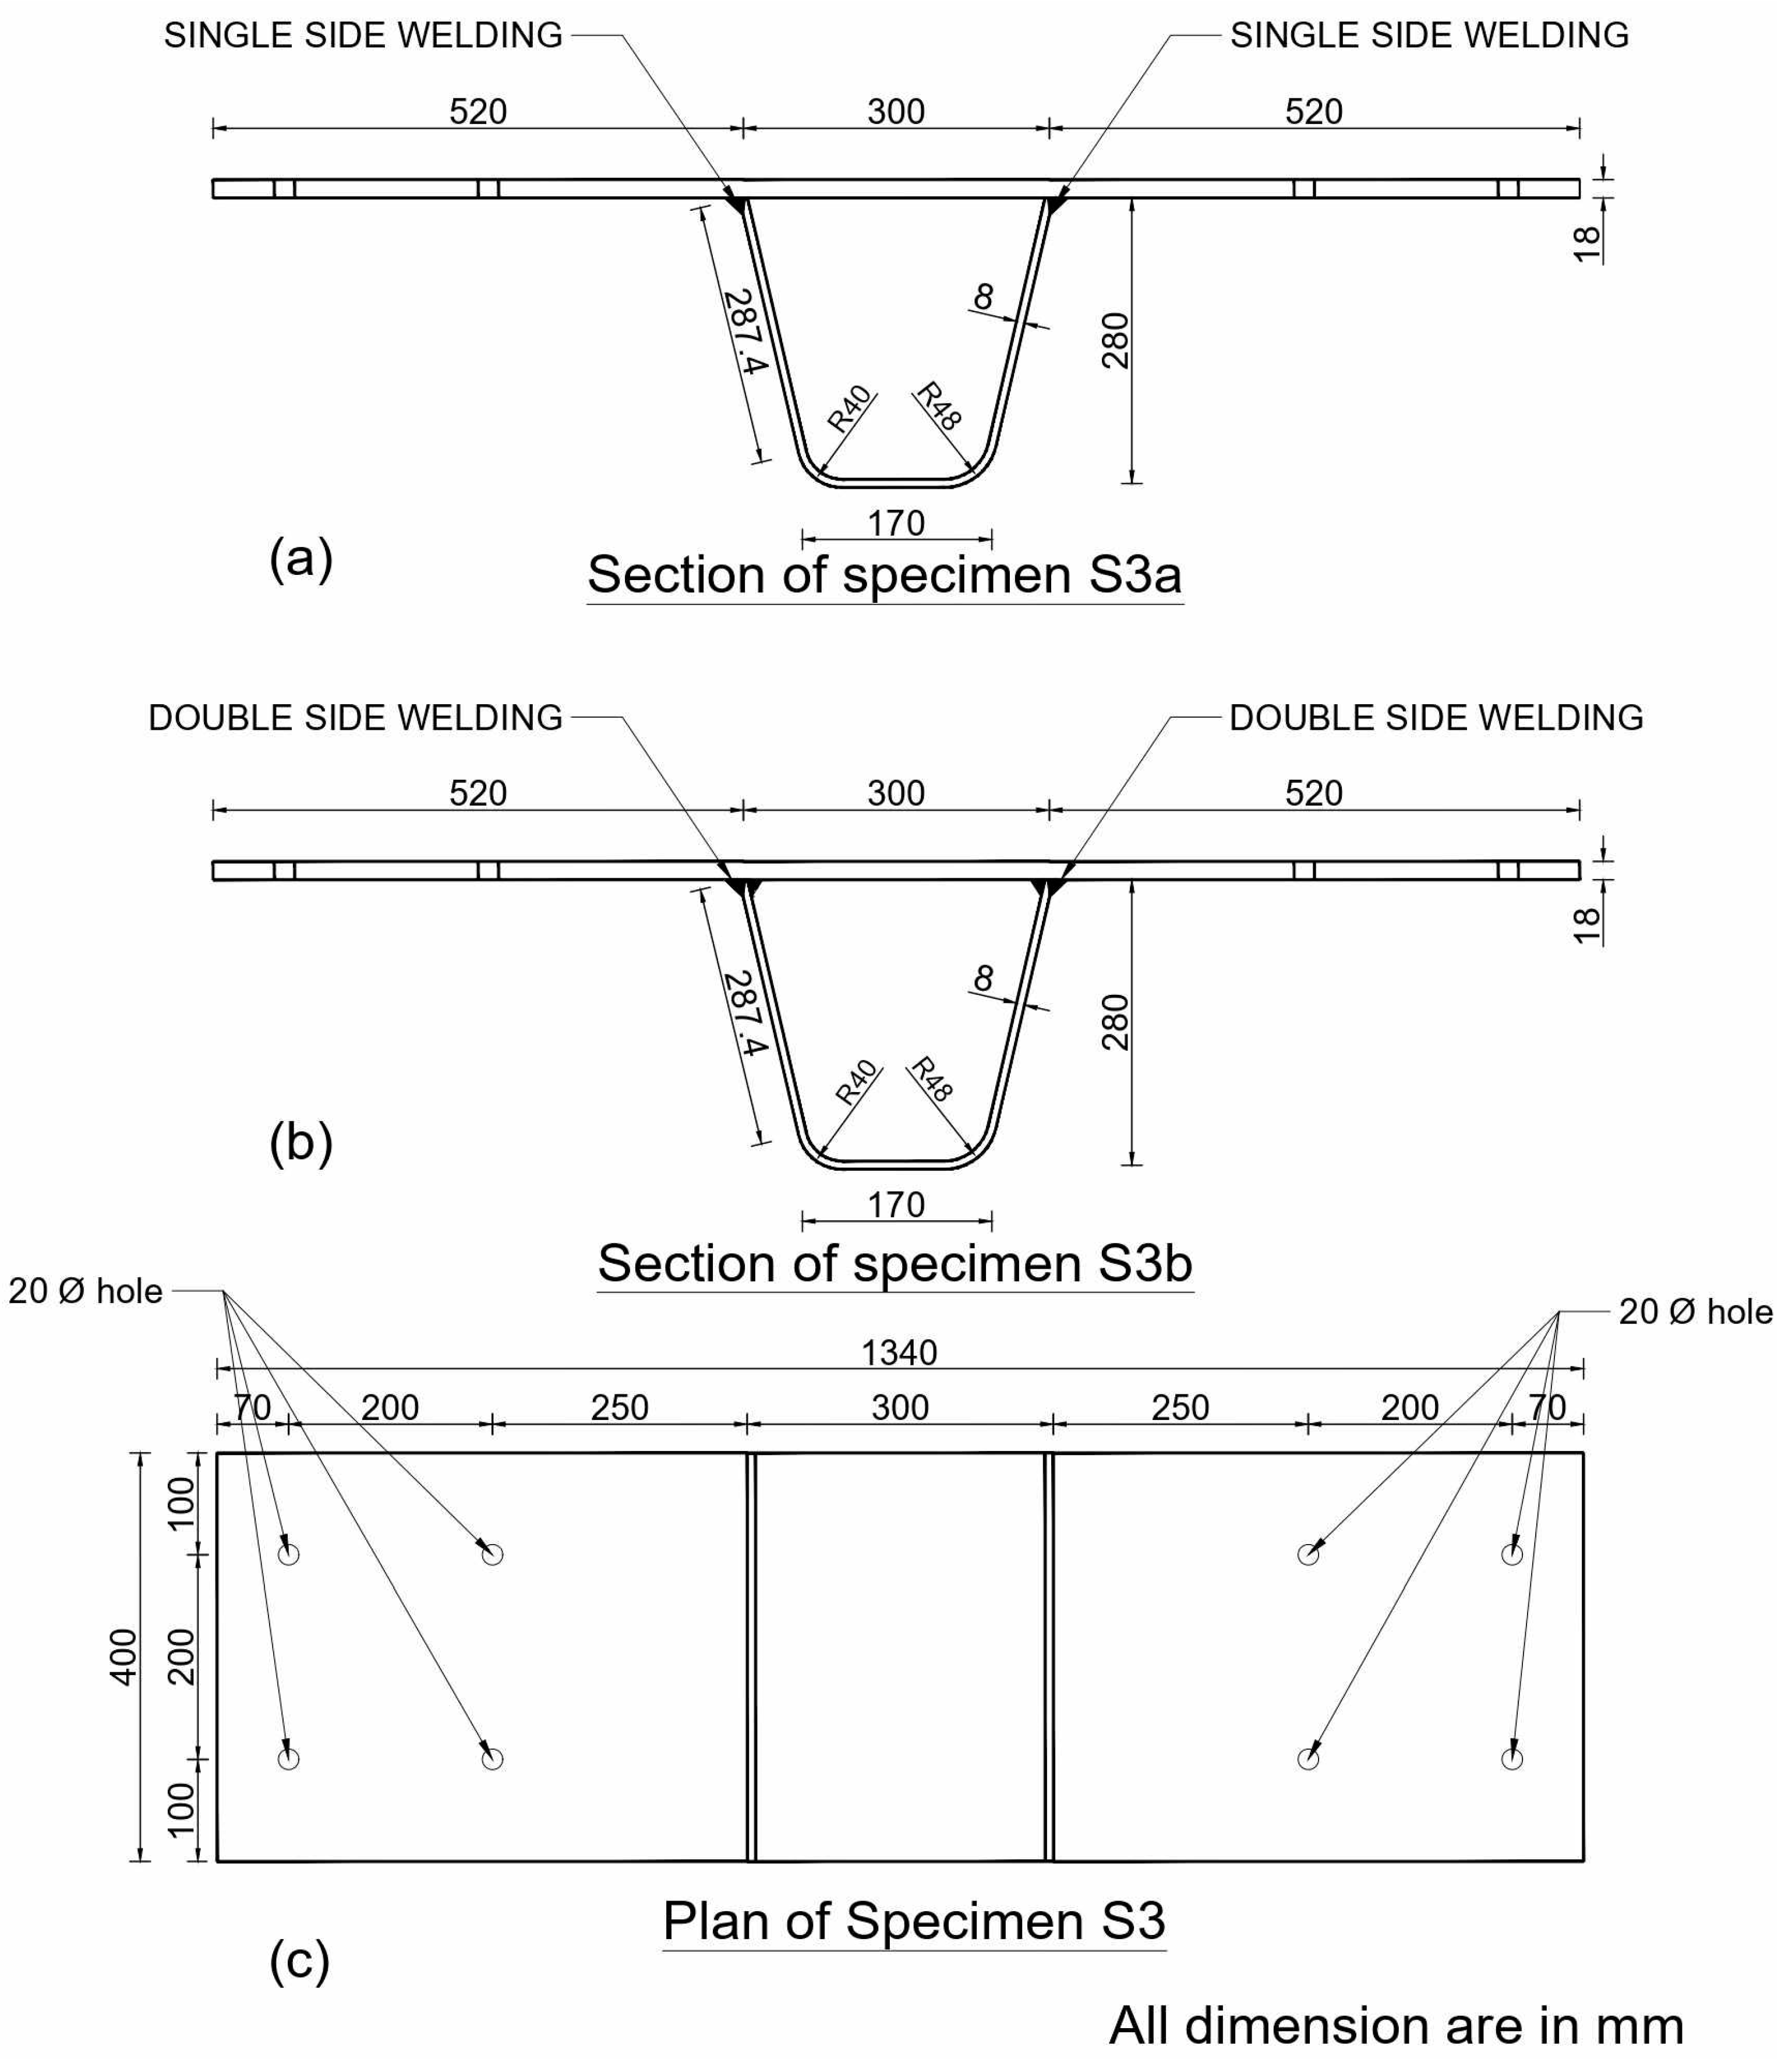
| Stress | Maximum Stress Values in MPa at the | |||
|---|---|---|---|---|
| Outer Weld Toe in Deck | Inner Weld Root/Toe in Deck | |||
| S3a | S3b | S3a | S3b | |
| Maximum Principal | 76.16 | 81.36 | 80.24 | 98.14 |
| S11 | 74.73 | 77.22 | 78.28 | 94.26 |
| Mises | 61.61 | 62.31 | 74.13 | 76.18 |
| Penetration | σhs (MPa) | σ1 (MPa) | σ2 (MPa) | σ3 (MPa) | σ4 (MPa) |
|---|---|---|---|---|---|
| 50% | 164.65 | 208.43 | 187.67 | 135.87 | 75.69 |
| 80% | 164.78 | 213. 50 | 189.88 | 134.12 | 75.34 |
| 100% | 165.29 | 215.89 | 190.12 | 133.51 | 74.47 |
| Double weld | 166.96 | 218.47 | 185.51 | 128.47 | 63.35 |
| Deck Thickness (mm) | Stress Concentration (MPa) at | |
|---|---|---|
| Deck | Rib | |
| 20 | 169.85 | 58.70 |
| 18 | 208.43 | 75.12 |
| 16 | 261.52 | 100.34 |
| 14 | 334.76 | 136.2 |
| 12 | 412.94 | 186.42 |
| DT | RT | WS | σhs (MPa) | Δσw (%) | Δσr | Δσd4 (%) | Δσd2 (%) | Δd (%) | Δσ (%) |
|---|---|---|---|---|---|---|---|---|---|
| 18 | 8 | 2 | 173.71 | 3.21 | 6.238 | 54.96 | 20.45 | 11.11 | 20.45 |
| 18 | 8 | 1 | 168.3 | 4.866 | 55.16 | 21.35 | 11.11 | 21.35 | |
| 18 | 6 | 2 | 163.51 | 1.88 | 45.1 | 24.68 | 11.11 | 24.68 | |
| 18 | 6 | 1 | 160.49 | 45.29 | 23.75 | 11.11 | 23.76 | ||
| 16 | 8 | 2 | 209.23 | 2.44 | 2.629 | 66.95 | 28.68 | 22.22 | 54.96 |
| 16 | 8 | 1 | 204.24 | 2.830 | 65.72 | 27.86 | 22.22 | 55.17 | |
| 16 | 6 | 2 | 203.87 | 2.64 | 62.69 | 16.37 | 22.22 | 45.10 | |
| 16 | 6 | 1 | 198.62 | 65.72 | 17.4 | 22.22 | 45.29 | ||
| 14 | 8 | 2 | 269.18 | 3.07 | 13.454 | 29.77 | 33.33 | 101.09 | |
| 14 | 8 | 1 | 261.15 | 11.995 | 29.6 | 33.33 | 101.11 | ||
| 14 | 6 | 2 | 237.26 | 1.75 | 39.79 | 33.33 | 102.84 | ||
| 14 | 6 | 1 | 233.18 | 41.16 | 33.33 | 105.09 | |||
| 12 | 8 | 2 | 349.32 | 3.21 | 5.322 | ||||
| 12 | 8 | 1 | 338.46 | 2.828 | |||||
| 12 | 6 | 2 | 331.67 | 0.77 | |||||
| 12 | 6 | 1 | 329.15 |
| Connection | Stress | Stress Values in (MPa) Inner Side | Stress Values in (MPa) Outer Side | ||||||
|---|---|---|---|---|---|---|---|---|---|
| Value | Mises | S11 | S33 | S13 | Mises | S11 | S33 | S13 | |
| Double welded | Max | 27.24 | 8.27 | 5.42 | 15.51 | 19.03 | 8.99 | 6.17 | 9.85 |
| Min | 8.89 | −12.12 | −22.44 | −15.51 | 7.16 | −18.06 | −19.17 | −9.85 | |
| Single welded | Max | 35.38 | 14.28 | 8.89 | 16.22 | 23.45 | 8.96 | 7.04 | 8.70 |
| Min | 18.45 | −19.53 | −28.24 | −16.22 | 6.45 | −16.48 | −26.05 | −8.70 | |
| Max Stresses | Stress for Double Tyre Loading (MPa) at | Stress for Single Tyre Loading (MPa) at | ||||||
|---|---|---|---|---|---|---|---|---|
| 1 | 2 | 3 | 4 | 1 | 2 | 3 | 4 | |
| S11(−ve) | −51.27 | −55.23 | −55.40 | −42.58 | −41.43 | −46.10 | −46.30 | −43.12 |
| S11(+ve) | 23.12 | 25.19 | 22.04 | 12.78 | 17.91 | 19.36 | 15.94 | 9.18 |
| S33(−ve) | −46.85 | −45.63 | −47.44 | −45.50 | −35.06 | −34.13 | −35.39 | −33.82 |
| S33(+ve) | 14.90 | 15.32 | 14.54 | 11.14 | 11.17 | 11.43 | 10.48 | 7.87 |
| Mises | 42.74 | 46.04 | 48.83 | 39.42 | 36.29 | 39.12 | 37.53 | 35.11 |
| Stresses | Stress (MPa) at | Stress (MPa) at | ||
|---|---|---|---|---|
| 1 | 2 | 3 | 4 | |
| S11(−ve) | 32.73 | 31.09 | 39.89 | 28.76 |
| S11(+ve) | 31.56 | 33.47 | 29.75 | 15.38 |
| S33(−ve) | 10.38 | 11.97 | 67.18 | 67.97 |
| S33(+ve) | 19.87 | 19.76 | 17.38 | 17.38 |
| Mises | 66.41 | 66.23 | 76.71 | 62.17 |
Disclaimer/Publisher’s Note: The statements, opinions and data contained in all publications are solely those of the individual author(s) and contributor(s) and not of MDPI and/or the editor(s). MDPI and/or the editor(s) disclaim responsibility for any injury to people or property resulting from any ideas, methods, instructions or products referred to in the content. |
© 2024 by the authors. Licensee MDPI, Basel, Switzerland. This article is an open access article distributed under the terms and conditions of the Creative Commons Attribution (CC BY) license (https://creativecommons.org/licenses/by/4.0/).
Share and Cite
KC, D.; Dahal, B.K.; Dangi, H. Methods to Increase Fatigue Life at Rib to Deck Connection in Orthotropic Steel Bridge Decks. CivilEng 2024, 5, 288-306. https://doi.org/10.3390/civileng5010015
KC D, Dahal BK, Dangi H. Methods to Increase Fatigue Life at Rib to Deck Connection in Orthotropic Steel Bridge Decks. CivilEng. 2024; 5(1):288-306. https://doi.org/10.3390/civileng5010015
Chicago/Turabian StyleKC, Diwakar, Bhim Kumar Dahal, and Harish Dangi. 2024. "Methods to Increase Fatigue Life at Rib to Deck Connection in Orthotropic Steel Bridge Decks" CivilEng 5, no. 1: 288-306. https://doi.org/10.3390/civileng5010015