
Map** Single Nucleotide Polymorphism Markers Associated with the Pre-Flowering Morphological Performance of Fenugreek under Different Levels of Salt Stress
 , and
, and
Abstract
:1. Introduction
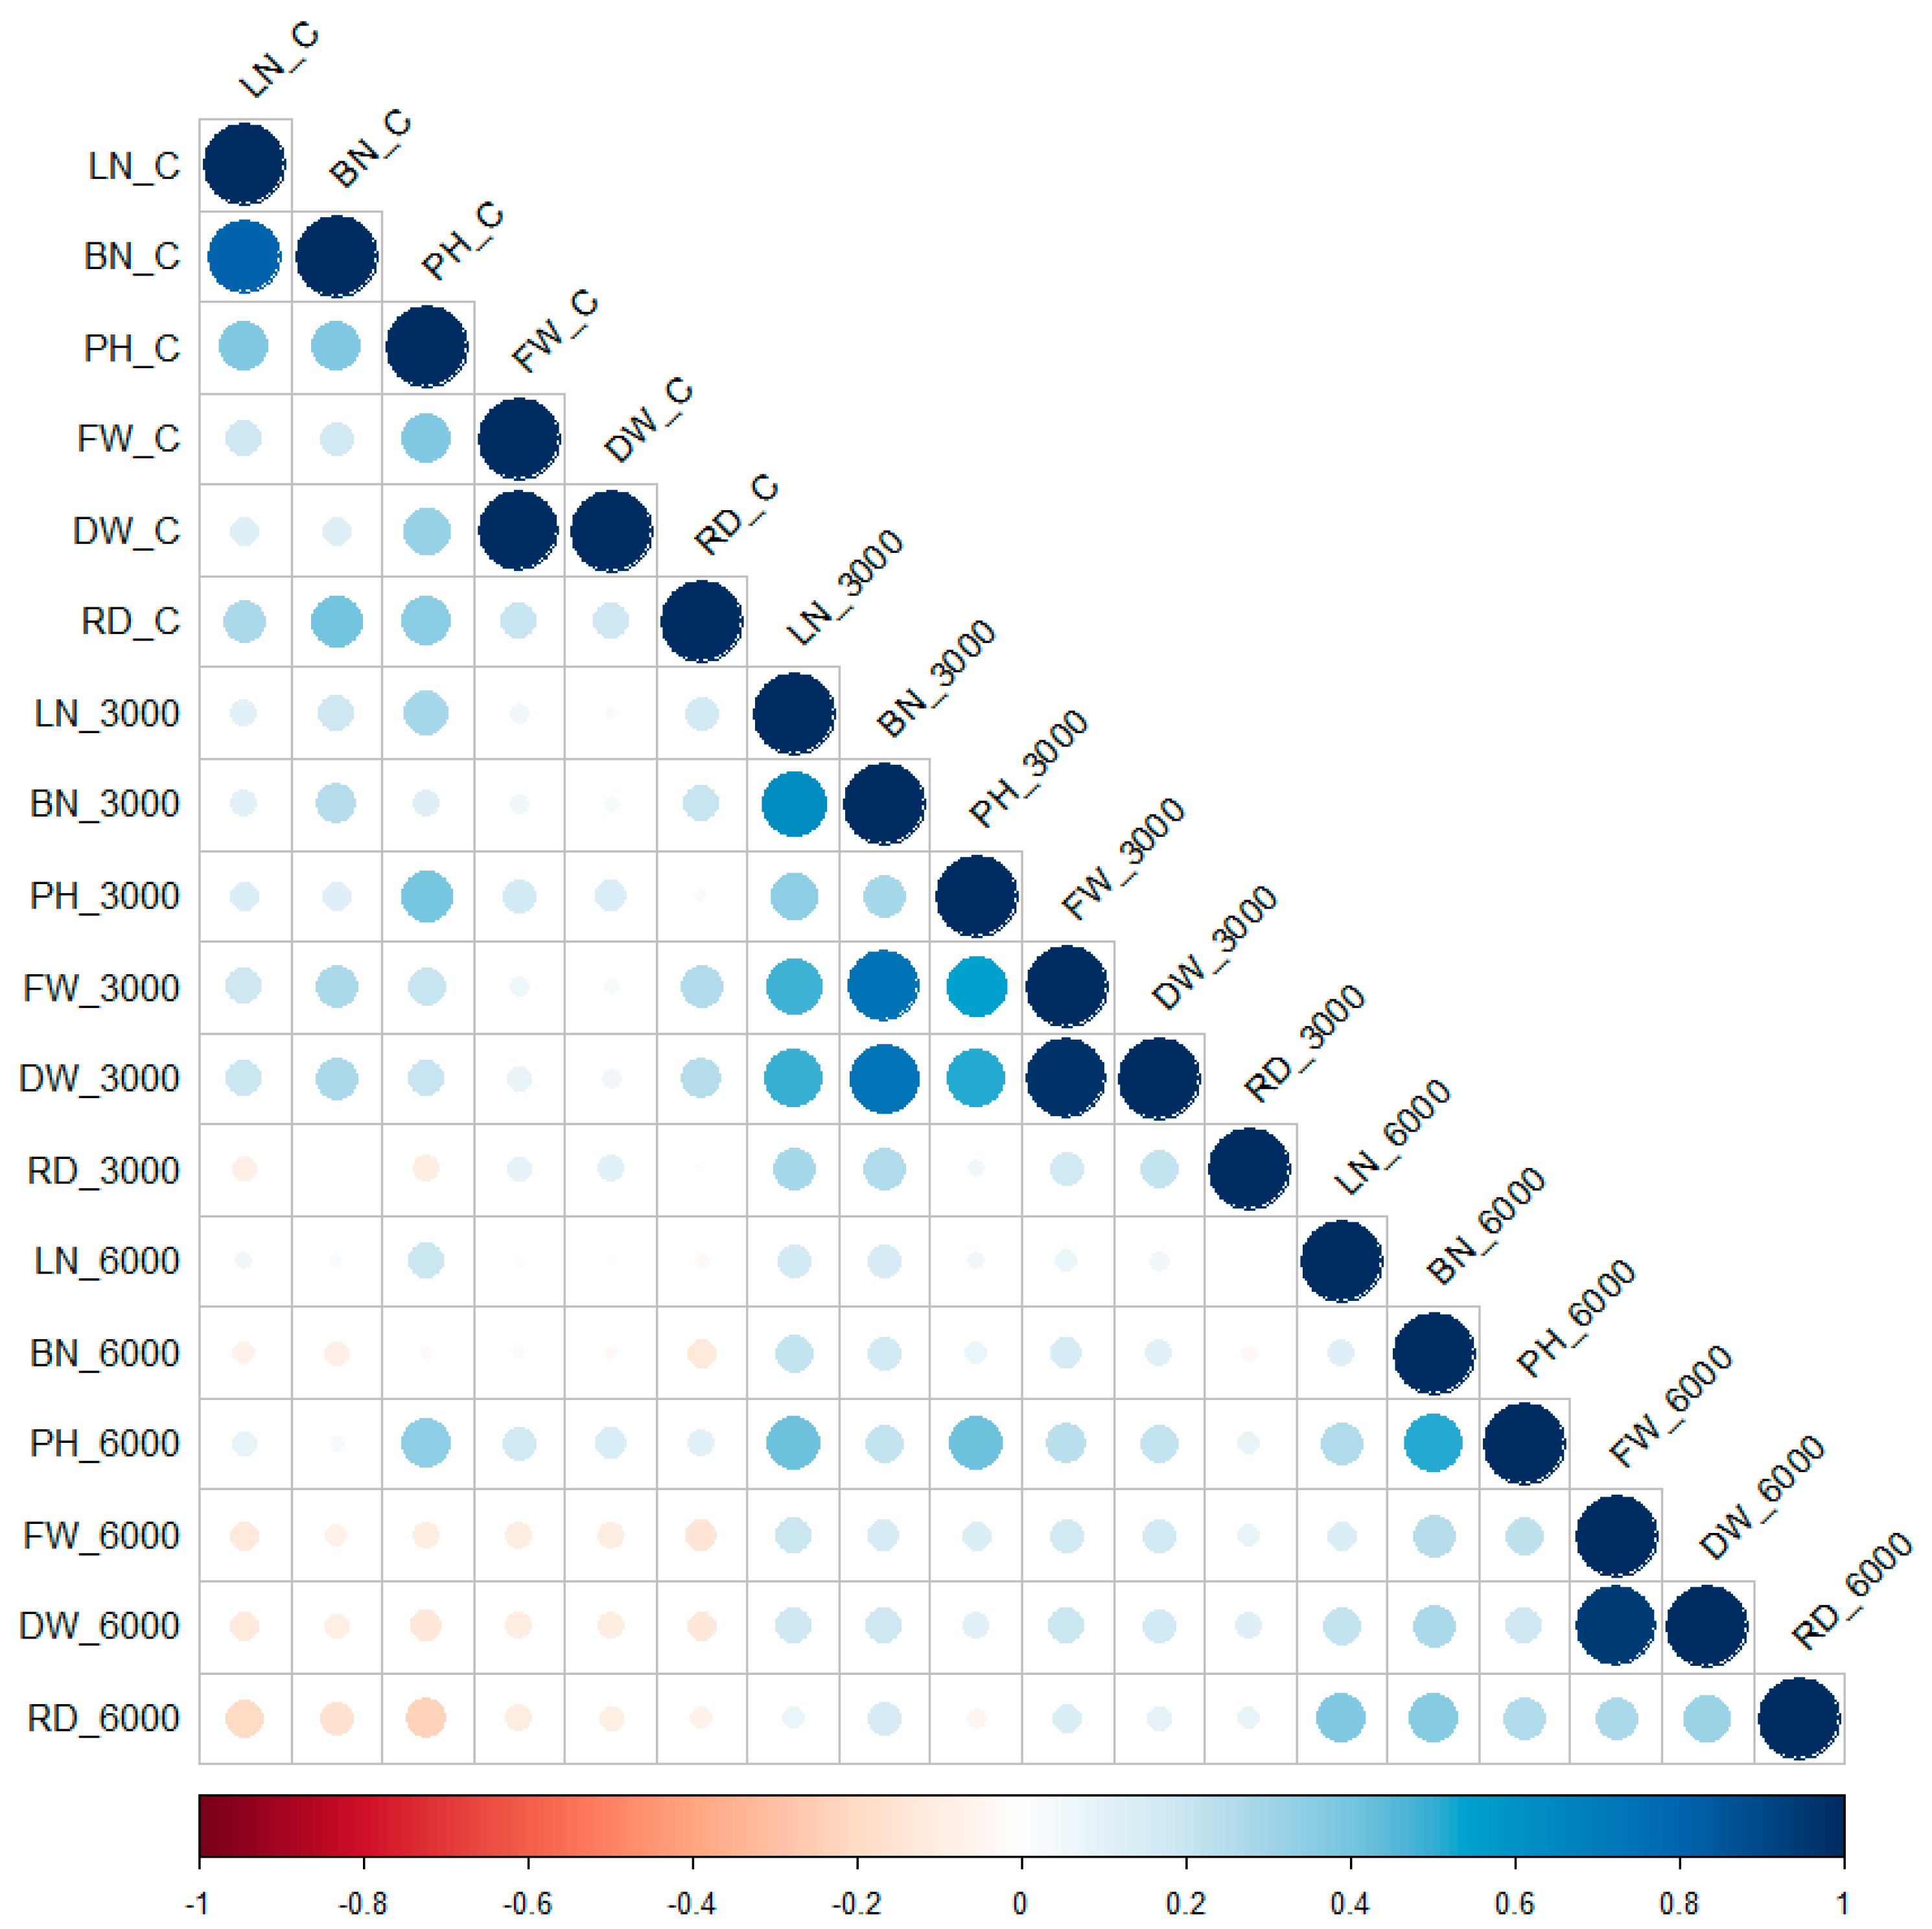
2. Results
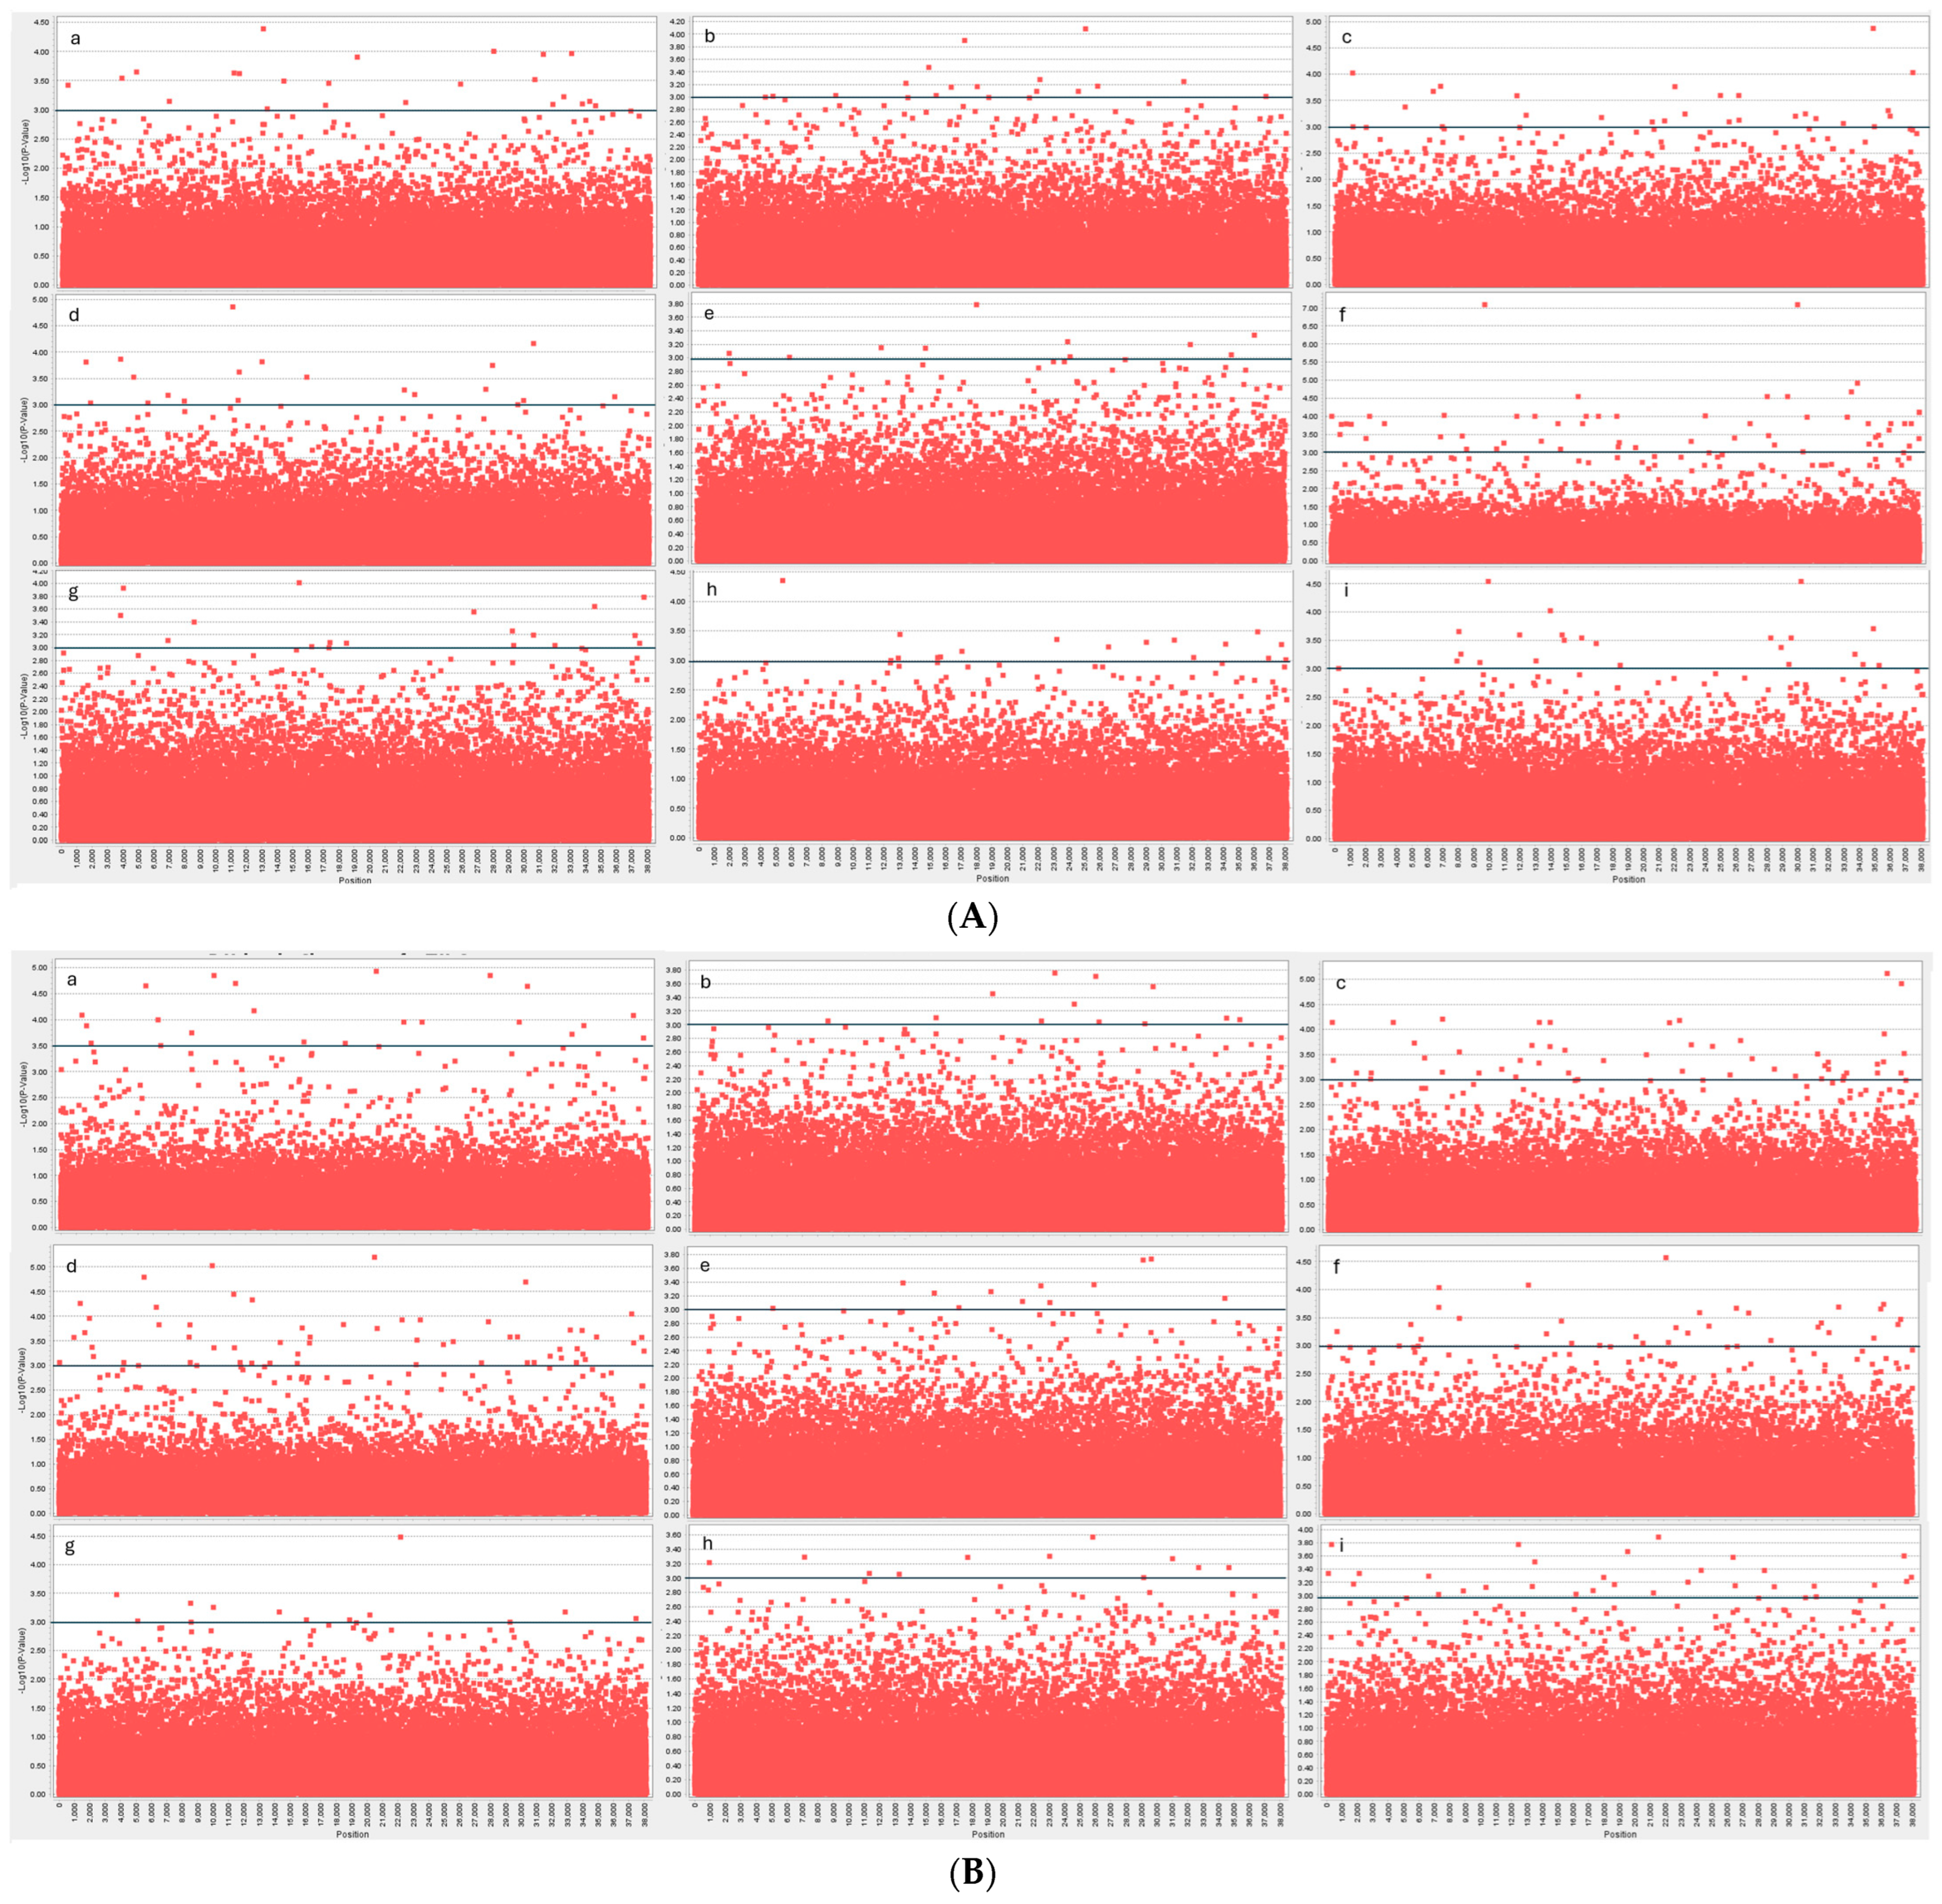
Association Map**
3. Discussion
4. Conclusions
5. Materials and Methods
5.1. Plant Material and Experimental Design
5.2. Phenotypic Measurements
5.3. Statistical Analysis
5.4. SNP Data and Map**
Supplementary Materials
Author Contributions
Funding
Data Availability Statement
Conflicts of Interest
References
- Kumar, M.; Prasad, M.; Arya, R. Grain yield and quality improvement in fenugreek. A review. Forage Res. 2013, 39, 1–9. [Google Scholar]
- Sarwar, S.; Hanif, M.A.; Ayub, M.A.; Boakye, Y.D.; Agyare, C. Fenugreek, in Medicinal Plants of South Asia; Elsevier: Amsterdam, The Netherlands, 2020; pp. 257–271. [Google Scholar]
- Amiri, H.; Banakar, M.H.; Ranjbar, G.H.; Ardakani, M.R.S.; Omidvari, M. Exogenous application of spermidine and methyl jasmonate can mitigate salt stress in fenugreek (Trigonella foenum-graecum L.). Ind. Crop. Prod. 2023, 199, 116826. [Google Scholar] [CrossRef]
- Petropoulos, G.A. Fenugreek: The Genus Trigonella; CRC Press: Boca Raton, FL, USA, 2002. [Google Scholar]
- Chaudhary, S.; Chaudhary, P.S.; Chikara, S.K.; Sharma, M.C.; Iriti, M. Review on fenugreek (Trigonella foenum-graecum L.) and its important secondary metabolite diosgenin. Not. Bot. Horti Agrobot. Cluj-Napoca 2018, 46, 22–31. [Google Scholar] [CrossRef]
- Maloo, S.; Sharma, R.; Soan, H. SSR Based Genetic Diversity Analysis in Fenugreek (Trigonella foenum-graecum L.) Genotypes. Legume Res.-Int. J. 2023, 46, 307–311. [Google Scholar] [CrossRef]
- Branch, S. Fenugreek (Trigonella foenum-graecum L.) as a valuable medicinal plant. Int. J. Adv. Biol. Biomed. Res. 2013, 1, 922–931. [Google Scholar]
- Dar, T.A.; Uddin, M. Fenugreek: A Miraculous Medicinal Herb. J. Complement. Med. Alt. Healthc. 2018, 7, 1–3. [Google Scholar] [CrossRef]
- Gleick, P.H. A look at twenty-first century water resources development. Water Int. 2000, 25, 127–138. [Google Scholar] [CrossRef]
- Mohanavelu, A.; Naganna, S.R.; Al-Ansari, N. Irrigation induced salinity and sodicity hazards on soil and groundwater: An overview of its causes, impacts and mitigation strategies. Agriculture 2021, 11, 983. [Google Scholar] [CrossRef]
- Ghorbanpour, A.; Mami, Y.; Ashournezhad, M.; Abri, F.; Amani, M. Effect of salinity and drought stress on germination of fenugreek. Afr. J. Agric. 2011, 6, 5529–5532. [Google Scholar] [CrossRef]
- Tuncturk, R. Salinity exposure modifies nutrient concentrations in fenugreek (Trigonella foenum graecum L.). Afr. J. Agric. Res. 2011, 6, 3685–3690. [Google Scholar]
- Belmecheri-Cherifi, H.; Albacete, A.; Martínez-Andújar, C.; Pérez-Alfocea, F.; Abrous-Belbachir, O. The growth impairment of salinized fenugreek (Trigonella foenum-graecum L.) plants is associated to changes in the hormonal balance. J. Plant Physiol. 2019, 232, 311–319. [Google Scholar] [CrossRef] [PubMed]
- Zia-ur-Rehman, M.; Anayatullah, S.; Irfan, E.; Hussain, S.M.; Rizwan, M.; Sohail, M.I.; Jafir, M.; Ahmad, T.; Usman, M.; Alharby, H.F. Nanoparticles assisted regulation of oxidative stress and antioxidant enzyme system in plants under salt stress: A review. Chemosphere 2022, 314, 137649. [Google Scholar] [CrossRef] [PubMed]
- Castillo, E.G.; Tuong, T.P.; Ismail, A.M.; Inubushi, K. Response to salinity in rice: Comparative effects of osmotic and ionic stresses. Plant Prod. Sci. 2007, 10, 159–170. [Google Scholar] [CrossRef]
- Rengasamy, P. Soil processes affecting crop production in salt-affected soils. Funct. Plant Biol. 2010, 37, 613–620. [Google Scholar] [CrossRef]
- Rasool, S.; Hameed, A.; Azooz, M.M.; Siddiqi, T.O.; Ahmad, P. Salt stress: Causes, types and responses of plants. In Ecophysiology and Responses of Plants under Salt Stress; Springer: New York, NY, USA, 2013; pp. 1–24. [Google Scholar]
- Chourasia, K.N.; Lal, M.K.; Tiwari, R.K.; Dev, D.; Kardile, H.B.; Patil, V.U.; Kumar, A.; Vanishree, G.; Kumar, D.; Bhardwaj, V.; et al. Salinity stress in potato: Understanding physiological, biochemical and molecular responses. Life 2021, 11, 545. [Google Scholar] [CrossRef] [PubMed]
- Asaadi, A.M. Investigation of salinity stress on seed germination of Trigonella foenum-graecum. Res. J. Biol. Sci. 2009, 4, 1152–1155. [Google Scholar]
- Chaves, M.M.; Flexas, J.; Pinheiro, C. Photosynthesis under drought and salt stress: Regulation mechanisms from whole plant to cell. Ann. Bot. 2009, 103, 551–560. [Google Scholar] [CrossRef] [PubMed]
- de Oliveira, A.B.; Alencar, N.L.M.; Gomes-Filho, E. Comparison between the water and salt stress effects on plant growth and development. Responses Org. Water Stress 2013, 4, 67–94. [Google Scholar]
- Negrão, S.; Schmöckel, S.; Tester, M. Evaluating physiological responses of plants to salinity stress. Ann. Bot. 2017, 119, 1–11. [Google Scholar] [CrossRef]
- Munns, R.; Tester, M. Mechanisms of salinity tolerance. Annu. Rev. Plant Biol. 2008, 59, 651–681. [Google Scholar] [CrossRef]
- Roy, S.J.; Negrão, S.; Tester, M. Salt resistant crop plants. Curr. Opin. Biotechnol. 2014, 26, 115–124. [Google Scholar] [CrossRef] [PubMed]
- El-Soda, M.; Sarhan, M.S. From gene map** to gene editing, a guide from the Arabidopsis research. Annu. Plant Rev. Online 2021, 4, 1–32. [Google Scholar]
- El-Soda, M.; Malosetti, M.; Zwaan, B.J.; Koornneef, M.; Aarts, M.G. Genotype× environment interaction QTL map** in plants: Lessons from Arabidopsis. Trends Plant Sci. 2014, 19, 390–398. [Google Scholar] [CrossRef] [PubMed]
- Abd El-Wahab, M.M.; Abdel-Lattif, H.; Emara, K.S.; Mosalam, M.; Aljabri, M.; El-Soda, M. Identifying SNP markers associated with distinctness, uniformity, and stability testing in Egyptian fenugreek genotypes. PLoS ONE 2023, 18, e0291527. [Google Scholar] [CrossRef] [PubMed]
- Tuberosa, R. Phenoty** for drought tolerance of crops in the genomics era. Front. Physiol. 2012, 3, 347. [Google Scholar] [CrossRef]
- Abd El-Wahab, M.M.H.; Aljabri, M.; Sarhan, M.S.; Osman, G.; Wang, S.; Mabrouk, M.; El-Shabrawi, H.M.; Gabr, A.M.M.; Abd El-Haliem, A.M.; O’Sullivan, D.M.; et al. High-density SNP-based association map** of seed traits in fenugreek reveals homology with clover. Genes 2020, 11, 893. [Google Scholar] [CrossRef]
- Ahmadi, N. Genetic Bases of Complex Traits Complex Traits: From Quantitative Trait Loci to Prediction, in Genomic Prediction of Complex Traits: Methods and Protocols; Springer: Berlin/Heidelberg, Germany, 2022; pp. 1–44. [Google Scholar]
- Kulwal, P.L.; Singh, R. Association map** in plants. In Crop Breeding: Genetic Improvement Methods; Humana: New York, NY, USA, 2021; pp. 105–117. [Google Scholar]
- Holm, S. A simple sequentially rejective multiple test procedure. Scand. J. Stat. 1979, 6, 65–70. [Google Scholar]
- Benjamini, Y.; Hochberg, Y. Controlling the false discovery rate: A practical and powerful approach to multiple testing. J. R. Stat. Soc. Ser. B 1995, 57, 289–300. [Google Scholar] [CrossRef]
- Akhatar, J.; Goyal, A.; Kaur, N.; Atri, C.; Mittal, M.; Singh, M.P.; Kaur, R.; Rialch, I.; Banga, S.S. Genome wide association analyses to understand genetic basis of flowering and plant height under three levels of nitrogen application in Brassica juncea (L.) Czern Coss. Sci. Rep. 2021, 11, 4278. [Google Scholar] [CrossRef]
- El-Soda, M.; Aljabri, M. Genome-wide association map** of grain metal accumulation in wheat. Genes 2022, 13, 1052. [Google Scholar] [CrossRef]
- Upadhyay, P.; Gupta, M.; Sra, S.K.; Sharda, R.; Sharma, S.; Sardana, V.K.; Akhatar, J.; Kaur, G. Genome wide association studies for acid phosphatase activity at varying phosphorous levels in Brassica juncea L. Front. Plant Sci. 2022, 13, 1056028. [Google Scholar] [CrossRef] [PubMed]
- Coolen, S.; Van Dijen, M.; Van Pelt, J.A.; Van Loon, J.J.; Pieterse, C.M.; Van Wees, S.C. Genome-wide association study reveals WRKY42 as a novel plant transcription factor that influences oviposition preference of Pieris butterflies. J. Exp. Bot. 2023, 74, 1690–1704. [Google Scholar] [CrossRef] [PubMed]
- Ahari, D.S.; Kashi, A.K.; Hassandokht, M.R.; Amri, A.; Alizadeh, K. Assessment of drought tolerance in Iranian fenugreek landraces. J. Food Agric. Environ. 2009, 7, 414–419. [Google Scholar]
- Mickky, B.M.; Abbas, M.A.; Sameh, N.M. Morpho-physiological status of fenugreek seedlings under NaCl stress. J. King Saud Univ.-Sci. 2019, 31, 1276–1282. [Google Scholar] [CrossRef]
- Elleuch, A.; Chaâbene, Z.; Grubb, D.C.; Drira, N.; Mejdoub, H.; Khemakhem, B. Morphological and biochemical behavior of fenugreek (Trigonella foenum-graecum) under copper stress. Ecotoxicol. Environ. Saf. 2013, 98, 46–53. [Google Scholar] [CrossRef]
- Acosta-Motos, J.R.; Ortuño, M.F.; Bernal-Vicente, A.; Diaz-Vivancos, P.; Sanchez-Blanco, M.J.; Hernandez, J.A. Plant responses to salt stress: Adaptive mechanisms. Agronomy 2017, 7, 18. [Google Scholar] [CrossRef]
- Lekklar, C.; Pongpanich, M.; Suriya-Arunroj, D.; Chinpongpanich, A.; Tsai, H.; Comai, L.; Chadchawan, S.; Buaboocha, T. Genome-wide association study for salinity tolerance at the flowering stage in a panel of rice accessions from Thailand. BMC Genom. 2019, 20, 1–18. [Google Scholar] [CrossRef] [PubMed]
- Liu, X.P.; Hawkins, C.; Peel, M.D.; Yu, L.X. Genetic loci associated with salt tolerance in advanced breeding populations of tetraploid alfalfa using genome-wide association studies. Plant Genome 2019, 12, 180026. [Google Scholar] [CrossRef]
- Yamazaki, K.; Ishimori, M.; Kajiya-Kanegae, H.; Takanashi, H.; Fujimoto, M.; Yoneda, J.-I.; Yano, K.; Koshiba, T.; Tanaka, R.; Iwata, H.; et al. Effect of salt tolerance on biomass production in a large population of sorghum accessions. Breed. Sci. 2020, 70, 167–175. [Google Scholar] [CrossRef]
- Arif, Y.; Singh, P.; Siddiqui, H.; Bajguz, A.; Hayat, S. Salinity induced physiological and biochemical changes in plants: An omic approach towards salt stress tolerance. Plant Physiol. Biochem. 2020, 156, 64–77. [Google Scholar] [CrossRef]
- Bernstein, N. Plants and Salt: Plant Response and Adaptations to Salinity, in Model Ecosystems in Extreme Environments; Elsevier: Amsterdam, The Netherlands, 2019; pp. 101–112. [Google Scholar]
- Silveira, J.A.G.; Araújo, S.A.M.; Lima, J.P.M.S.; Viégas, R.A. Roots and leaves display contrasting osmotic adjustment mechanisms in response to NaCl-salinity in Atriplex nummularia. Environ. Exp. Bot. 2009, 66, 1–8. [Google Scholar] [CrossRef]
- ** in model and non-model species. PLoS ONE 2012, 7, e37135. [Google Scholar] [CrossRef]
- Bradbury, P.J.; Zhang, Z.; Kroon, D.E.; Casstevens, T.M.; Ramdoss, Y.; Buckler, E.S. TASSEL: Software for association map** of complex traits in diverse samples. Bioinformatics 2007, 23, 2633–2635. [Google Scholar] [CrossRef]


| Traits (Unit) | Control | 3000 ppm | 6000 ppm | MM | ||||||||||||||
|---|---|---|---|---|---|---|---|---|---|---|---|---|---|---|---|---|---|---|
| Min | Max | Avg | SE | H2 | Min | Max | Avg | SE | H2 | Min | Max | Avg | SE | H2 | T | G | GxT | |
| LN | 19.85 | 22.00 | 20.93 | 0.49 | 0.87 | 26.80 | 29.03 | 27.92 | 0.52 | 0.69 | 27.28 | 29.50 | 28.39 | 0.52 | 0.51 | 0.00 | 0.00 | 0.00 |
| BN | 1.78 | 2.27 | 2.03 | 0.09 | 0.43 | 1.95 | 2.43 | 2.19 | 0.10 | 0.44 | 2.56 | 3.04 | 2.80 | 0.10 | 0.44 | 0.00 | 0.00 | 0.00 |
| PH (cm) | 15.52 | 16.40 | 15.96 | 0.22 | 0.78 | 15.78 | 16.71 | 16.25 | 0.24 | 0.55 | 15.78 | 16.71 | 16.25 | 0.24 | 0.52 | 0.04 | 0.00 | 0.00 |
| FW (g) | 1.05 | 1.49 | 1.27 | 0.11 | 0.56 | 0.86 | 1.33 | 1.08 | 0.12 | 0.67 | 0.87 | 1.32 | 1.09 | 0.12 | 0.52 | 0.50 | 0.00 | 0.00 |
| DW (g) | 0.32 | 0.81 | 0.56 | 0.13 | 0.49 | 0.37 | 0.90 | 0.63 | 0.13 | 0.46 | 0.70 | 1.20 | 0.95 | 0.13 | 0.42 | 0.08 | 0.00 | 0.00 |
| RD (cm) | 12.53 | 14.30 | 13.41 | 0.33 | 0.68 | 11.76 | 13.51 | 12.64 | 0.35 | 0.55 | 12.87 | 14.63 | 13.75 | 0.34 | 0.43 | 0.00 | 0.00 | 0.00 |
| Trait | Marker | −Log10 (p) | R2 | Allele | Effect |
|---|---|---|---|---|---|
| LN_C | dDocent_Contig_30812_276 | 4.0 | 0.16 | A(G) | −10.21 |
| LN_C | dDocent_Contig_45644_257 | 4.0 | 0.16 | A(C) | 9.21 |
| LN_3000 | dDocent_Contig_9350_202 | 4.1 | 0.20 | G(T) | −18.12 |
| LN_6000 | dDocent_Contig_31894_14 | 4.0 | 0.18 | C(T) | 16.03 |
| LN_6000 | dDocent_Contig_47529_298 | 4.9 | 0.22 | A(G) | −34.51 |
| BN_6000 | dDocent_Contig_1933_583 | 4.1 | 0.18 | A(G) | 6.25 |
| BN_6000 | dDocent_Contig_1933_593 | 4.1 | 0.18 | C(T) | −6.25 |
| BN_6000 | dDocent_Contig_29601_61 | 4.0 | 0.18 | C(T) | 6.73 |
| BN_6000 | dDocent_Contig_29746_105 | 4.0 | 0.23 | G(T) | 16.60 |
| BN_6000 | dDocent_Contig_29746_130 | 4.0 | 0.23 | C(G) | 16.60 |
| BN_6000 | dDocent_Contig_29746_136 | 4.0 | 0.23 | C(G) | 16.60 |
| BN_6000 | dDocent_Contig_29746_145 | 4.0 | 0.23 | C(G) | 16.60 |
| BN_6000 | dDocent_Contig_29746_24 | 4.0 | 0.23 | C(T) | 16.60 |
| BN_6000 | dDocent_Contig_29746_254 | 4.0 | 0.23 | C(G) | 16.60 |
| BN_6000 | dDocent_Contig_29746_281 | 4.0 | 0.23 | A(G) | 16.60 |
| BN_6000 | dDocent_Contig_29746_7 | 4.0 | 0.23 | A(G) | 16.60 |
| BN_6000 | dDocent_Contig_29746_96 | 4.0 | 0.23 | C(G) | 16.60 |
| BN_6000 | dDocent_Contig_6519_195 | 4.0 | 0.18 | C(T) | −5.39 |
| BN_6000 | dDocent_Contig_797_289 | 4.9 | 0.23 | A(G) | −8.46 |
| PH_C | dDocent_Contig_373_122 | 4.0 | 0.17 | C(T) | −3.69 |
| PH_3000 | dDocent_Contig_40266_46 | 4.4 | 0.21 | A(G) | 4.46 |
| PH_6000 | dDocent_Contig_6598_111 | 4.0 | 0.18 | G(T) | 4.61 |
| FW_6000 | dDocent_Contig_31699_109 | 4.1 | 0.18 | A(G) | 1.37 |
| FW_6000 | dDocent_Contig_31699_114 | 4.1 | 0.18 | C(G) | 1.37 |
| FW_6000 | dDocent_Contig_31699_37 | 4.1 | 0.18 | C(T) | 1.37 |
| FW_6000 | dDocent_Contig_31699_8 | 4.1 | 0.18 | A(G) | −1.37 |
| WC_C | dDocent_Contig_3179_151 | 4.8 | 0.21 | C(G) | −0.07 |
| RD_C | dDocent_Contig_53508_178 | 4.5 | 0.19 | A(T) | −2.11 |
| Trait | Marker | −Log10 (p) | R2 | Allele | Effect |
|---|---|---|---|---|---|
| FW/DW_C | dDocent_Contig_30841_53 | 4.2 | 0.17 | C(T) | 2.01 |
| 4 | 0.17 | C(T) | 4.22 | ||
| dDocent_Contig_31124_100 | 4.3 | 0.18 | C(T) | −1.88 | |
| 4.2 | 0.18 | C(T) | −3.98 | ||
| dDocent_Contig_31124_249 | 4.7 | 0.2 | A(G) | −1.98 | |
| 4.6 | 0.2 | A(G) | −4.25 | ||
| dDocent_Contig_31124_47 | 4.8 | 0.21 | A(T) | 2.19 | |
| 4.6 | 0.2 | A(T) | 4.64 | ||
| dDocent_Contig_35845_179 | 3.9 | 0.16 | A(G) | −1.93 | |
| 4 | 0.16 | A(G) | −4.19 | ||
| dDocent_Contig_35845_189 | 3.9 | 0.16 | A(G) | −1.93 | |
| 4 | 0.16 | A(G) | −4.19 | ||
| dDocent_Contig_36571_20 | 4 | 0.16 | A(T) | −0.12 | |
| 3.5 | 0.14 | A(T) | −0.37 | ||
| dDocent_Contig_43254_163 | 5.2 | 0.23 | C(T) | −2.56 | |
| 4.9 | 0.22 | C(T) | −5.36 | ||
| dDocent_Contig_43254_80 | 5 | 0.22 | G(T) | −2.51 | |
| 4.8 | 0.21 | G(T) | −5.3 | ||
| dDocent_Contig_49746_342 | 4 | 0.21 | A(G) | −4.6 | |
| 4.1 | 0.22 | A(G) | −10.2 | ||
| dDocent_Contig_5198_91 | 4.4 | 0.19 | A(G) | −2.08 | |
| 4.7 | 0.2 | A(G) | −4.66 | ||
| dDocent_Contig_57115_226 | 3.9 | 0.2 | A(T) | −4.9 | |
| 4.9 | 0.26 | A(T) | −13.6 | ||
| dDocent_Contig_6156_243 | 3.6 | 0.14 | A(G) | −1.32 | |
| 4 | 0.16 | A(G) | −3.04 | ||
| dDocent_Contig_63002_15 | 4.3 | 0.22 | C(T) | −4.90 | |
| 4.1 | 0.22 | C(T) | −10.30 | ||
| FW/DW_3000 | dDocent_Contig_35199_79 | 3 | 0.1323 | G(T) | −0.20 |
| 3 | 0.13144 | G(T) | −0.34 | ||
| dDocent_Contig_64264_238 | 3.7 | 0.17492 | A(G) | −0.23 | |
| 3 | 0.1342 | A(G) | −0.33 | ||
| dDocent_Contig_64858_150 | 3.3 | 0.1699 | C(G) | −0.24 | |
| 3.5 | 0.18123 | C(G) | −0.43 | ||
| dDocent_Contig_85747_243 | 3.7 | 0.1758 | C(T) | −0.24 | |
| 3.6 | 0.1653 | C(T) | −0.38 | ||
| dDocent_Contig_9501_294 | 3.2 | 0.14269 | A(C) | 0.26 | |
| 3.1 | 0.13883 | A(C) | 0.43 | ||
| dDocent_Contig_95794_210 | 3.4 | 0.15403 | A(C) | 0.46 | |
| 3.7 | 0.17421 | A(C) | 0.82 | ||
| FW/DW_6000 | dDocent_Contig_61819_183 | 3.3 | 0.16 | C(T) | −0.35 |
| 4.2 | 0.22 | C(T) | −0.71 | ||
| dDocent_Contig_58866_61 | 4 | 0.18 | C(T) | 0.36 | |
| 4.2 | 0.19 | C(T) | 0.65 | ||
| dDocent_Contig_39980_178 | 4.6 | 0.21 | A(G) | −0.52 | |
| 4.1 | 0.18 | A(G) | −0.87 | ||
| dDocent_Contig_10975_317 | 3.7 | 0.16 | G(T) | 0.71 | |
| 5.1 | 0.24 | G(T) | 1.52 | ||
| dDocent_Contig_12419_342 | 3.4 | 0.14 | A(T) | −0.69 | |
| 4.9 | 0.23 | A(T) | −1.54 | ||
| dDocent_Contig_31895_105 | 4.1 | 0.18 | C(T) | −0.73 | |
| 3.7 | 0.16 | C(T) | −1.2 |
Disclaimer/Publisher’s Note: The statements, opinions and data contained in all publications are solely those of the individual author(s) and contributor(s) and not of MDPI and/or the editor(s). MDPI and/or the editor(s) disclaim responsibility for any injury to people or property resulting from any ideas, methods, instructions or products referred to in the content. |
© 2024 by the authors. Licensee MDPI, Basel, Switzerland. This article is an open access article distributed under the terms and conditions of the Creative Commons Attribution (CC BY) license (https://creativecommons.org/licenses/by/4.0/).
Share and Cite
Dobeie, A.M.; Nemr, R.A.; Abd El-Wahab, M.M.H.; Shahba, M.; El-Soda, M. Map** Single Nucleotide Polymorphism Markers Associated with the Pre-Flowering Morphological Performance of Fenugreek under Different Levels of Salt Stress. Stresses 2024, 4, 282-292. https://doi.org/10.3390/stresses4020017
Dobeie AM, Nemr RA, Abd El-Wahab MMH, Shahba M, El-Soda M. Map** Single Nucleotide Polymorphism Markers Associated with the Pre-Flowering Morphological Performance of Fenugreek under Different Levels of Salt Stress. Stresses. 2024; 4(2):282-292. https://doi.org/10.3390/stresses4020017
Chicago/Turabian StyleDobeie, Amani Mahmoud, Rahma A. Nemr, Mustafa M. H. Abd El-Wahab, Mohamed Shahba, and Mohamed El-Soda. 2024. "Map** Single Nucleotide Polymorphism Markers Associated with the Pre-Flowering Morphological Performance of Fenugreek under Different Levels of Salt Stress" Stresses 4, no. 2: 282-292. https://doi.org/10.3390/stresses4020017