1. Introduction
As the ecological transition zone of montane coniferous forests and alpine meadows, the alpine tree line is extremely sensitive to environmental factors such as temperature, precipitation, and soil, which has great ecological vulnerability [
1]. With the change of environmental climatic factors, the vegetation distribution show a changing or narrowing position of the alpine tree line [
2,
3]. The Fifth Assessment Report (AR5) of the Intergovernmental Panel on Climate Change (IPCC) noted that recent climate changes have generated widespread impacts on human and natural systems. The atmosphere and oceans are getting warmer, and the amounts of snow and ice are decreasing. Many terrestrial species have shifted their geographic ranges, abundances, and species interactions in response to ongoing climate change [
4]. As a “monitor” of climate change, the alpine tree line is sensitive to climate change and can help humans quickly understand the interaction between climate change and vegetation [
5,
6,
7]. In addition, the ecosystem is facing unprecedented pressure, which will restrict regional sustainable development in different regions. Consequently, it is one of the hotspots to study the influence of climate change by obtaining the elevation range of the alpine tree line. At the same time, strengthening the study of the alpine tree line is significant for the protection and sustainable development of Natural Heritage Sites.
Many researchers have carried out relevant studies on the alpine tree line related to the formation and restriction mechanisms, location fluctuations under climate change, vegetation community diversity patterns, and demarcation elevation identification. Some studies have taken the limitations of the alpine tree line formation as the entry point and used the experimental methods of physiology and ecology to conduct studies on temperature as the main controlling factors [
2,
8,
9,
10,
11,
12]. Precipitation, propagation limitation, carbon limitation, environmental stress, and external disturbances have been analyzed as the causes of formation for the alpine tree line [
3,
9,
12,
13,
14,
15,
16,
17]. The direct effects of climate change with stored terrestrial carbon include high temperatures, drought, and windstorms. The indirect effects include increasing risks of fires, pests, and disease outbreaks. It is projected that the rise in tree mortality will occur in many regions during the 21st century [
4]. The relationship between alpine tree line distribution and climate change has been analyzed by means of tree chronology methods such as tree rings, sporopollenin, and sediment magnetic susceptibility, paleontology, and isotope studies [
13,
18,
19]. The demarcation elevation and population structure are two important characteristics of the alpine tree line [
20,
21]. In addition, the alpine tree line was taken as an ecological transition, and the position changes of which were extracted. In the early stages, methods such as ecological field surveys [
11,
22,
23] and historical data collection and collation [
2,
24] were usually used to obtain the demarcation elevation of the alpine tree line. However, due to the influence of environmental factors such as topography and climate, long cycles, and the high cost of human and material resources, there are many areas that cannot be accessed by humans in high mountains, which limits the feasibility and the objectivity of the research. The validation sites in situ have certain regional limitations. The historical data cannot accurately reflect long-term climate change and the current influence of human activities on the alpine tree line. With the development of spatial information technology such as 3S (RS, remote sensing, GNSS, global navigation satellite system, GIS, geographic information system), it is possible to observe a long-time series of the macroscopic area represented by RS technology in order to deal with multi-source data easily. It can provide a broad platform for studying the demarcation elevation of the alpine tree line. RS and GIS technologies have been introduced into the study of the alpine tree line. Remotely-sensed classification information and digital elevation models (DEM) were used to extract the demarcation elevation of the alpine tree line, which greatly improved the efficiency and comprehensiveness of the study of alpine tree line locations [
21,
25,
26,
27,
28]. However, there are still some problems in the study of demarcation elevation. First, although the elevation location of the alpine tree line can be obtained based on remotely-sensed classification information and DEM, it relies too much on the classification information as well as the topographic factors and ignores the analysis of the ecosystem state. In fact, the alpine tree line is the area where the ecosystem state shifts. With uncertainties such as threshold window selection, the accuracy of the extraction results needs to be further improved [
21,
27]. Second, based on statistical methods and the stable-state principle, the data collected in situ were used to analyze the elevation distribution of larch forests, but this study did not have any relevant results about the elevation of alpine tree line, nor did it use RS and GIS technology [
29]. Lastly, the highest, lowest, and mean elevations of the alpine tree line ecotone were extracted in the study [
25]. However, there is a lack of field validation data, and the accuracy of results needs to be verified [
25].
Since the 19th century, the alpine tree line has been often considered to be consistent with the 10 °C isotherm of the warmest month, but this conclusion applies only to the Alps and the Colorado Rocky Mountains [
8,
9]. The tree line of Mount William in New Guinea (3850 m, 5°S) is located in a region with an average temperature of 5.6 °C, while the tree line of the Craigieburn Mountains in New Zealand (1300 m, 43°S) is in line with the 11.6 °C isotherm of the warmest month [
2]. In order to analyze the relationship between the alpine tree line and a universal temperature, Körner [
2] discussed the causes of formation for the tree line from a global point of view, and noted that the location of the tree line was closely related to the average temperature during the growing season. Subsequently, Körner and Paulson [
11] used the root temperature records of 46 tree line points ranging from 68°N to 42°S in 1996–2003, and found that the tree line in high altitude climates correlated with the average temperature of 6.7 °C during the growing season. For the average temperature of the growing season in different climatic zones, there was a narrow floating range of 2.2 K. It indicated that the growth of alpine tree line plants was controlled by temperature and there existed a low temperature threshold. Jobbágy and Jackson [
10] utilized a global climate database and 115 points of alpine tree line data (excluding tropical zones), and the statistical analysis showed that the change in the tree line was correlated with an annual average temperature and a seasonal heat radiation value. There is not enough solar radiation data in most parts of the world, but, fortunately, the temperature of the canopy near the tree line is relatively close to the temperature of the air. Woodward and Körner [
30,
31] studied the leaf extension of different species at different elevations by means of an electronic assistant measuring instrument, and showed that the leaf extension of different species at different elevations was limited by temperature. Hence, the temperature is the main factor for controlling the formation of the alpine tree line, which has been supported by most studies. In the case of relatively moist conditions, the temperature is the main factor in the formation of the Bogda alpine tree line [
32,
33]. The temperature data is usually acquired from meteorological stations by point measurements. However, the distribution of meteorological stations in a mountainous area is extremely limited [
34,
35]. Generally, different interpolation methods are used to obtain continuous surface temperature data, and the results of different methods are also different, which greatly reduce the reliability of data. High-precision LST can be derived from remotely-sensed data. Therefore, we can make use of the Thermal Infrared Sensor (TIRS) data with a spatial resolution of 100 m to retrieve LST. LST, as one of the priority parameters of the International Geosphere-Biosphere Programme, can provide spatial and temporal information on the energy balance of the surface. It is key for remote sensing applications in drought prediction, crop water pressure estimation, plant physiological monitoring, crop yield estimation, numerical weather prediction, and climate prediction [
36,
37]. Thus, LST was selected as the index to extract the elevation range of the alpine tree line.
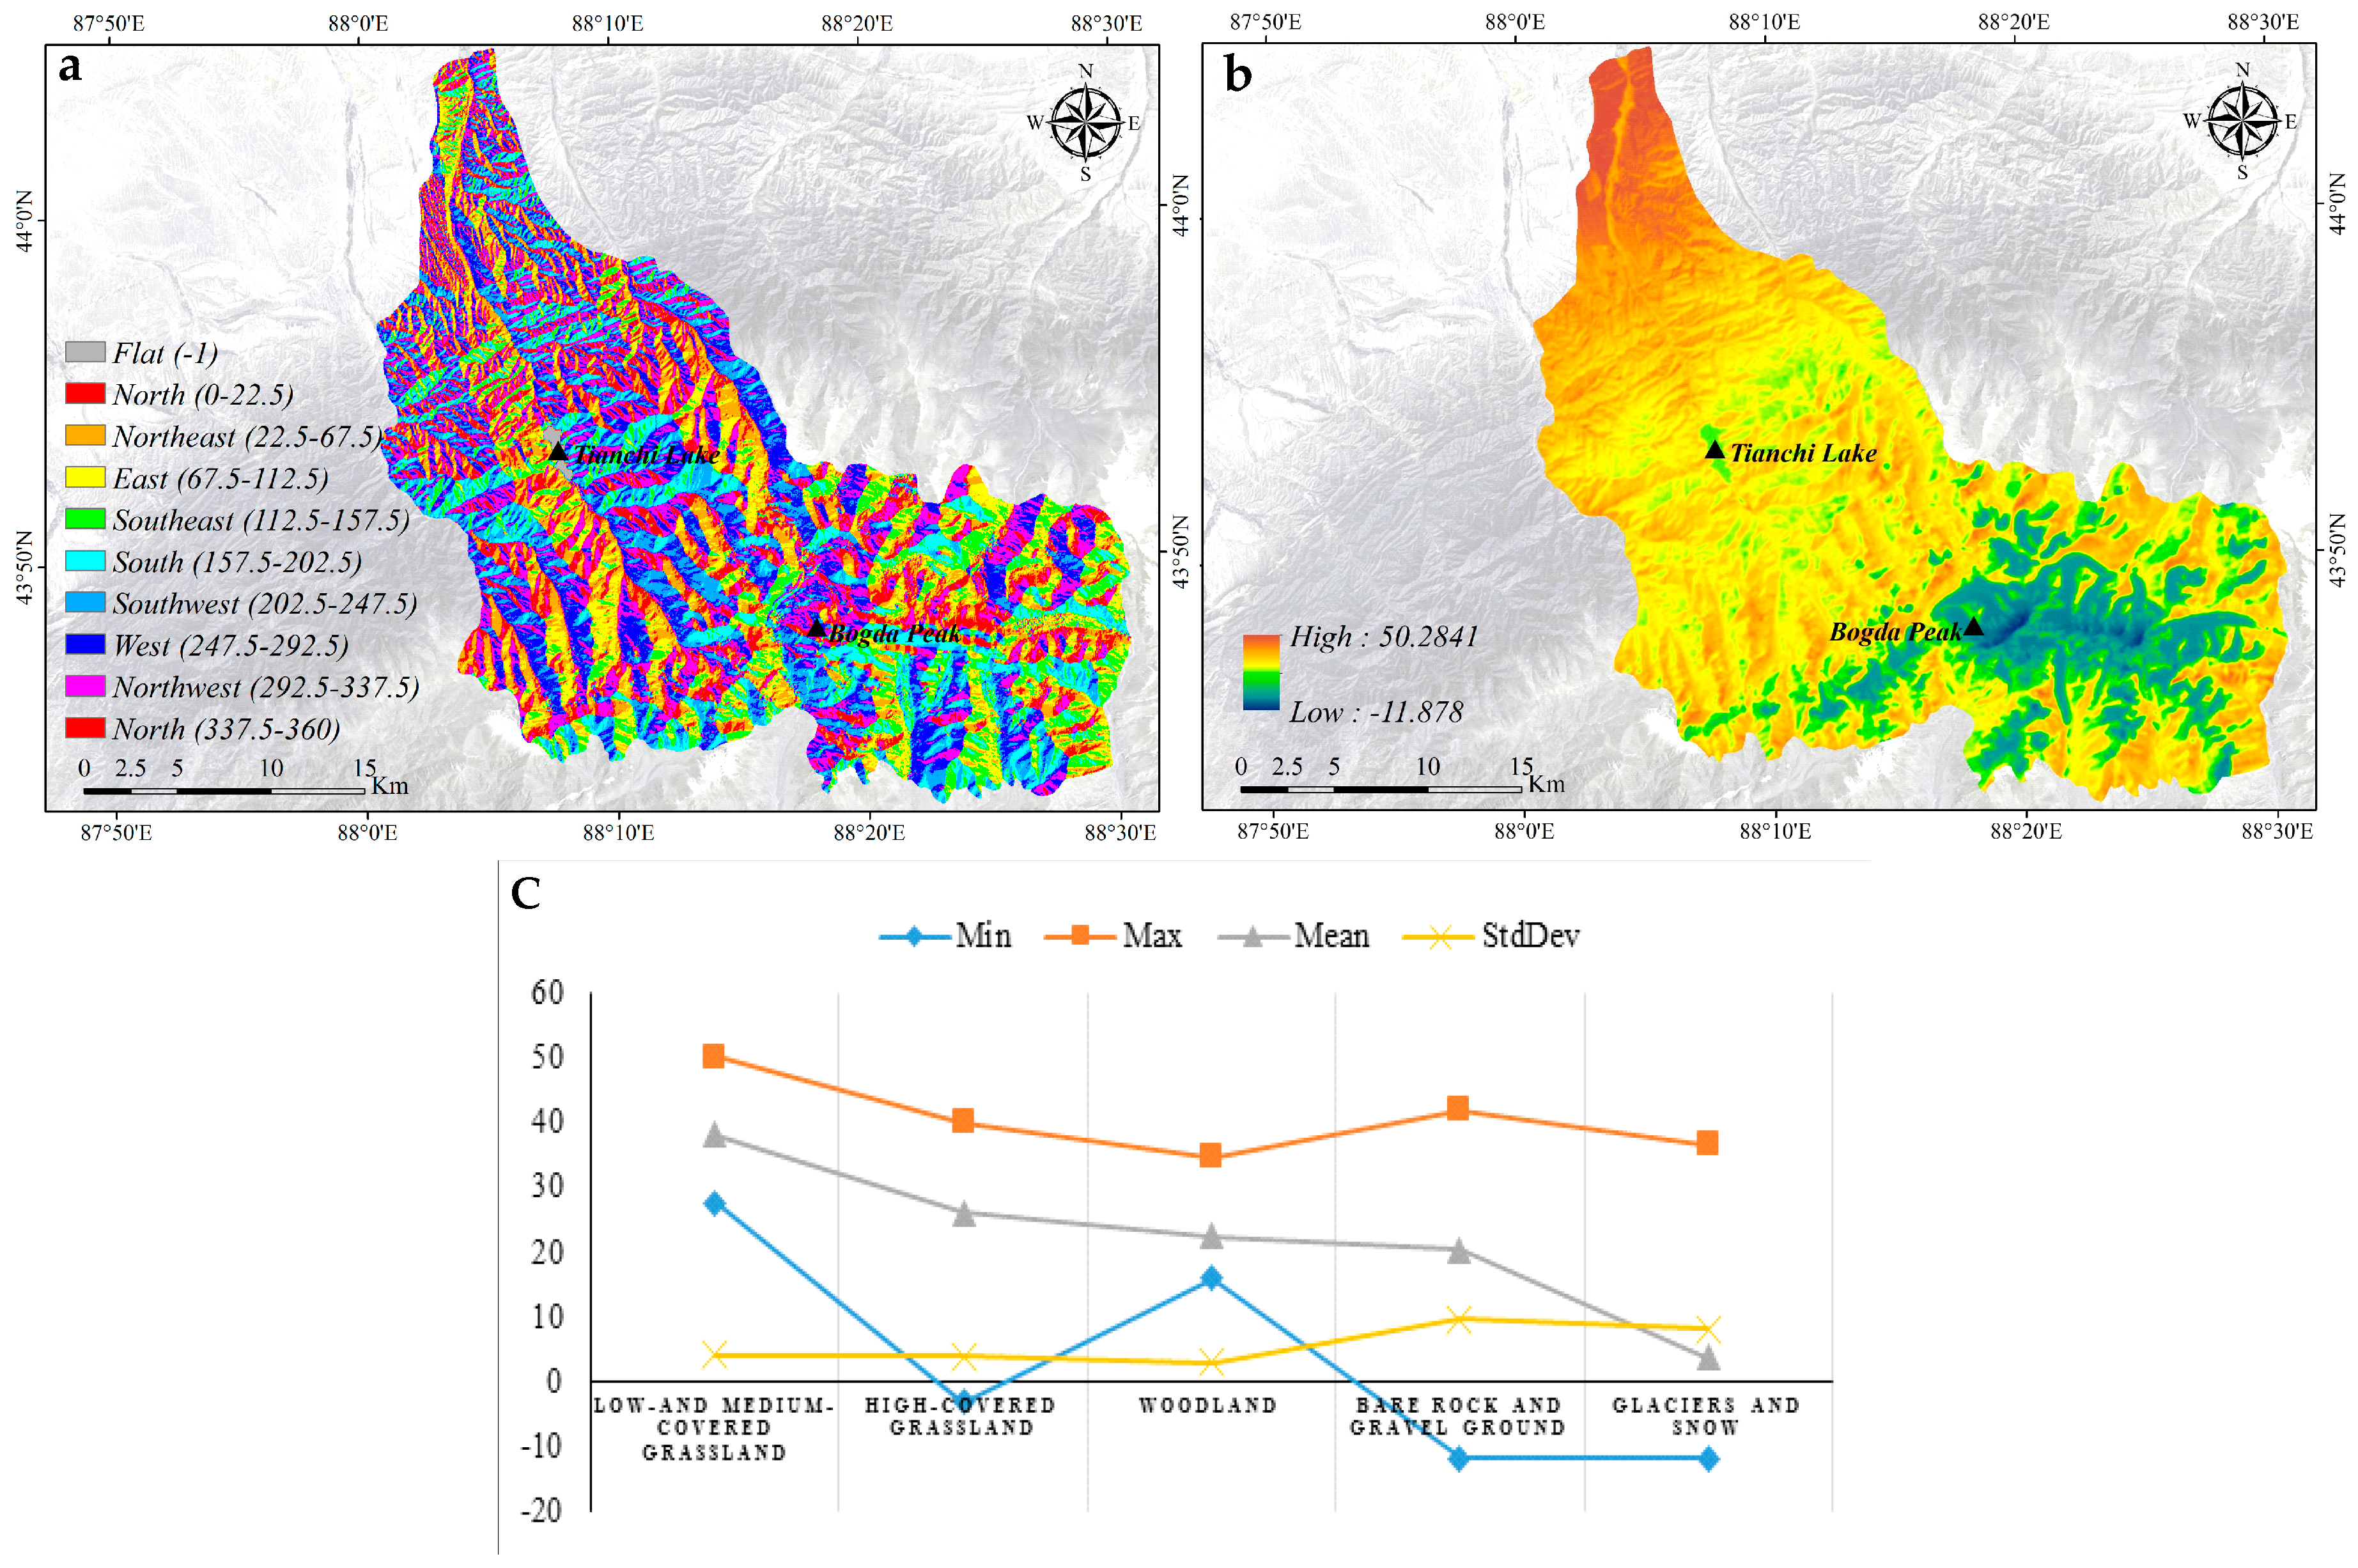
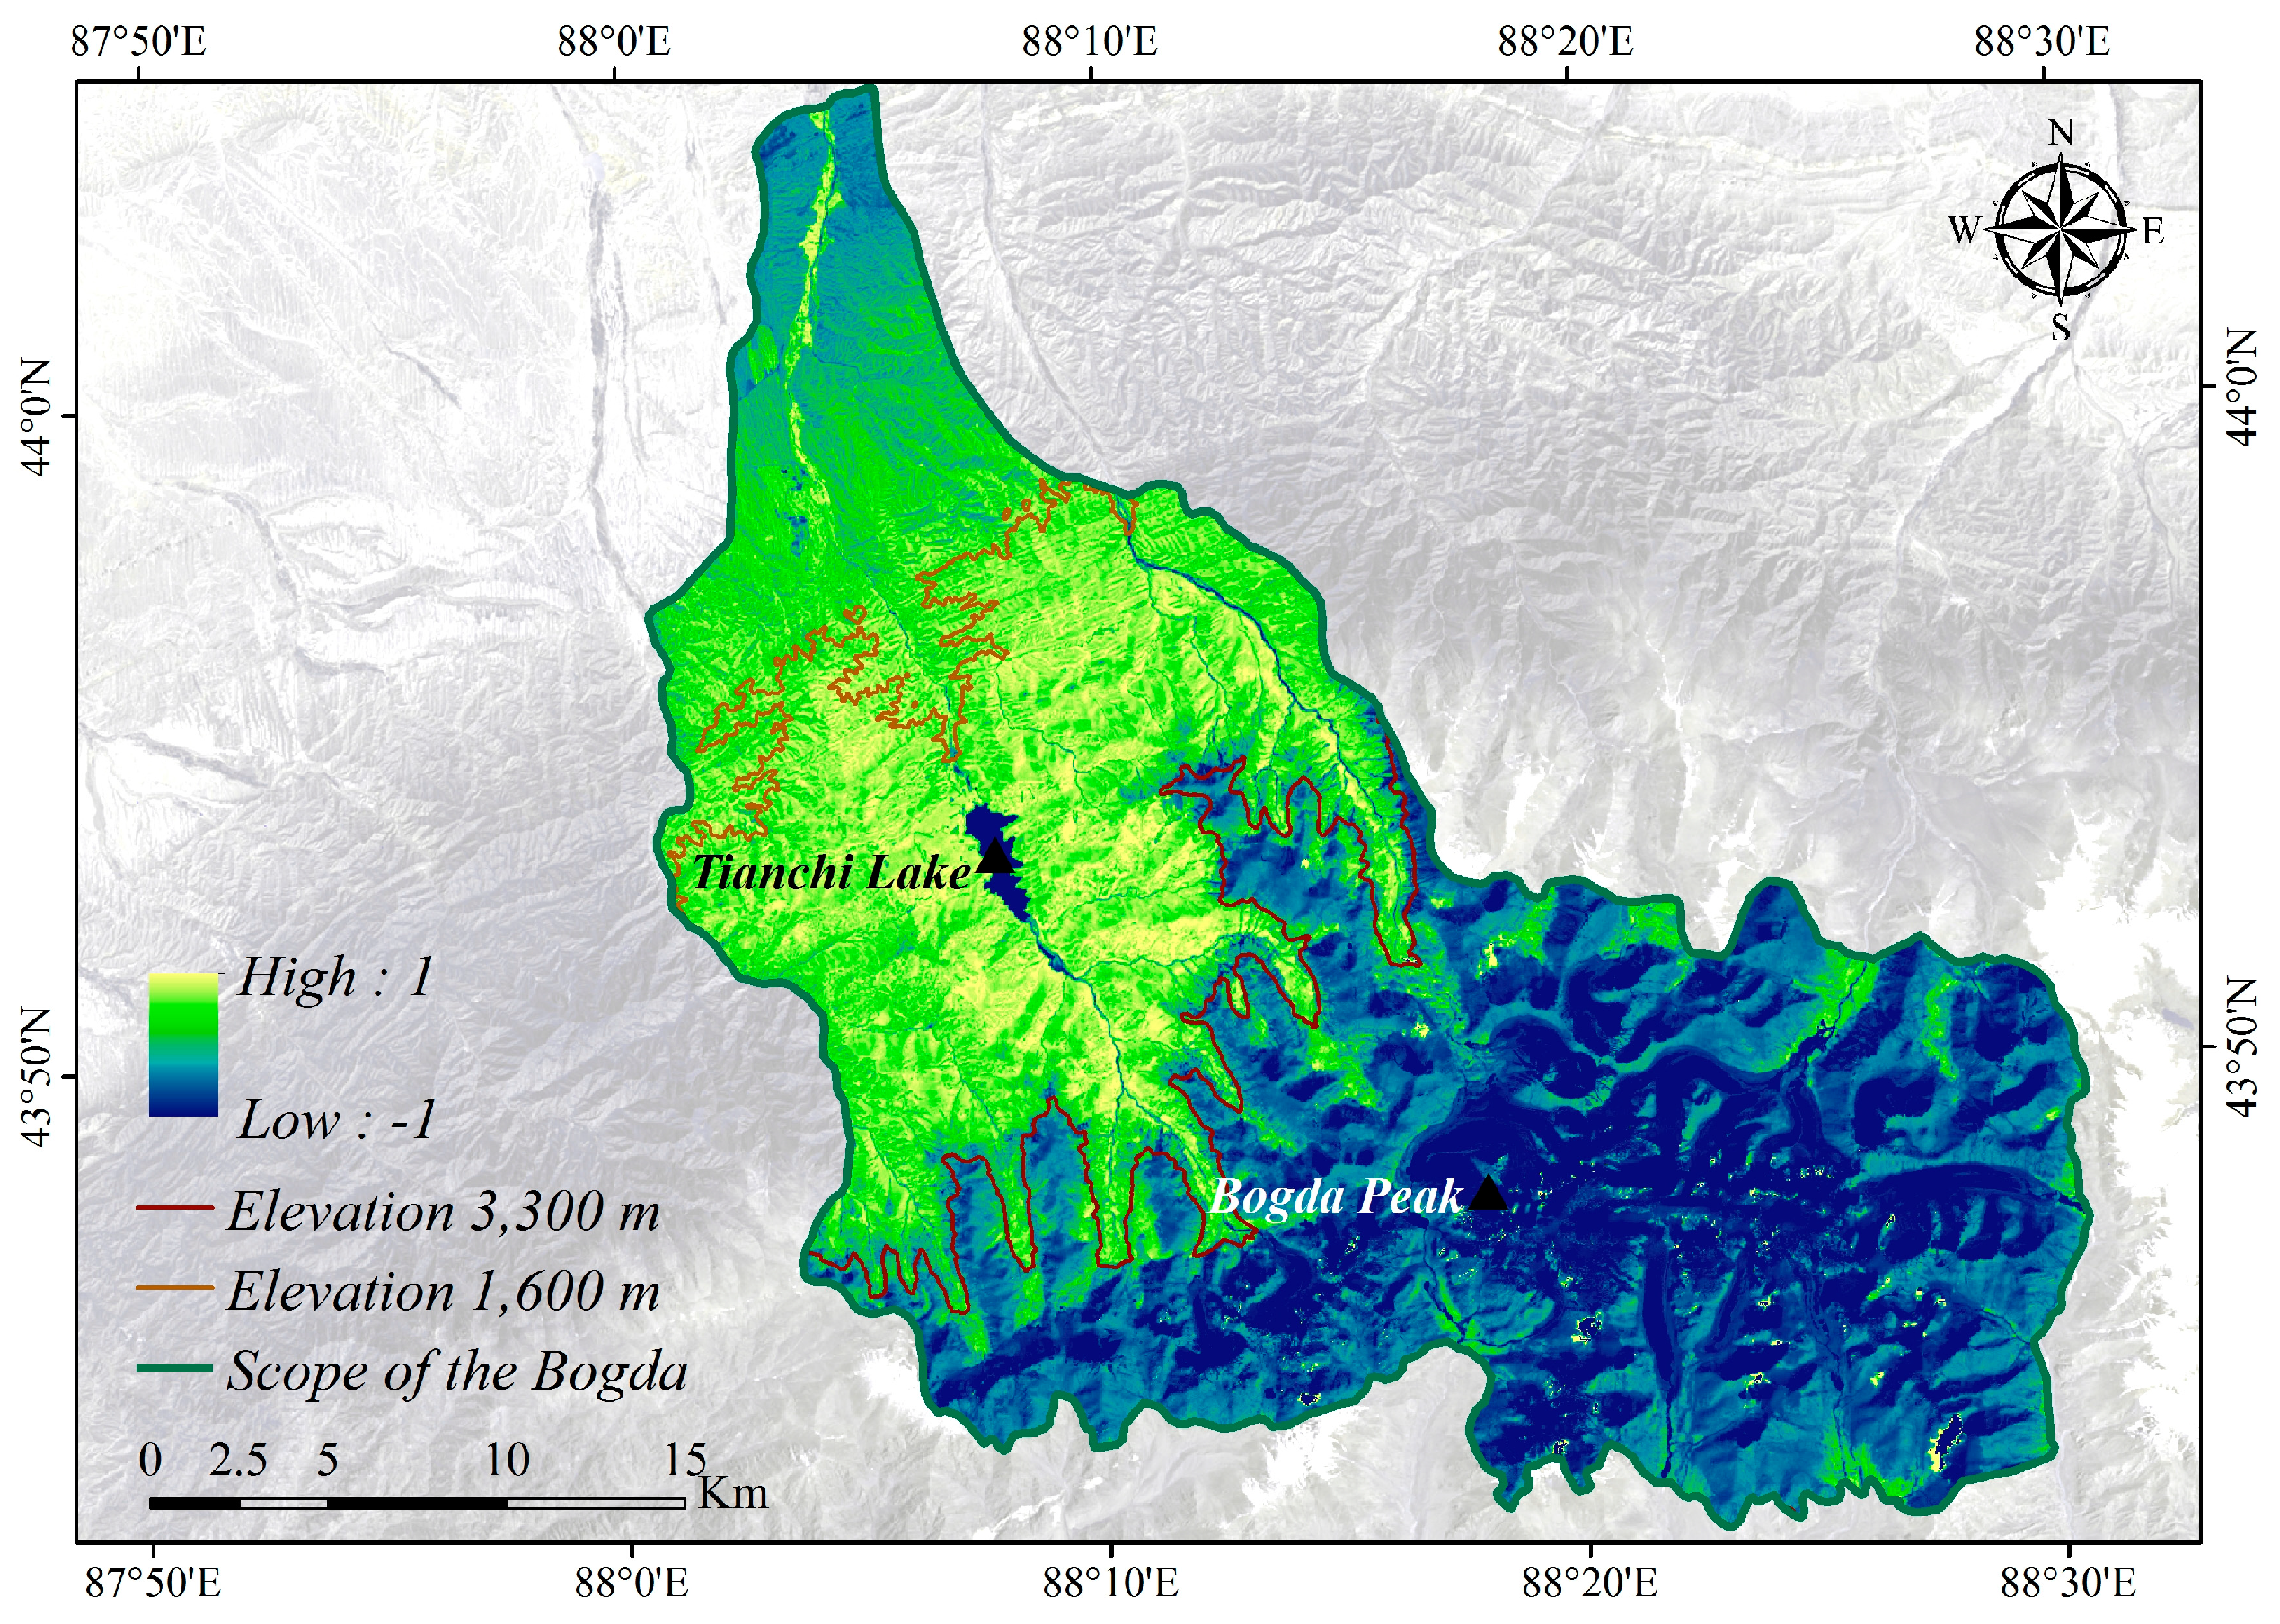
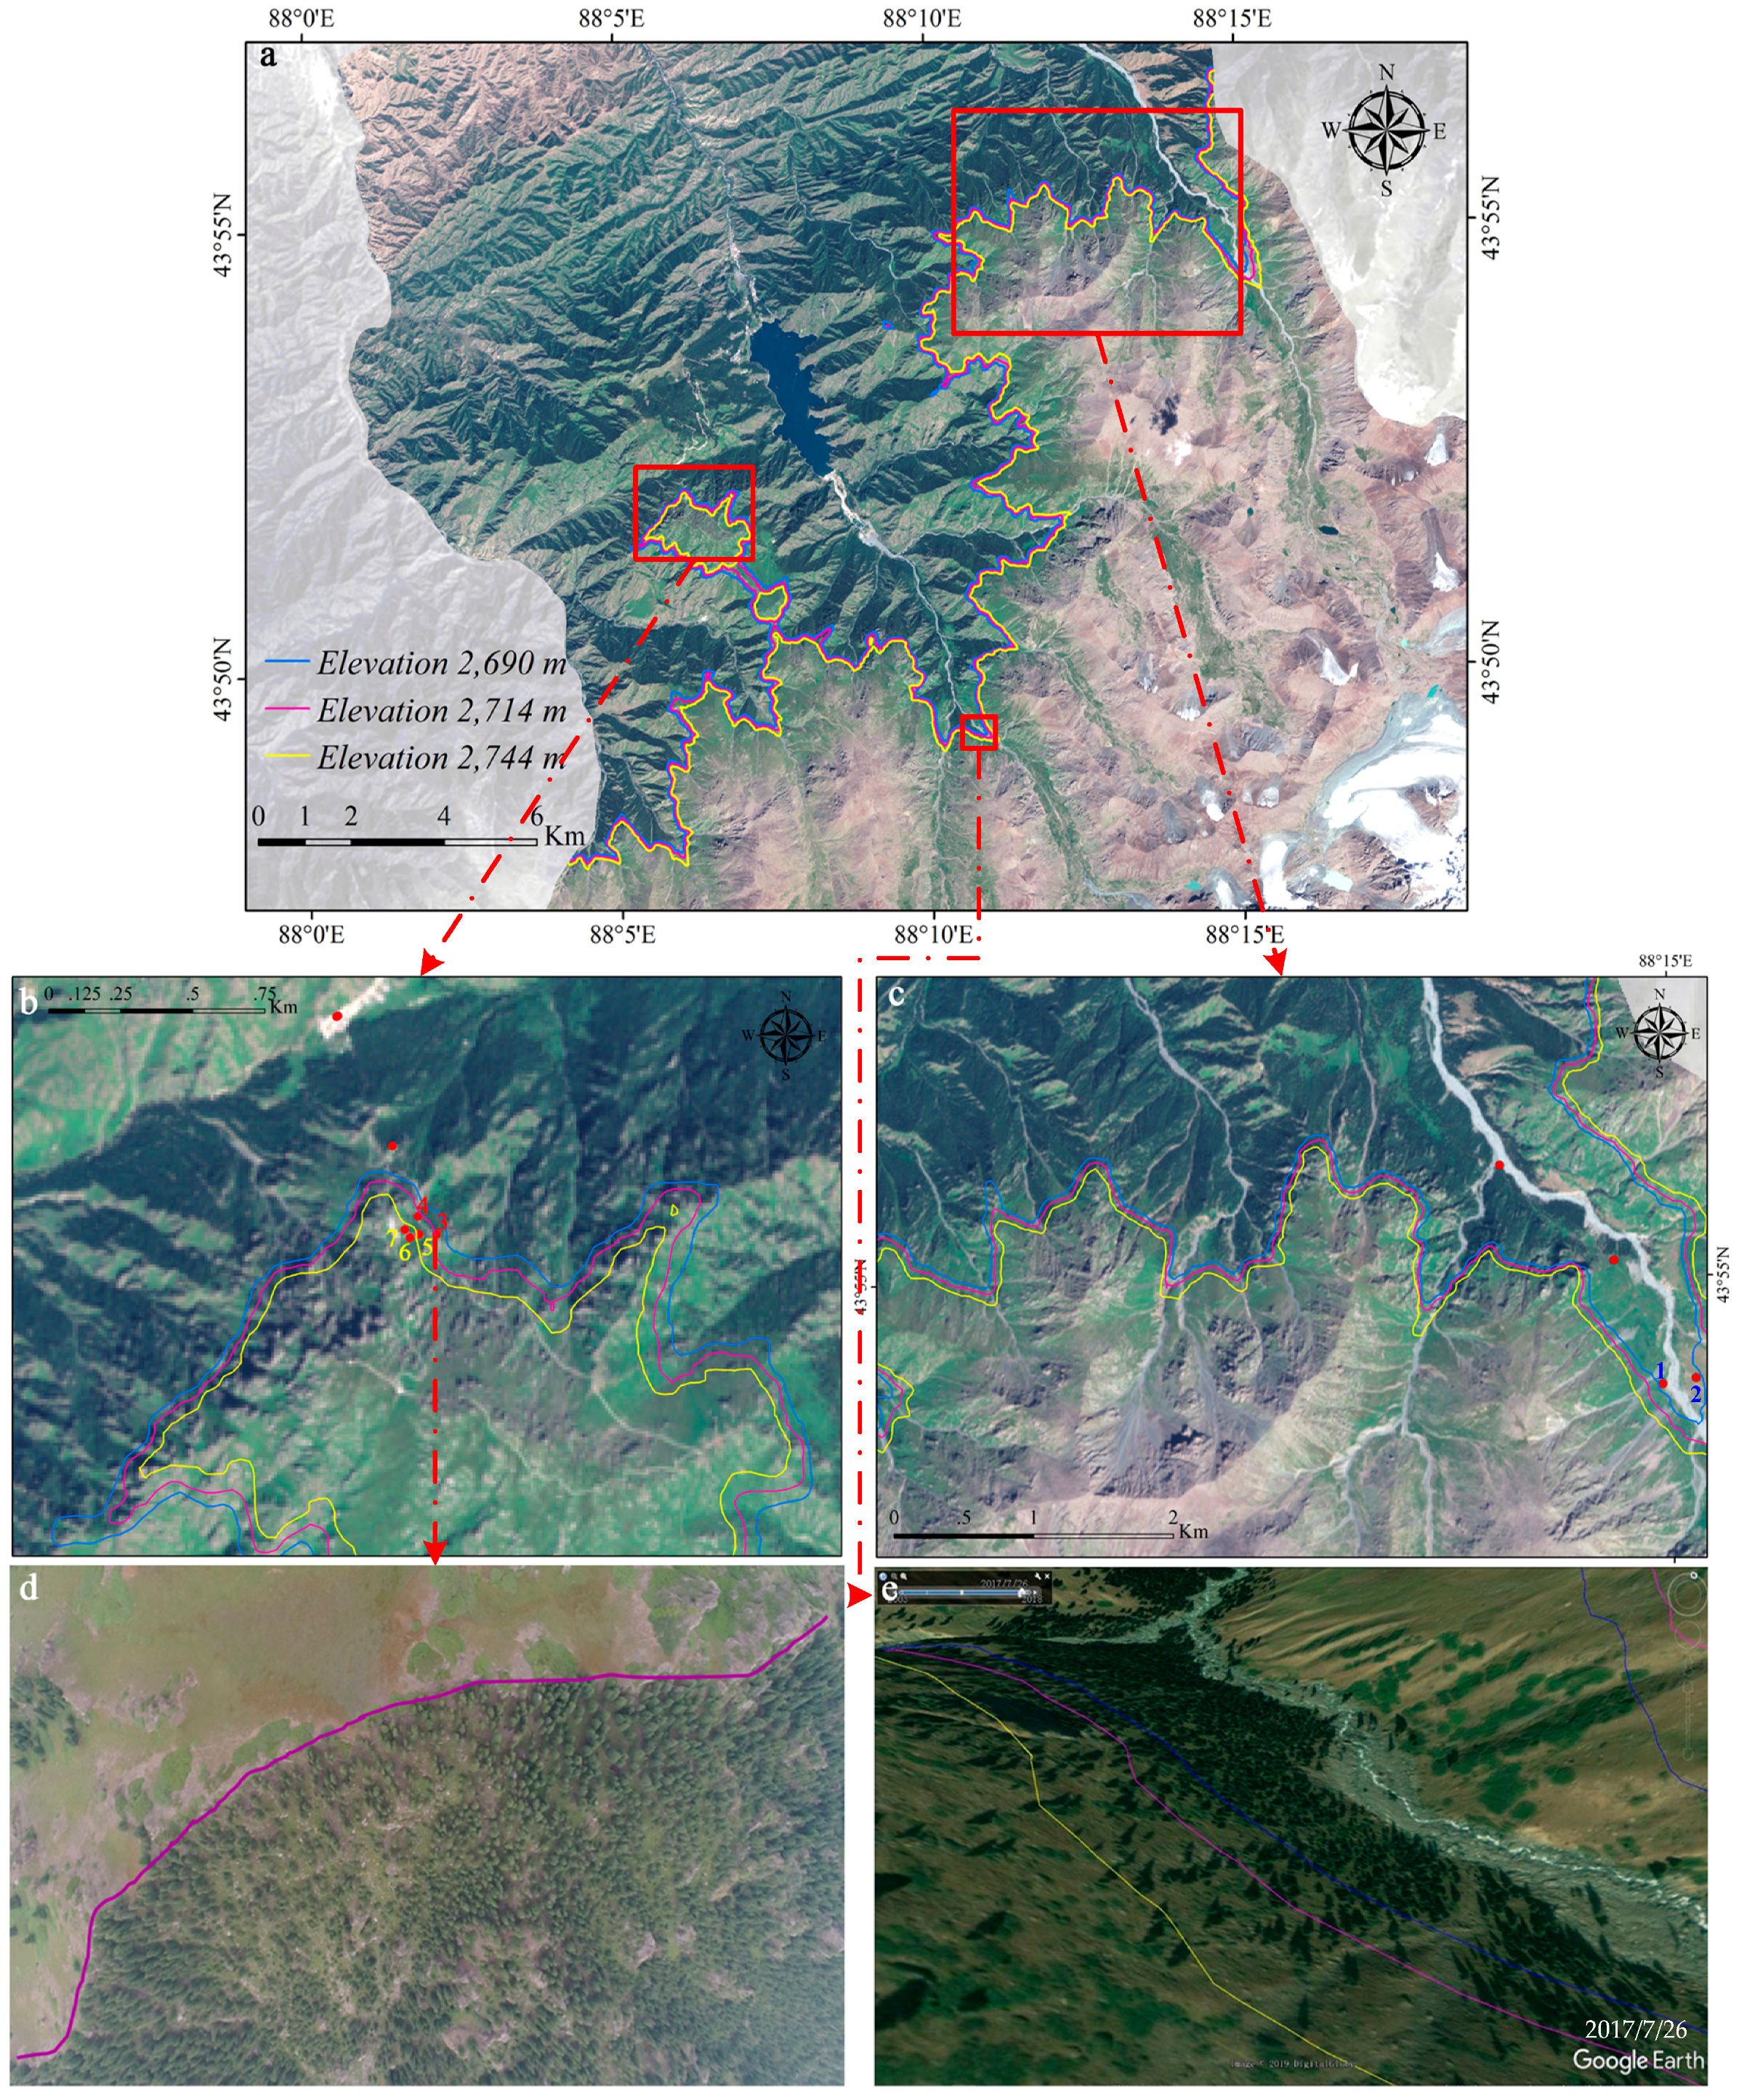
In view of these problems, we chose the Bogda component of the ** of Landsat OLI data (excluding panchromatic bands). The normalized difference vegetation index (NDVI) is a vegetation index, which is widely used to monitor vegetation growth and cover [
42,
43]. Then, NDVI was computed by the band 4(Red) and band 5(Near-Infrared, NIR) based on the processed image data, as shown in Formula (1).
where
and
are the spectral reflectances in the NIR and red bands, respectively.
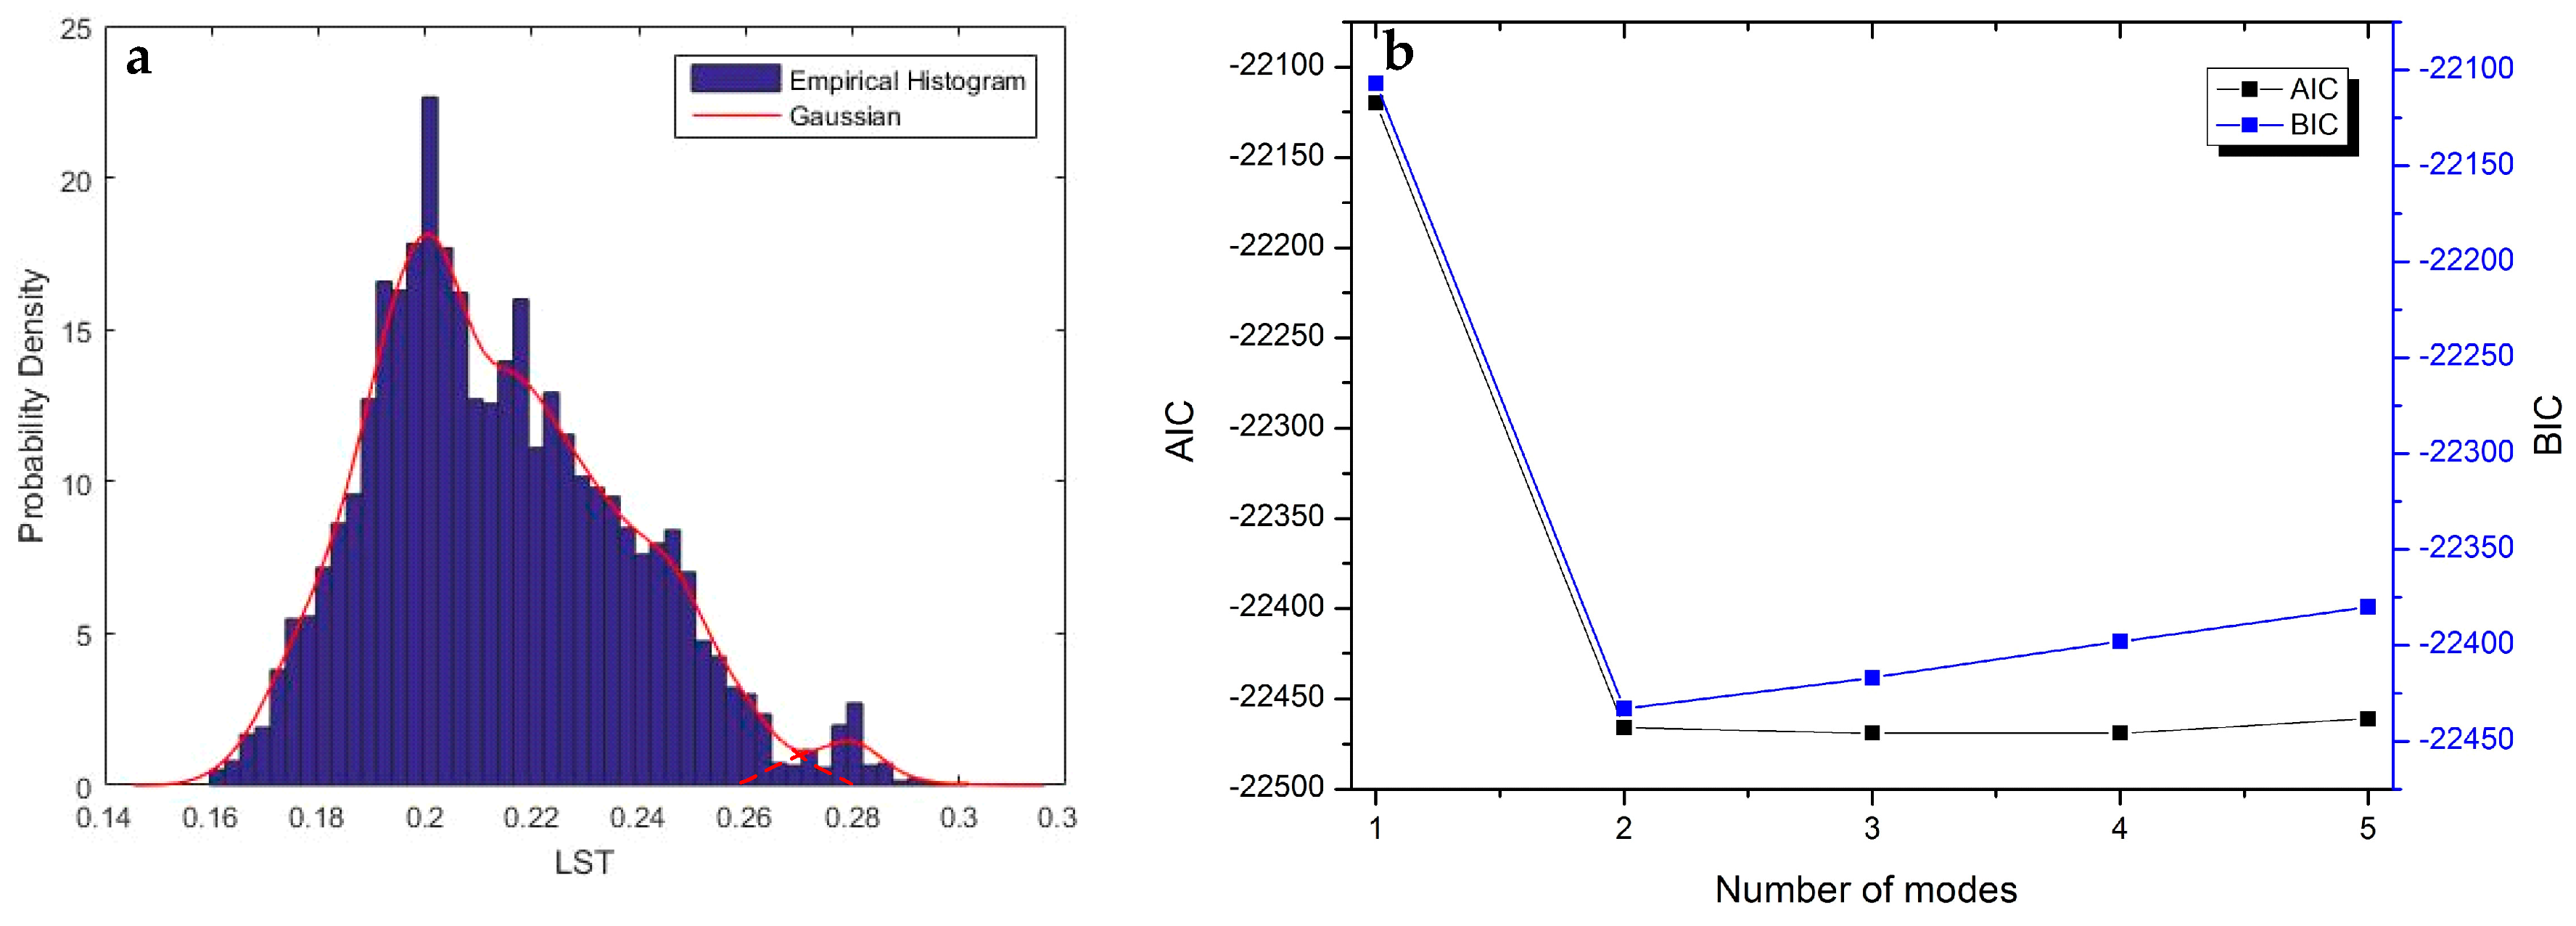
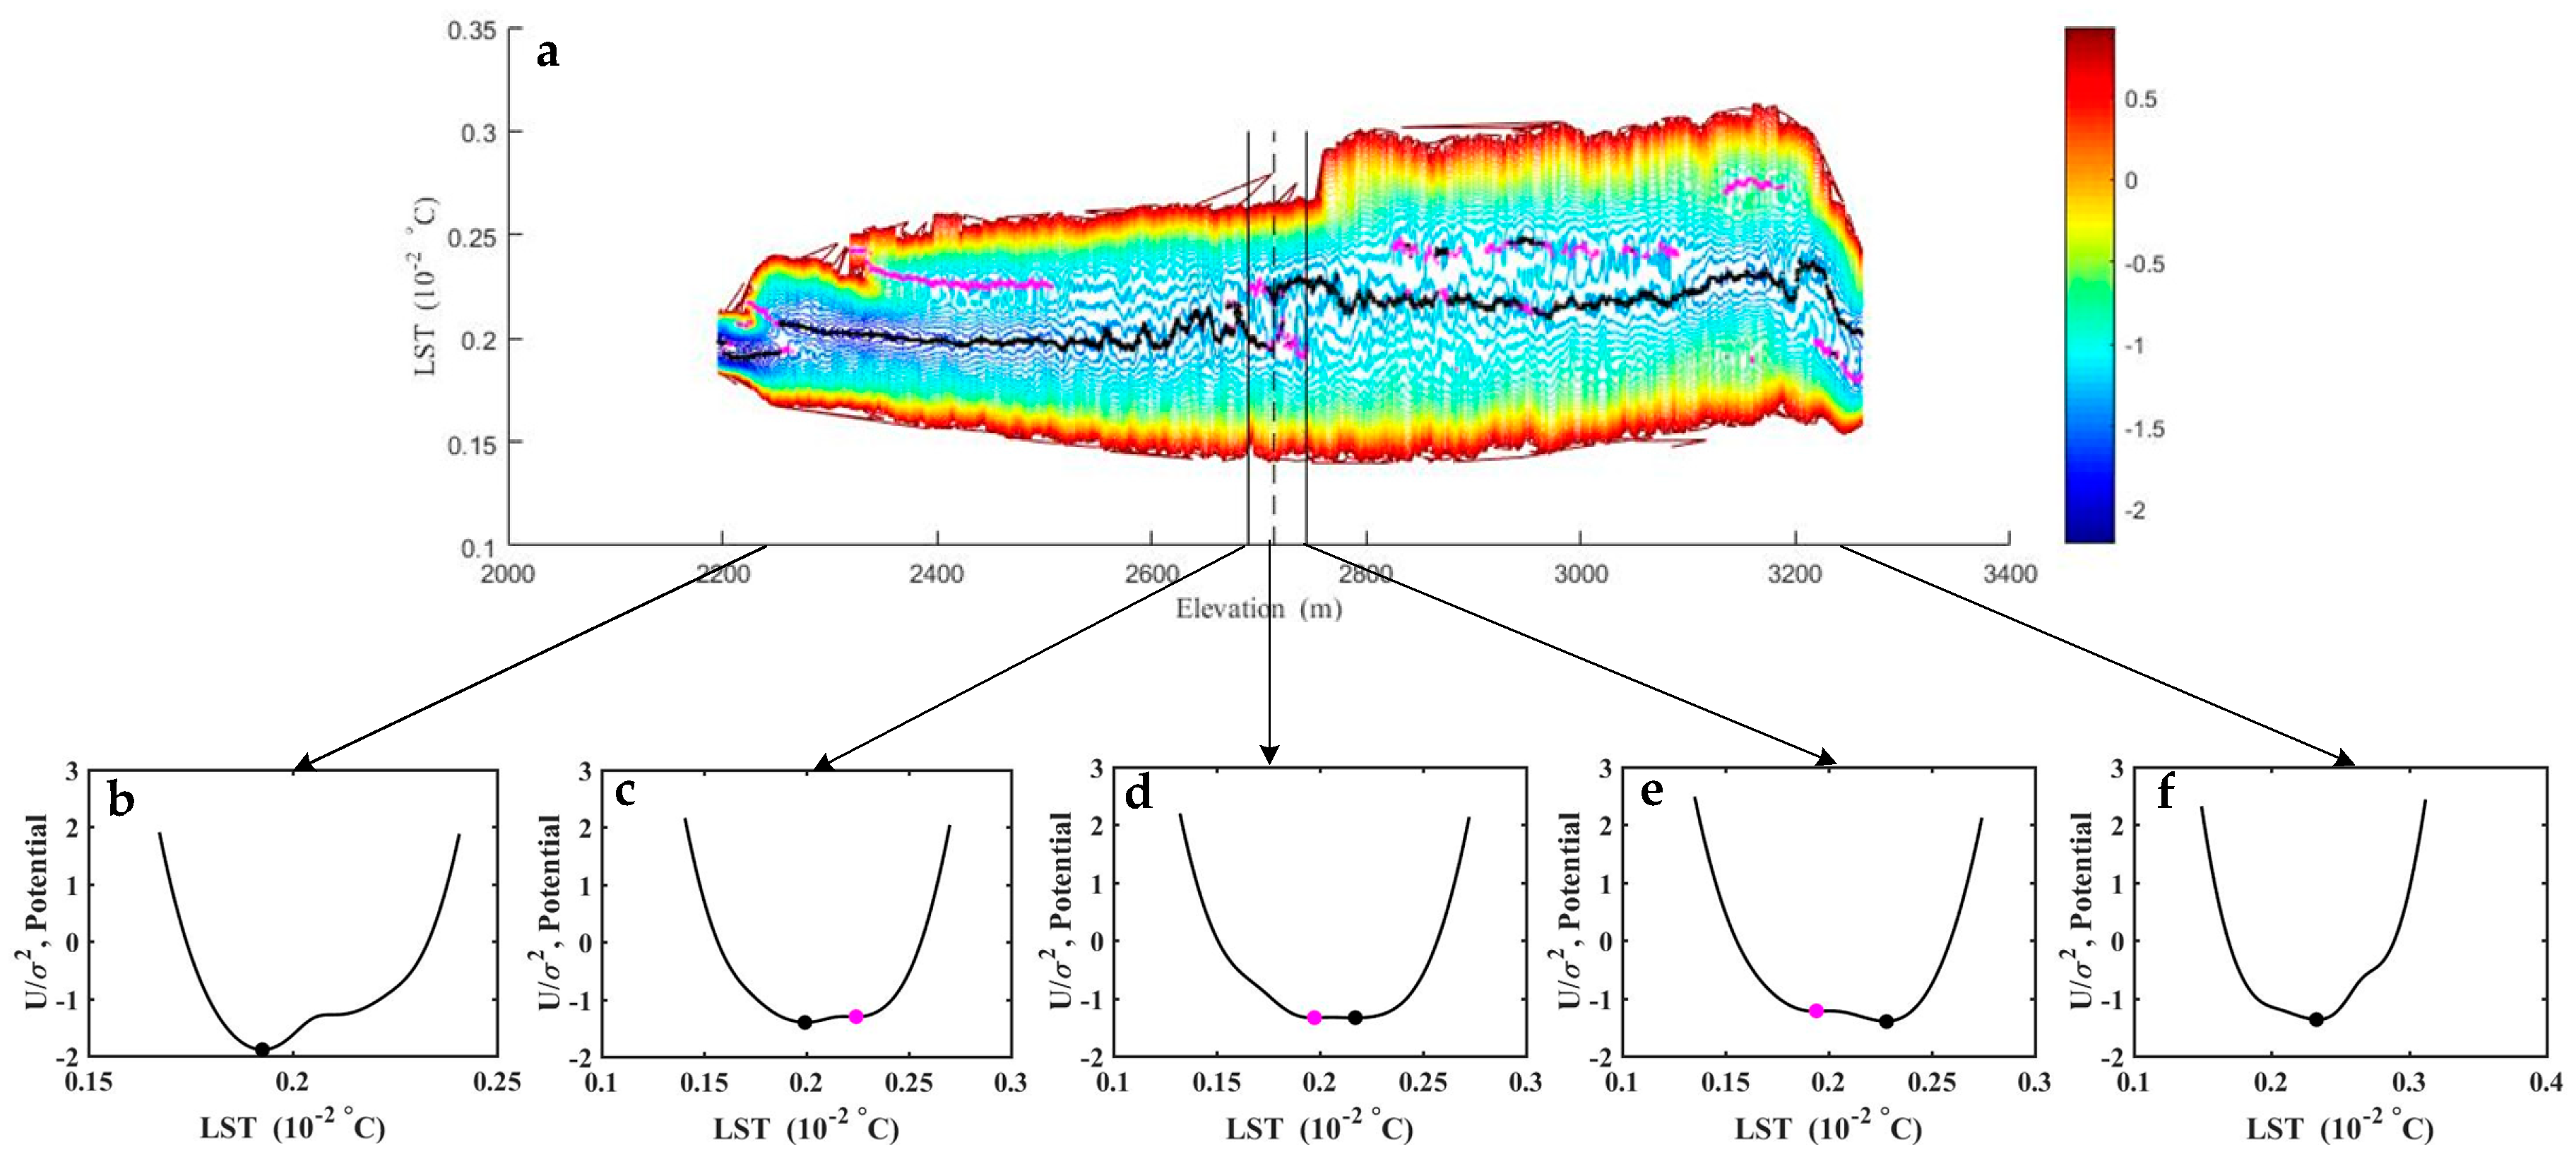
4. Discussion
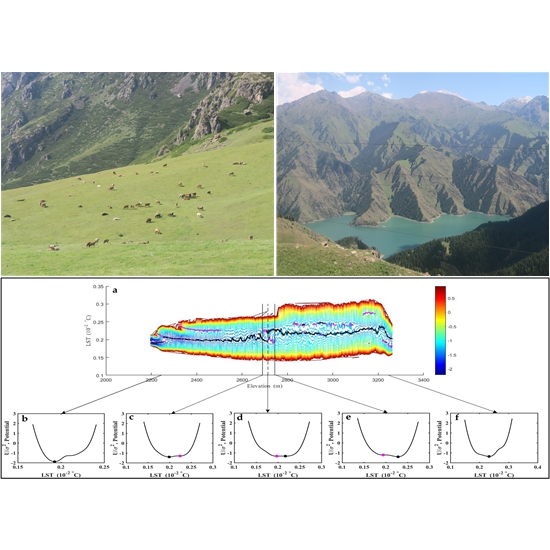
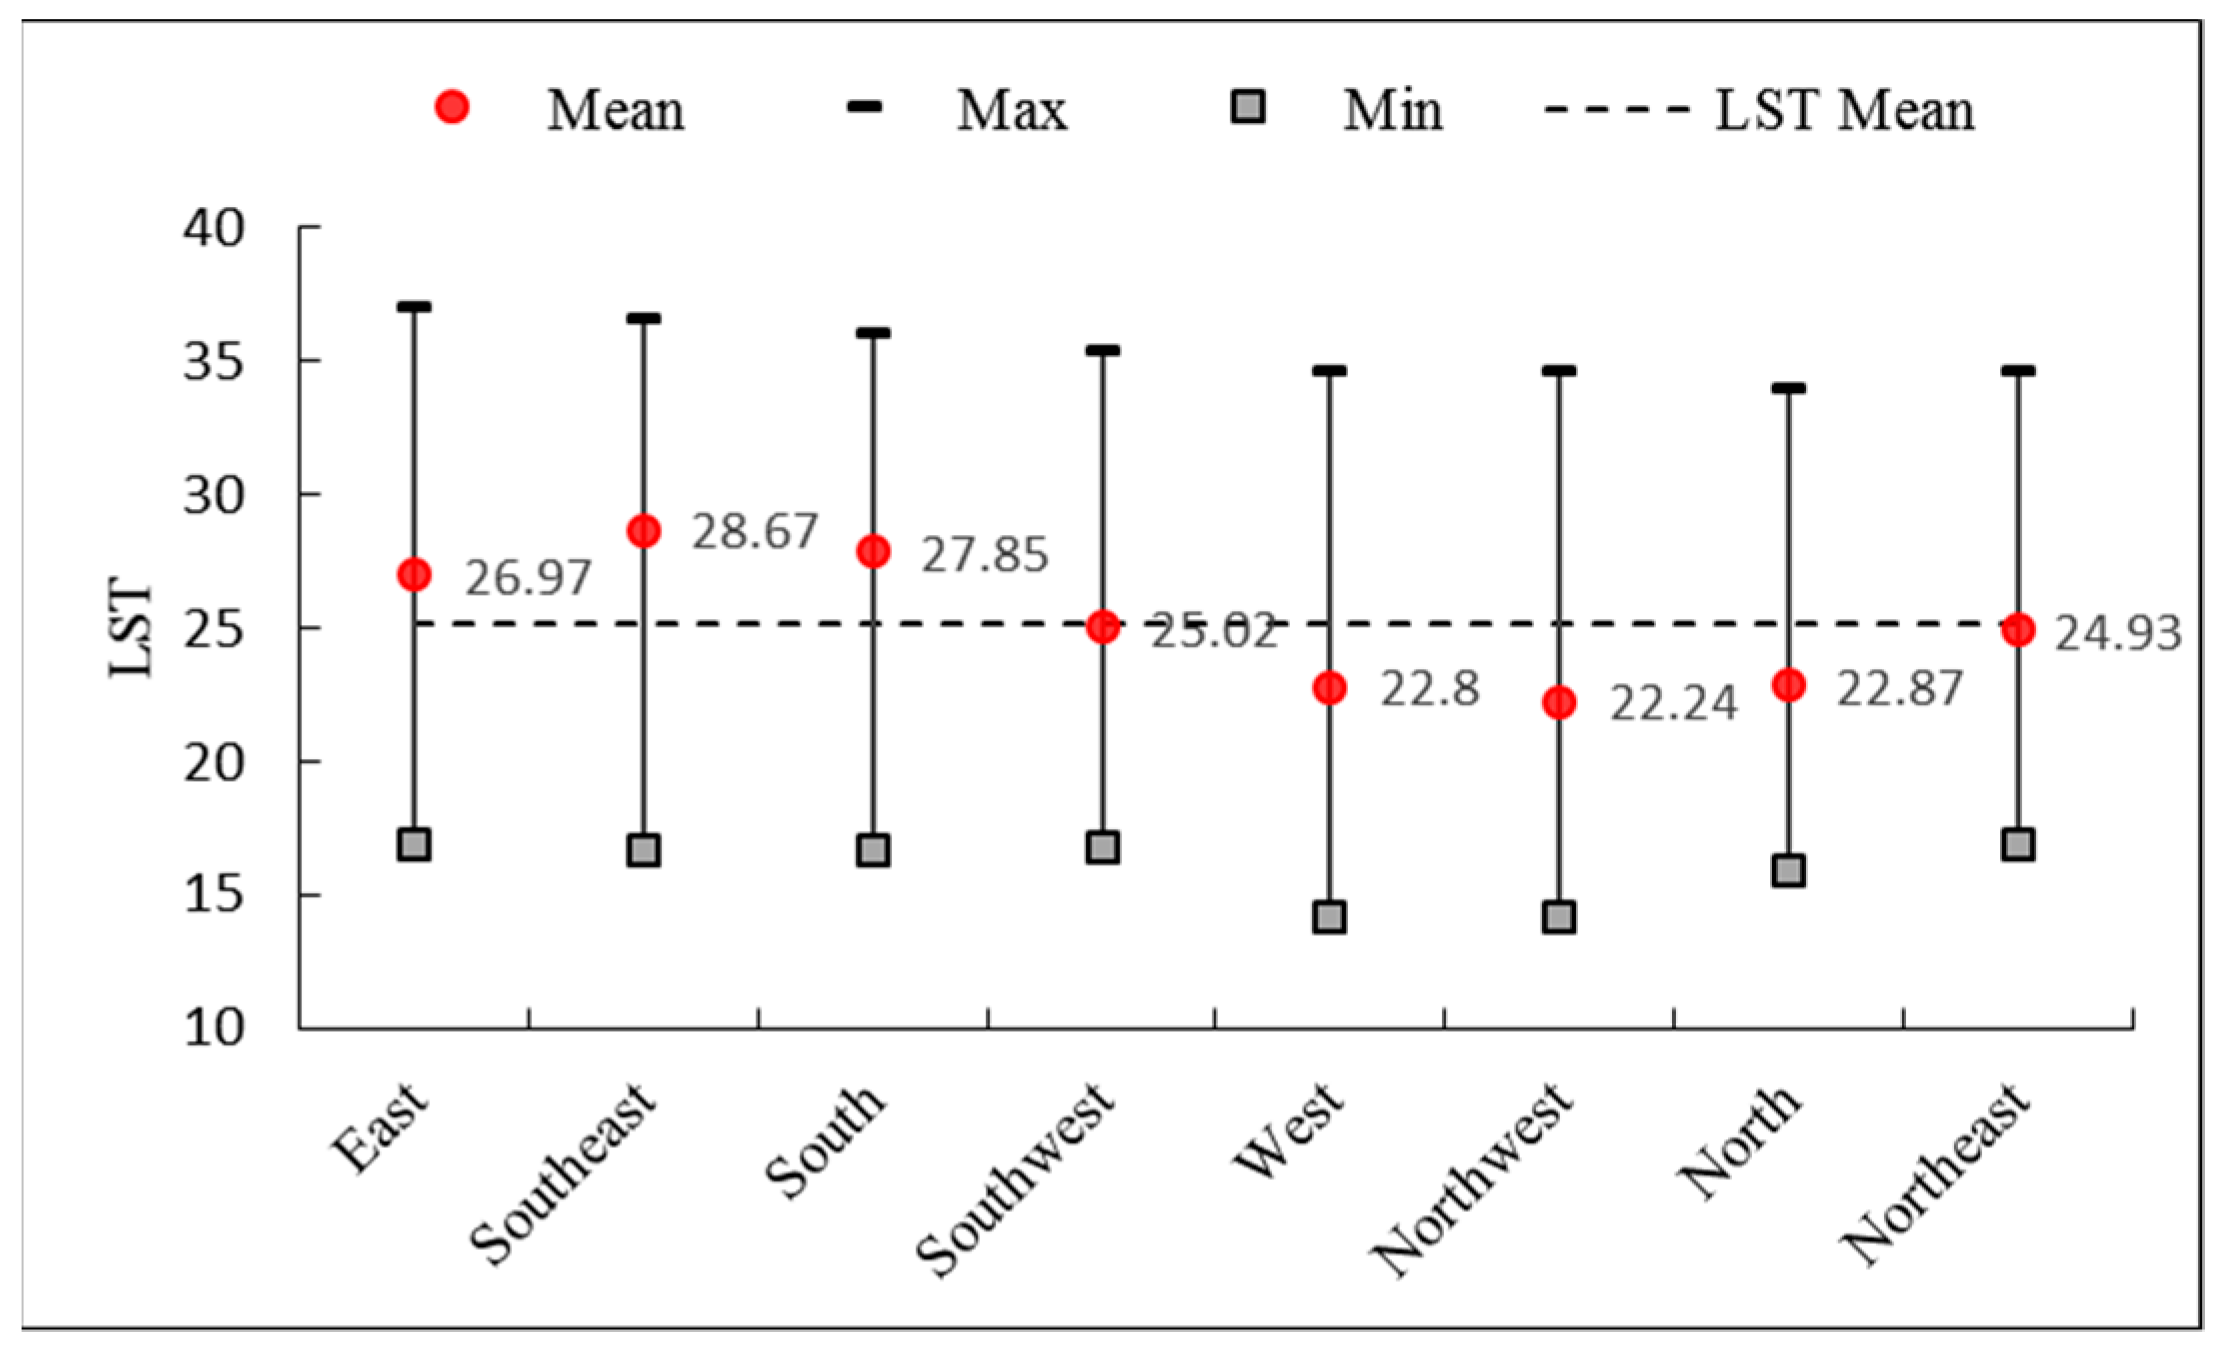
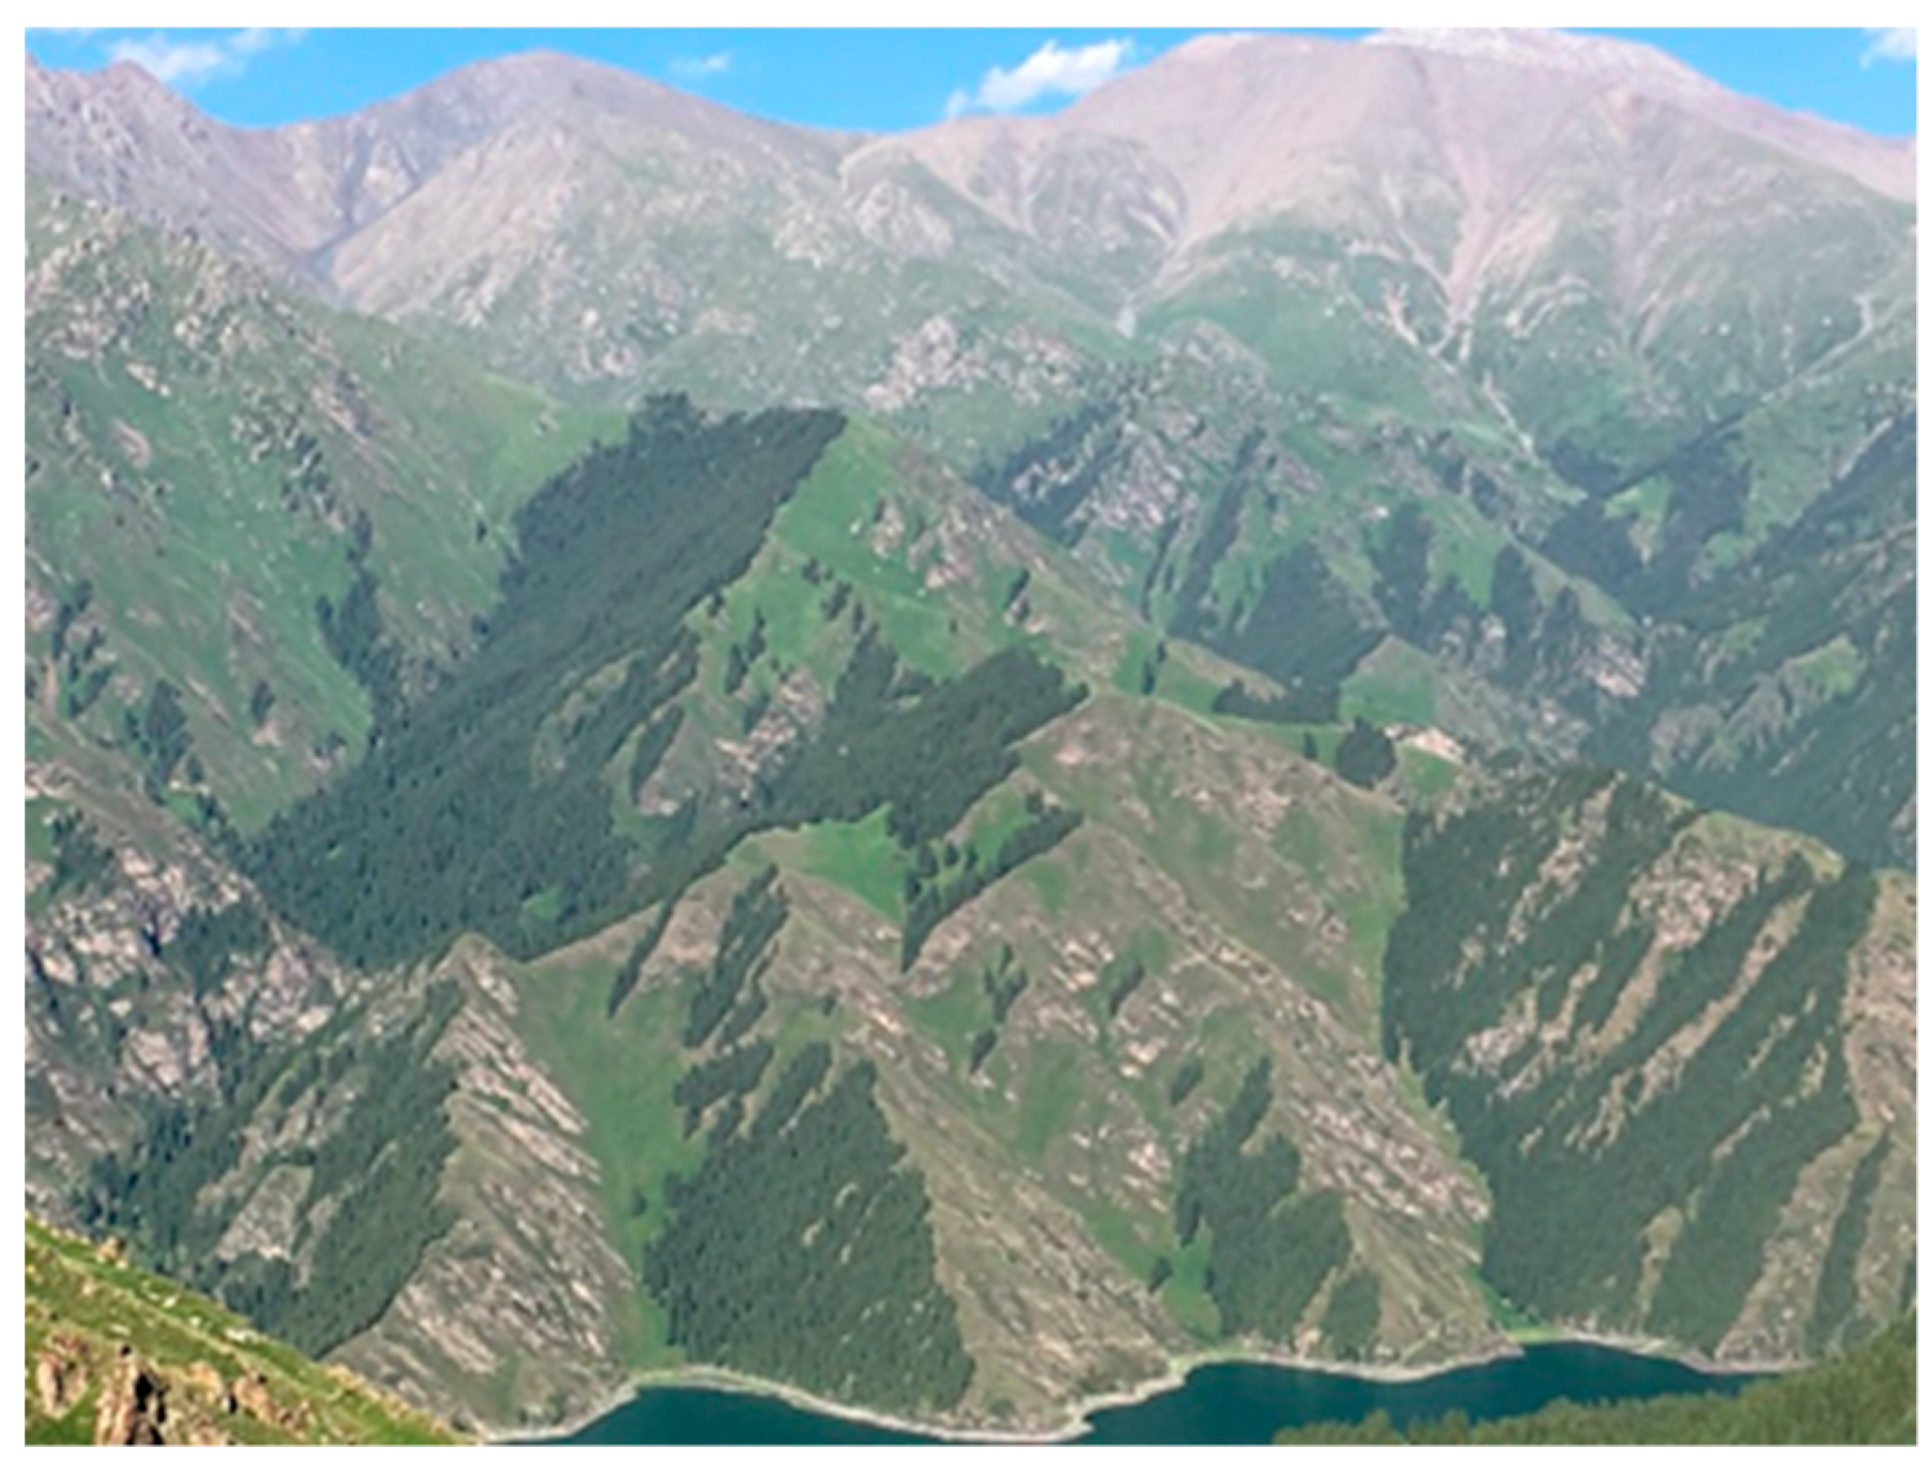
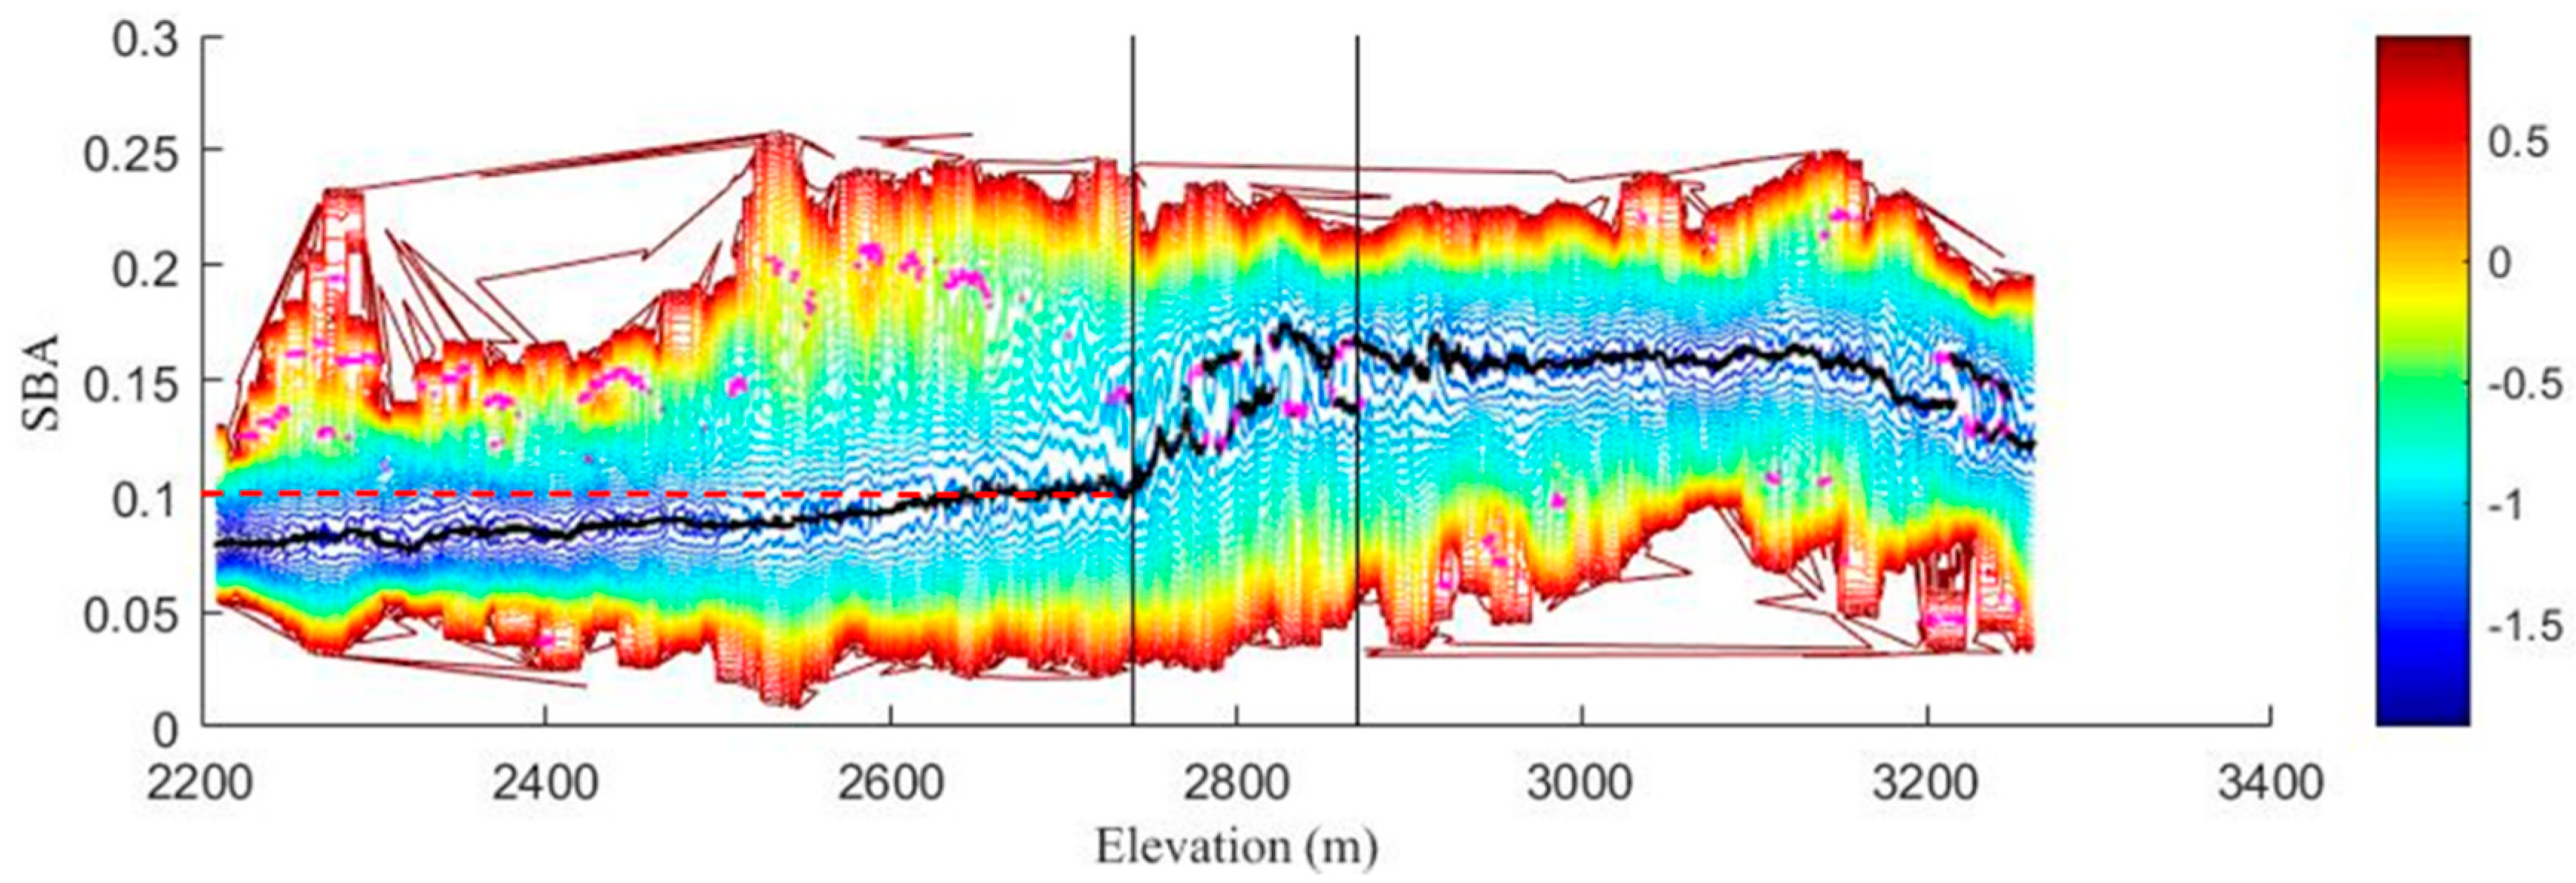
It has been reported that albedo can be affected not only by fractional vegetation cover, but also by structural properties of vegetation such as the crown size, height, and shape of trees [
84,
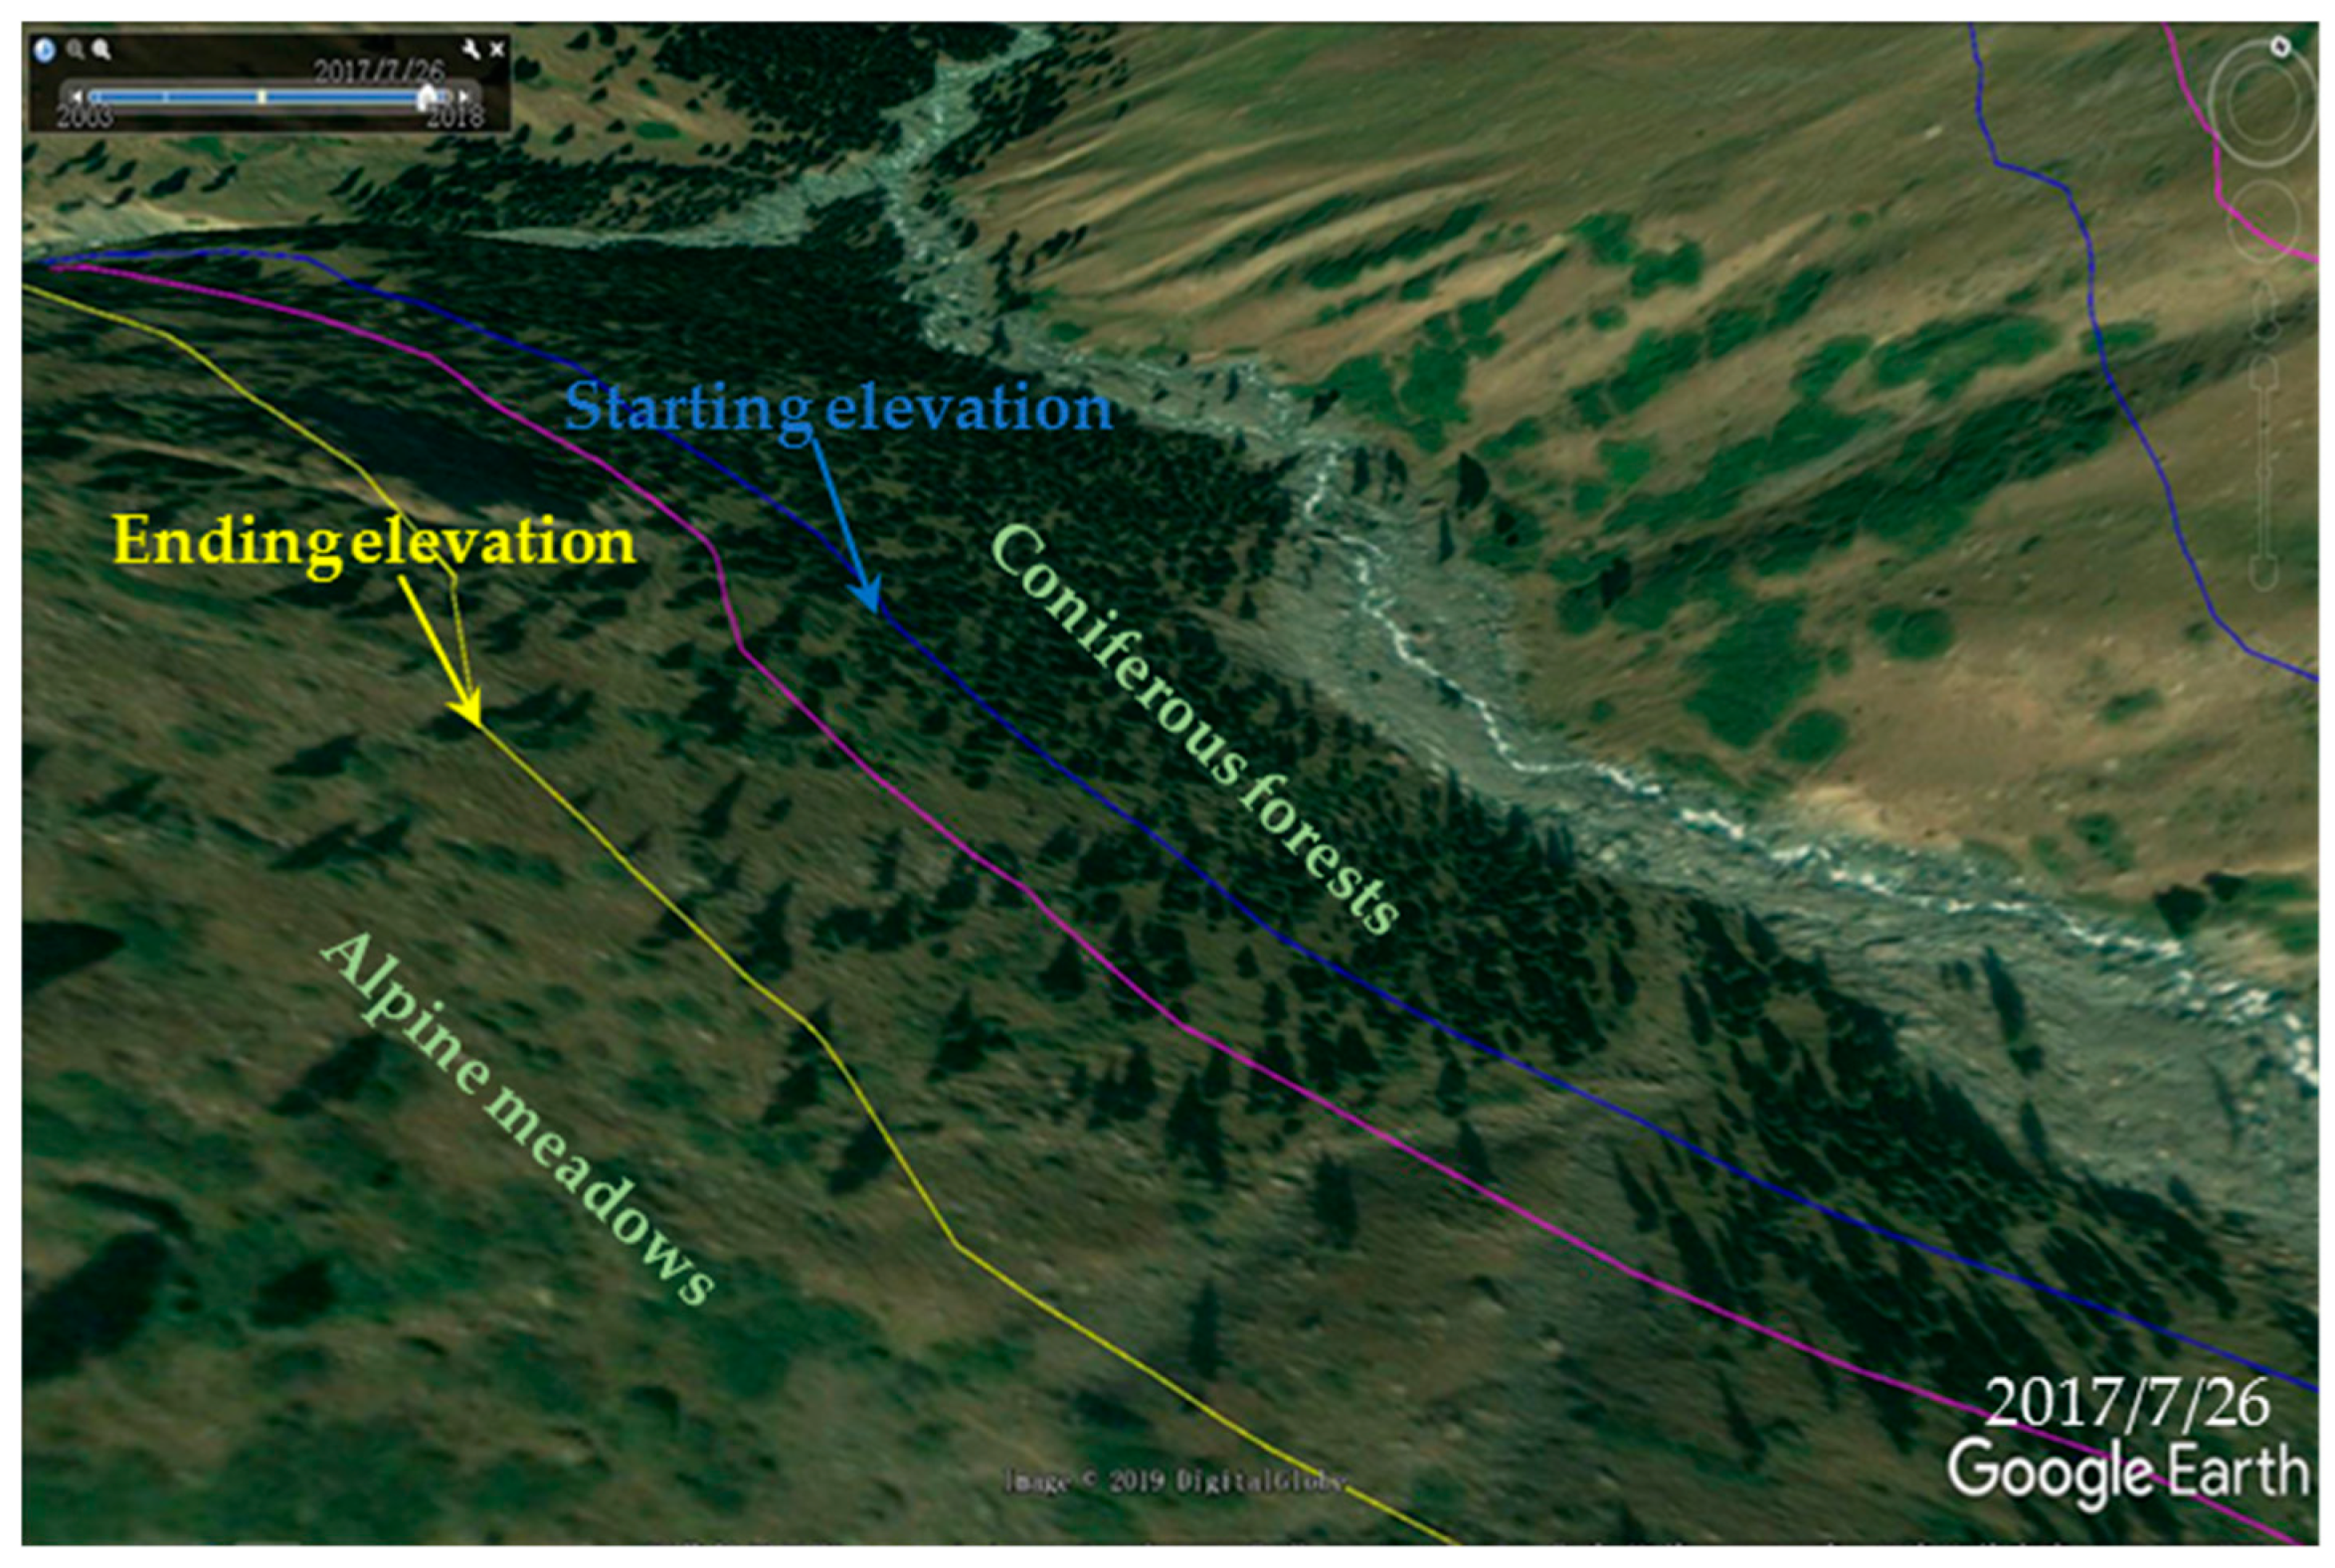
85]. Combined with the actual situation, as shown in
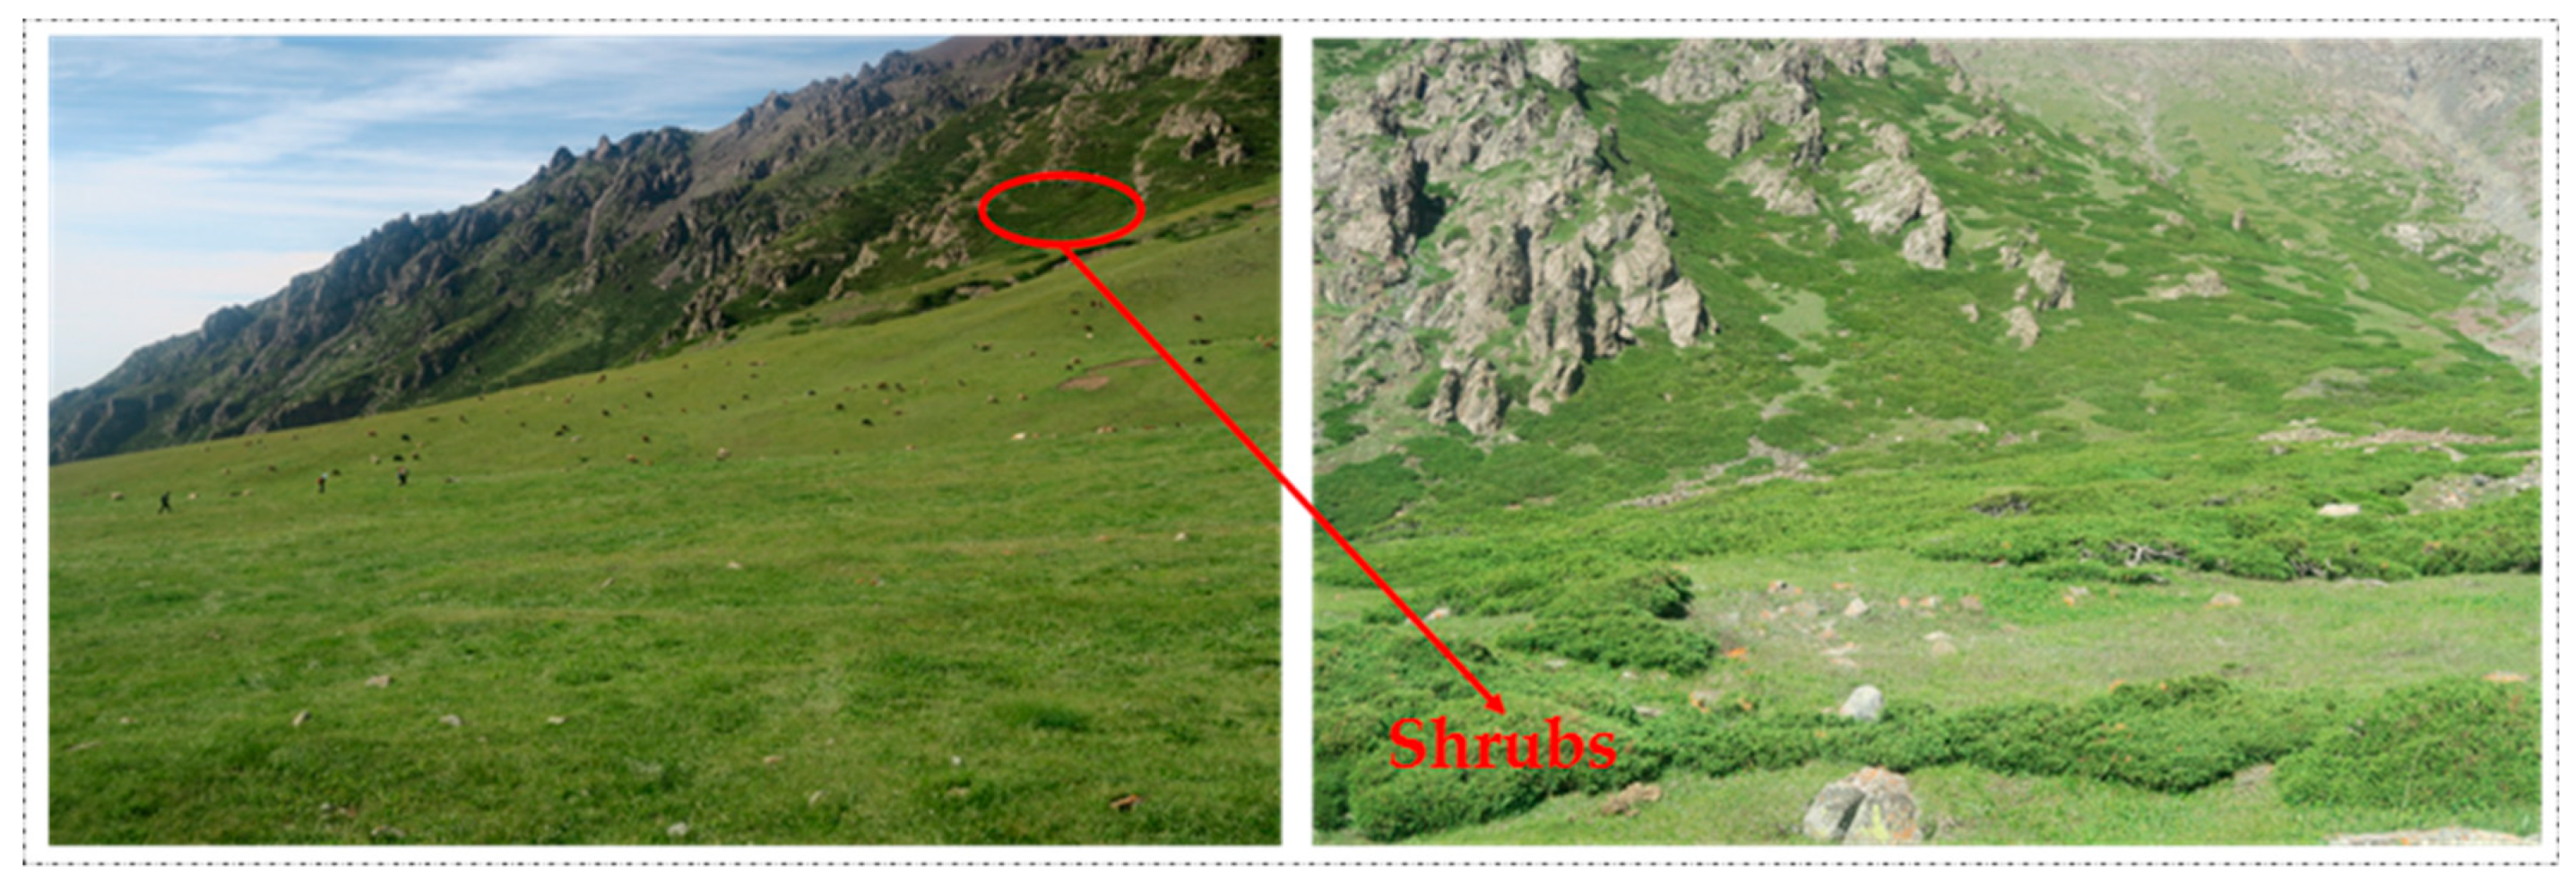
Figure 13, the area between the starting elevation and the ending elevation was the transition zone from coniferous forests to alpine meadows. Although coniferous forests and meadows co-occurred in this area, the number of coniferous forests was gradually decreasing. At the same time, the albedo increased slowly from below 0.1 to 0.1, but generally turned to the low albedo state of coniferous forests. However, above the ending elevation, there were mainly alpine meadows and a few shrubs (
Figure 14). In addition, the albedo of the shrubs is higher than that of the alpine meadows but lower than that of the coniferous forests [
76,
86], and this may explain why the albedo states can show such a trend in
Figure 12.
Therefore, elevation is a key factor in the altitudinal structure of vegetation in mountainous ecosystems [
29]. Regardless of the metric considered, the presence of two states along the elevation gradient have been found. Through field validation, it is clear that the LST index can better reveal the transition from a mountainous coniferous forest to an alpine meadow. Many researchers have confirmed that temperature is the main factor controlling the formation of the alpine tree line by using discrete survey data or experimental data [
2,
9,
10,
12]. Our results were consistent with these studies.
Traditional research on the alpine tree line has mostly focused on field survey data or literature collection data [
2,
11,
22,
23,
24]. However, on the spatial scale, if these discrete data are used to represent large mountainous systems, it will produce negative effects on the accuracy of mathematical simulation. On the temporal scale, it is difficult to form long-term data sets by a ground survey in such steep terrain because it would consume excessive human and material resources. In the past, there were few studies identifying ecosystem transitions along the elevation gradient by combining the remotely-sensed technology with the potential analysis [
21,
25,
26]. For example, in the Bogda, Ji et al. [
87] used the threshold analysis of the quantity ratios to obtain the demarcation elevation between montane coniferous forests and alpine meadows based on a scatterplot, which integrated the land cover classification (Landsat OLI data, on 28 July 2016) with the NDVI and DEM. The comparative analysis of the two studies was shown in
Table 4. Comparing the two studies, we used the potential energy model to quantitatively identify the starting and ending elevations of the transition from the mountain coniferous forests to alpine meadows and the demarcation elevation of the shift for the two states. However, in Ji’s study, the results by the probabilistic statistical analysis depend on the size of the rolling window and threshold. It is impossible to generate a transition range using their methods. Moreover, our results were better than those of Ji, according to the validation in situ.
The tree line detection is more complicated than the direct division of the elevation range (e.g., aspect, slope, substrate, facilitation mechanism, microtopography, microclimate condition, local wind, distance to ridges, seed source, and disturbances). Based on the transition of ecosystem states, our method has made little progress in the identification of the alpine tree line location, and it is necessary to deeply explore the facilitation mechanism between different ecosystem states and the disturbances caused by the climate and by humans. In some areas, the alpine tree line has been shifted by anthropogenic impact [
88] and global warming [
17,
89]. We have been to the Bogda for data acquisition and materials collection in 2017 and 2018, respectively. However, at present, we aimed to apply the method to identify the transition for the alpine tree line, without involving the change of the alpine tree line from the past to the present in this manuscript. Since remote sensing technology has gradually become an effective means to study a critical transition [
78,
90], exploring remotely-sensed indicators that have clear mechanistic links to the mountain ecosystem will facilitate the study of the altitudinal natural zone in the future.
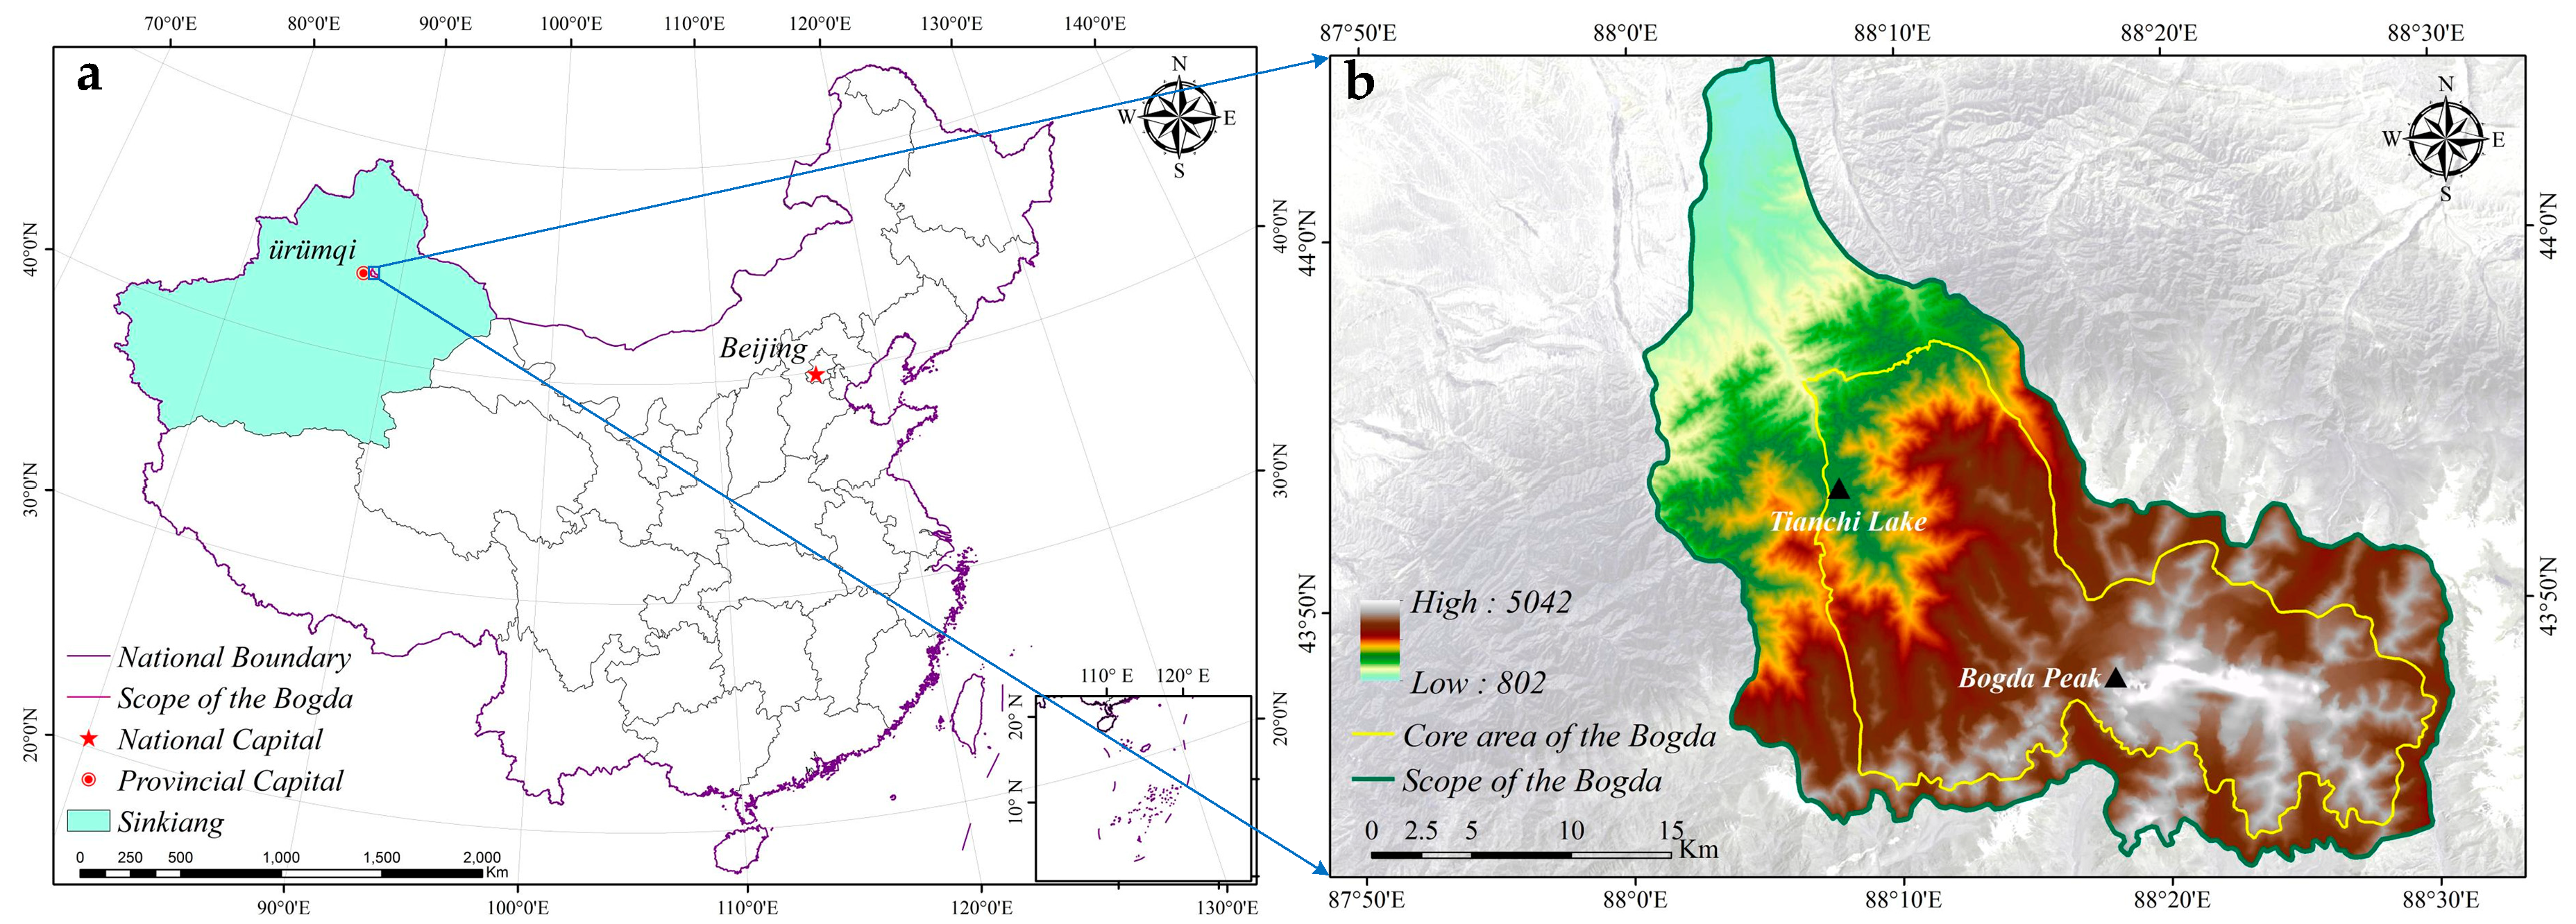
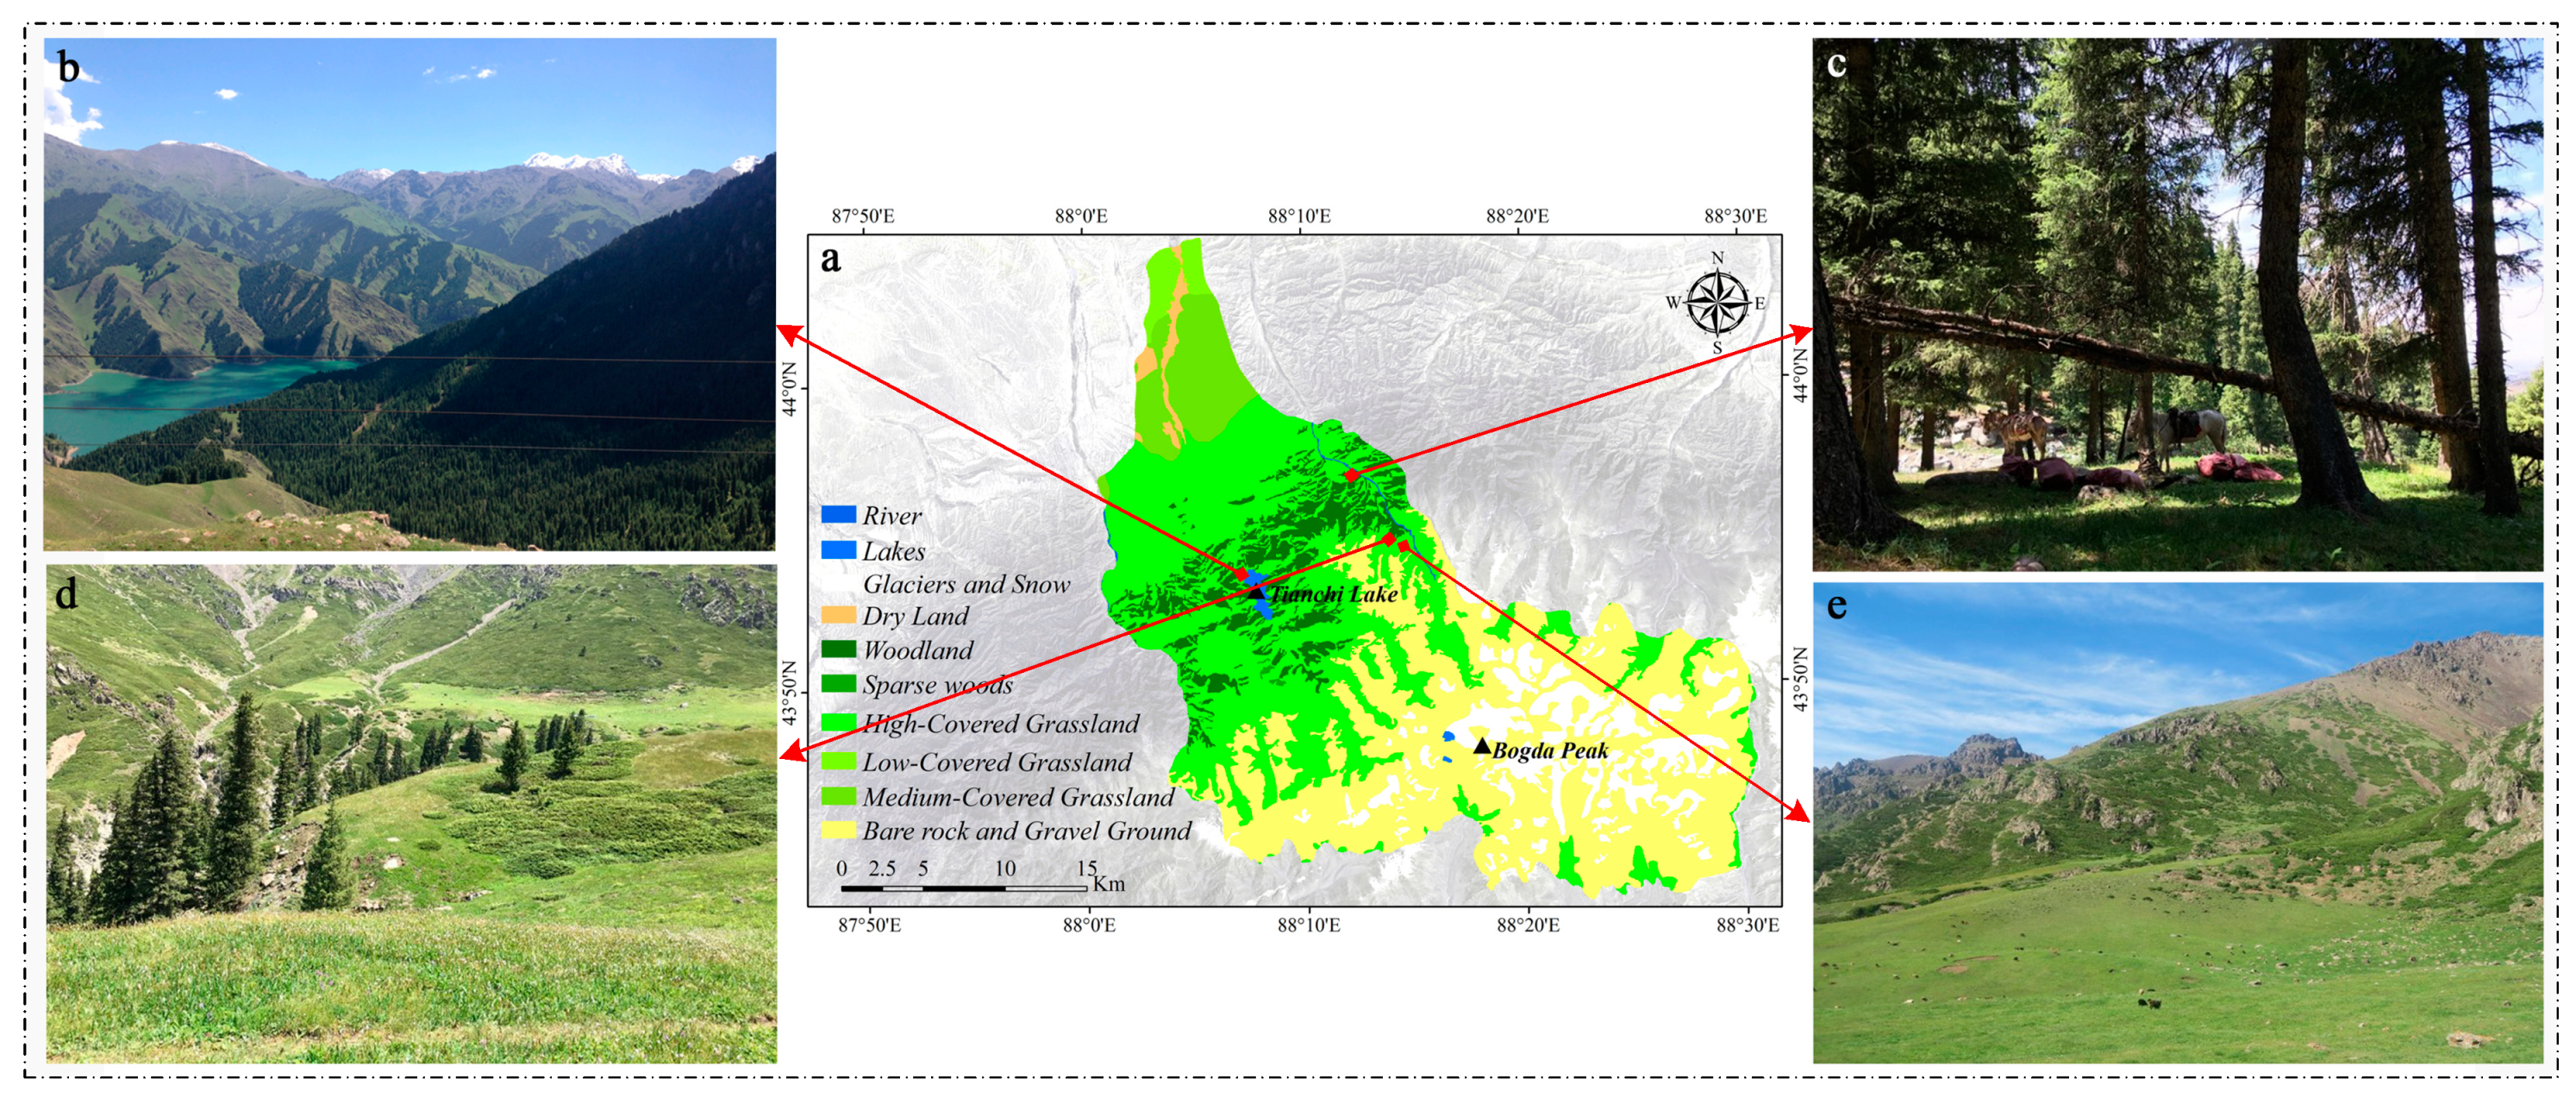
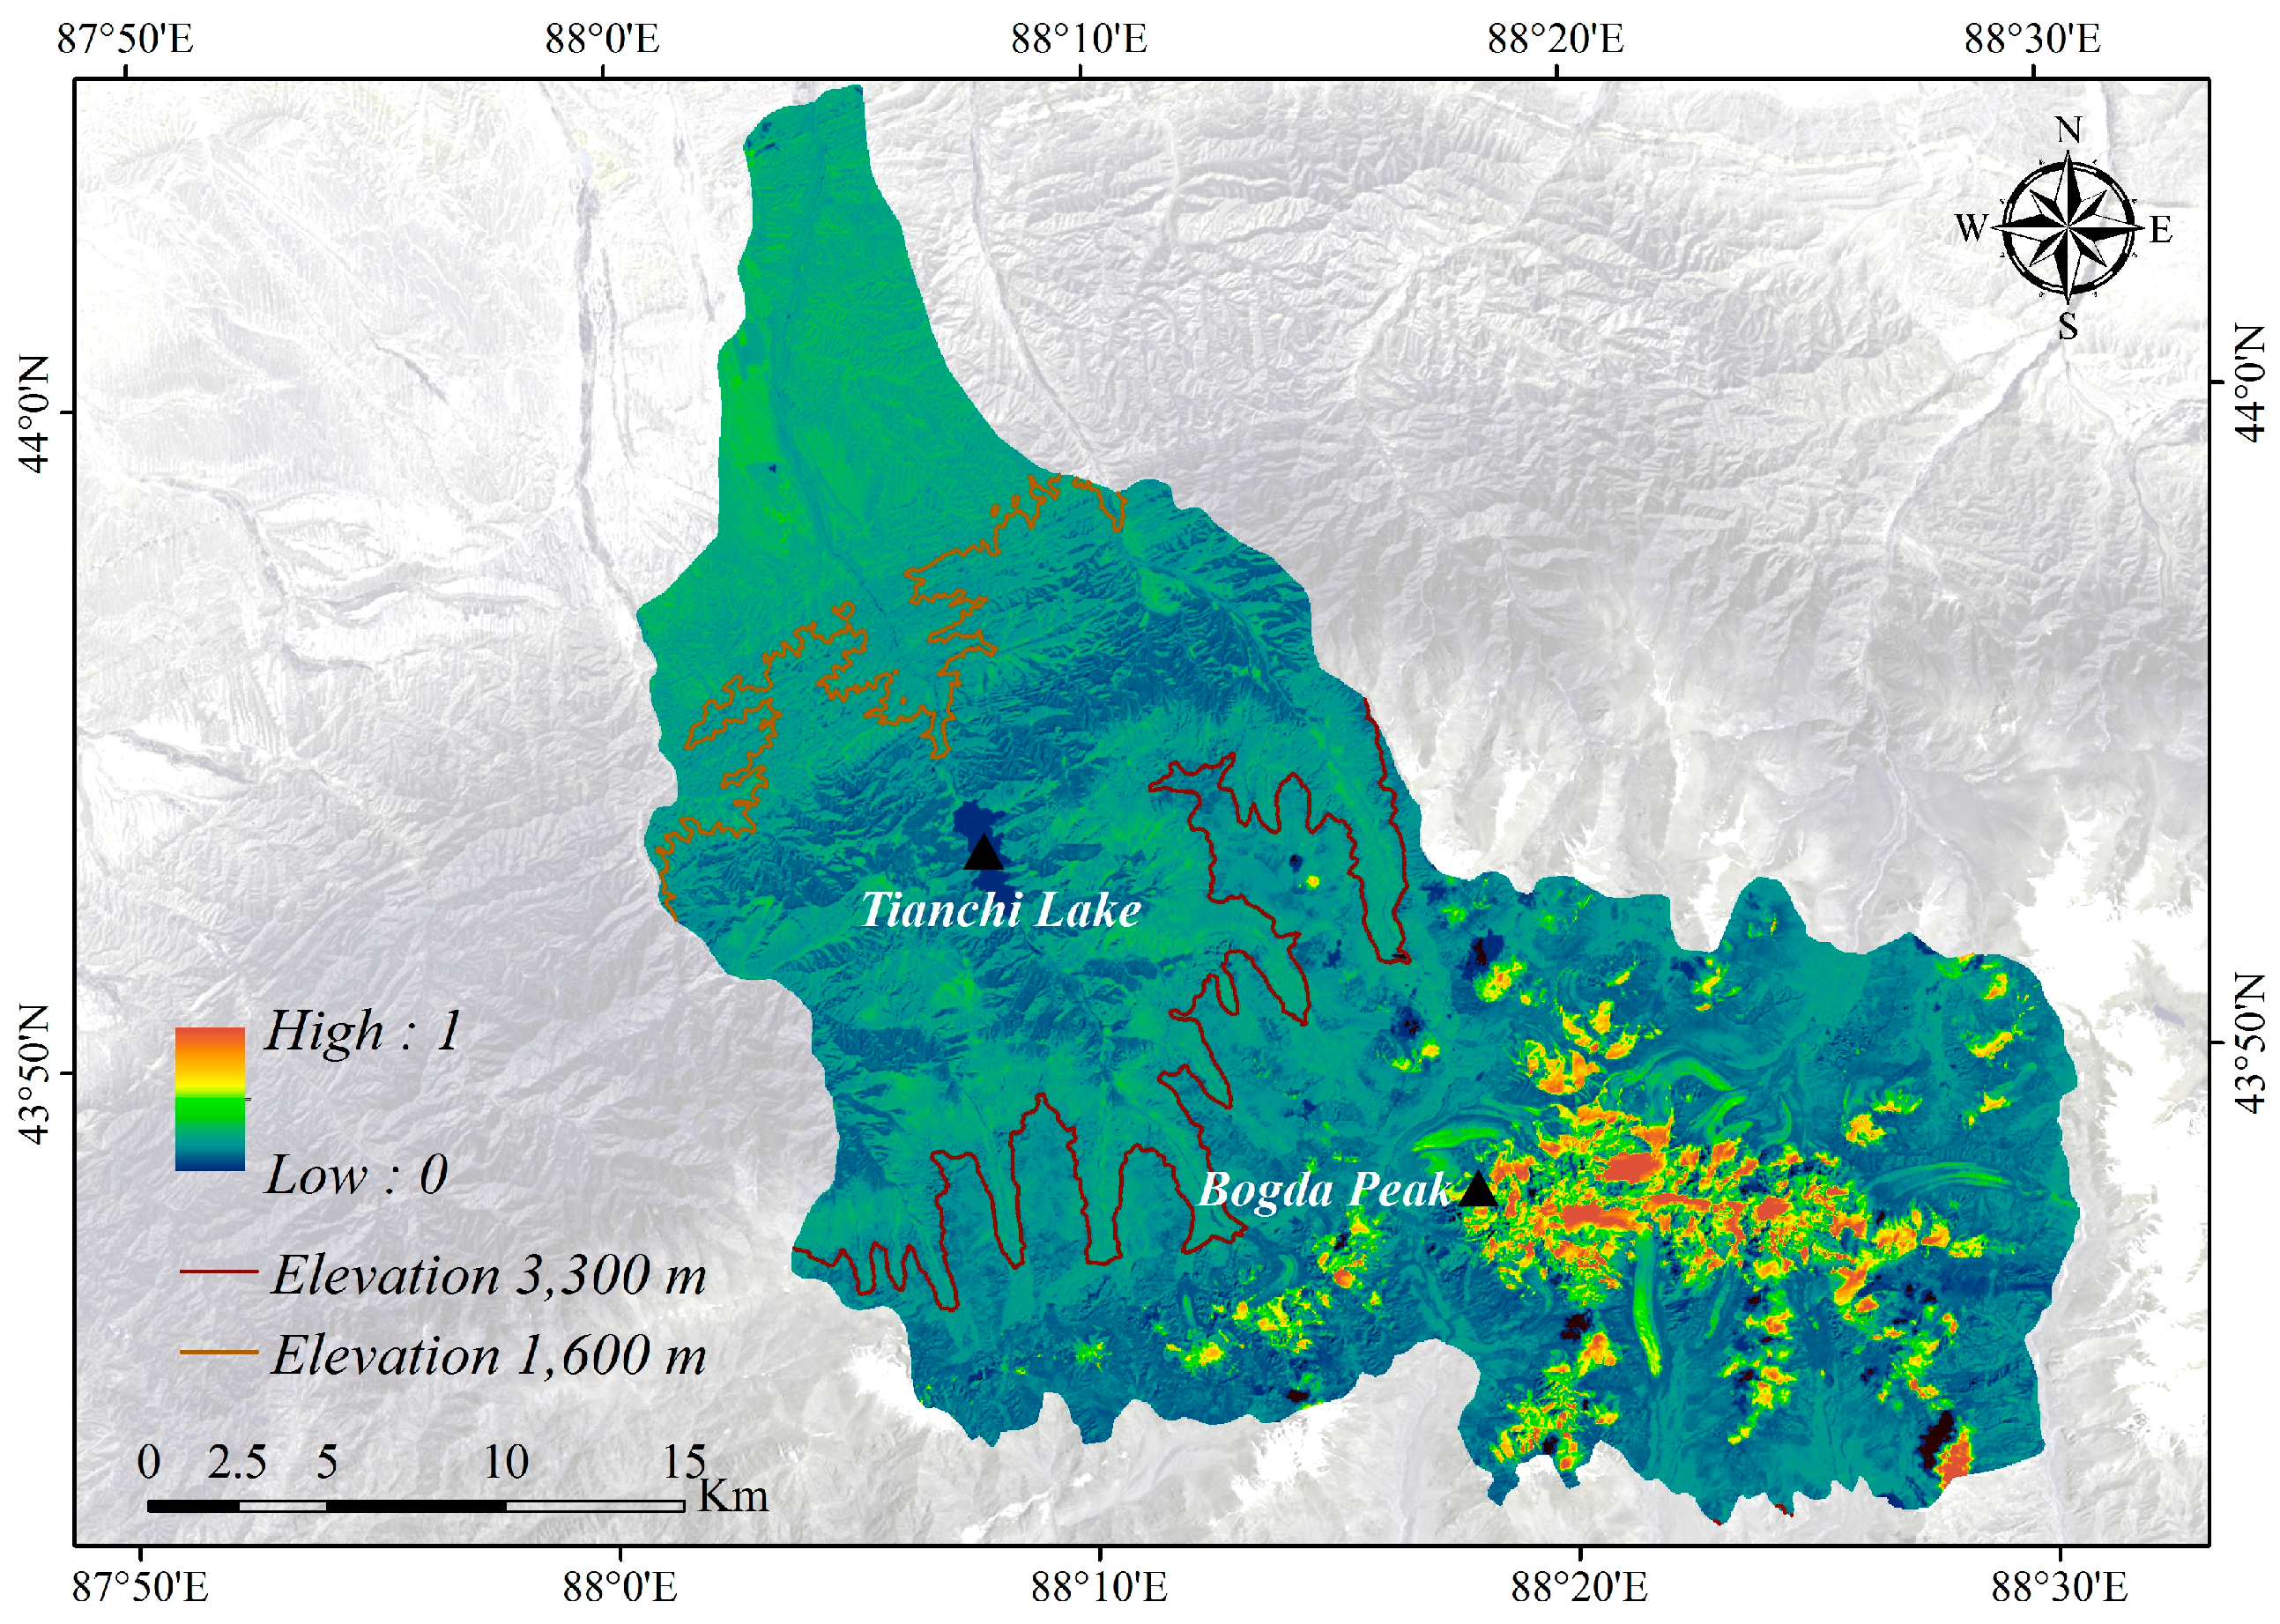
The Bogda is a typical representative of the mountainous ecosystem in temperate arid zones and has typical altitudinal natural zones in these areas [
91]. The distribution of altitudinal natural zones reflects the relationships between the biodiversity of lofty mountains in temperate arid zones and the changes in elevation, aspect, and slope. Therefore, it becomes a sensitive indicator of climate change in arid regions [
38]. Based on this research, we aim to catch a breakthrough point for identifying the location distribution of the altitudinal natural zone in the Tianshan Mountains of Central Asia, and explore the relationship with global climate change. Furthermore, this study can provide a scientific basis for the sustainable development of the World Natural Heritage Site.

 ,
, 


