2.2.1. General Considerations
A set of experimental data on the growth of a range of metal NPs by vapor-phase depositions of metal atoms on graphene was reported by Zhou et al. [
65]. In this work, the authors deposited, by thermal evaporation, Pt, Rh, Pd, Co, and Au on a graphene moiré pattern on Ru(0001). Then they performed systematic scanning tunneling microscopy studies to analyze the growth mode of the resulting NPs as a function of the amount (in unity of monolayers, ML) of deposited material and as a function of the annealing temperature of a subsequent annealing process. The authors, in particular, tried to highlight the differences observed for the various metals: in fact, their experimental data show that Pt and Rh form small particles sited at fcc sites on graphene. Instead, in similar coverage conditions, Pd and Co form larger particles. Analyzing these results, the authors conclude that the metal-carbon bond strength and metal cohesive energy are the main parameters in determining the metal clusters formation process and the morphology of the clusters in the initial stages of growth. On the other hand, experimental data on the growth of Au show a further different behavior (Au forms a single-layer film on graphene) suggesting, in this case, that other factors affect the growth of the Au cluster.
Figure 9,
Figure 10 and
Figure 11 summarize some scanning tunneling microscopy analyses of various metals deposited on the graphene/Ru(0001) substrate, as reported by Zhou et al. [
65].
In particular,
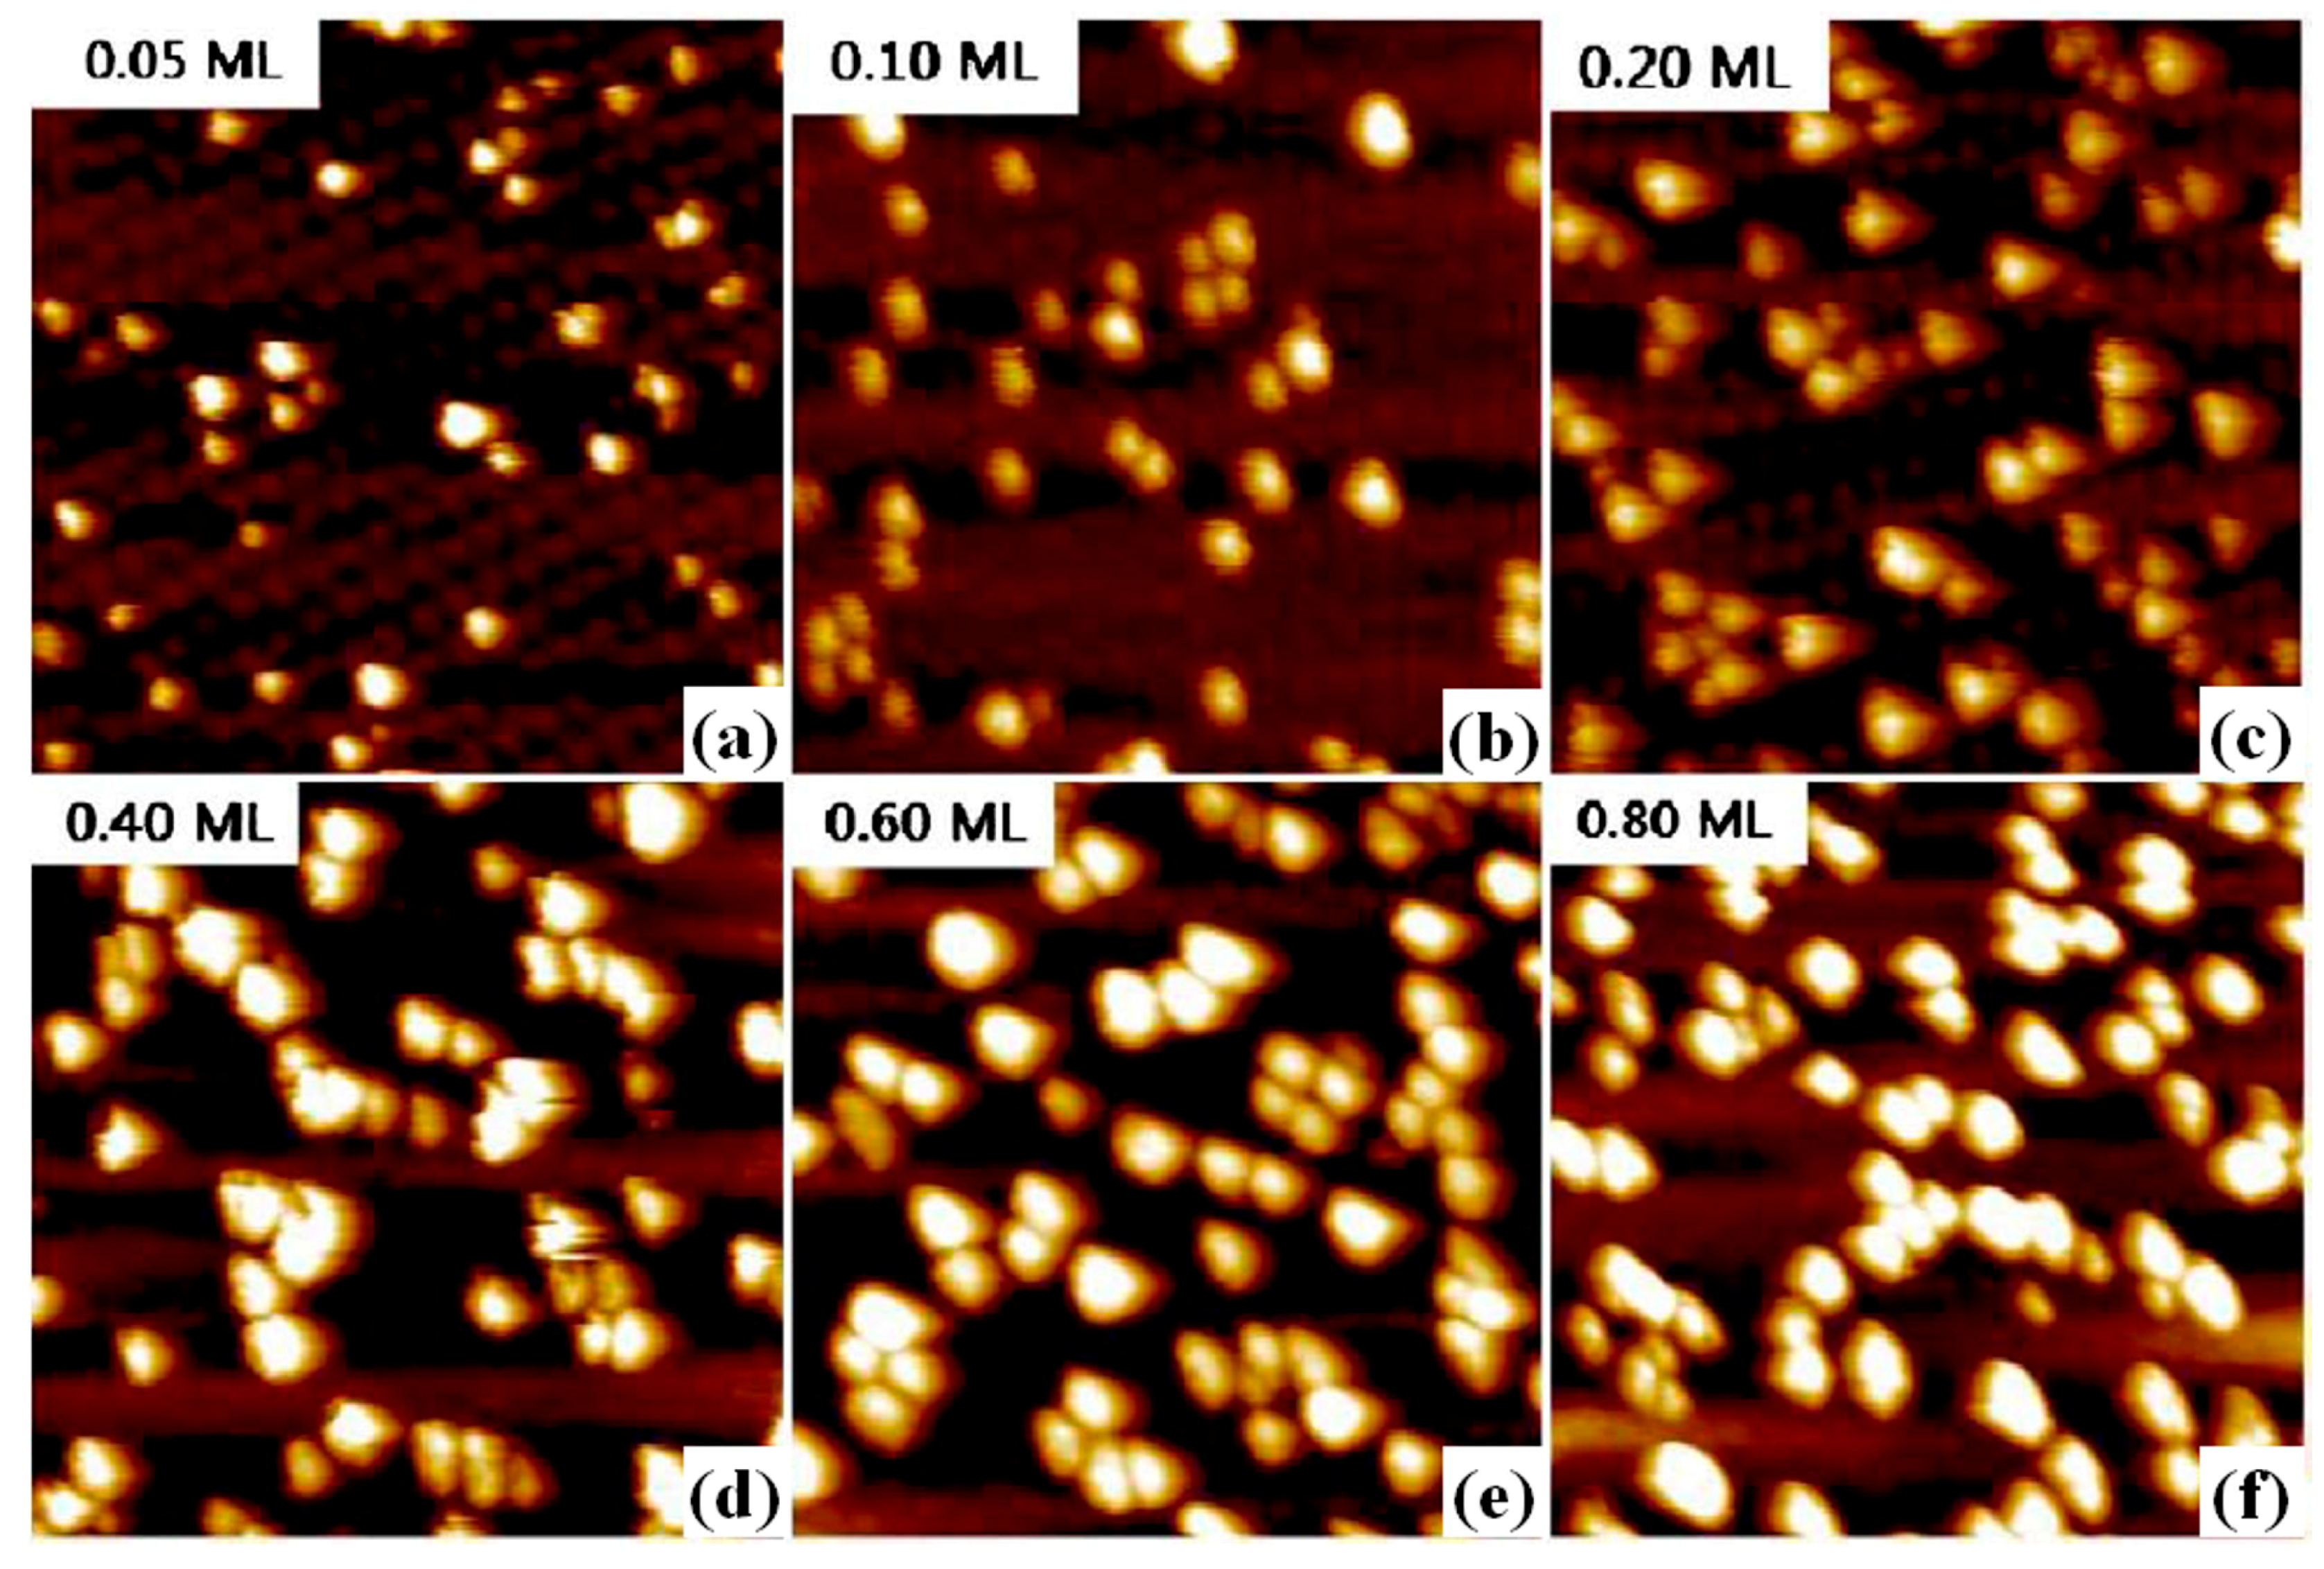
Figure 9 reports Scanning Tunneling Microscopy images for Rh deposited at room-temperature on the graphene/Ru(0001) substrates and increasing the amount of deposited Rh (from 0.05 to 0.80 ML). From a quantitative point of view, using these analyses, the authors inferred that until 0.6 ML the average Rh clusters size increases by increasing the amount of deposited Rh: the Rh cluster size and height significantly increase when the amount of deposited material increase but, correspondently, a much lower increases of the particles density is observed. Similar is the behavior of Pt: for a coverage of 0.1 ML, 2 nm-diameter highly dispersed Pt particles are formed at fcc sites; for a coverage of 1 ML, instead, 5 nm-diameter Pt particles are formed and characterized by a narrow size distribution.
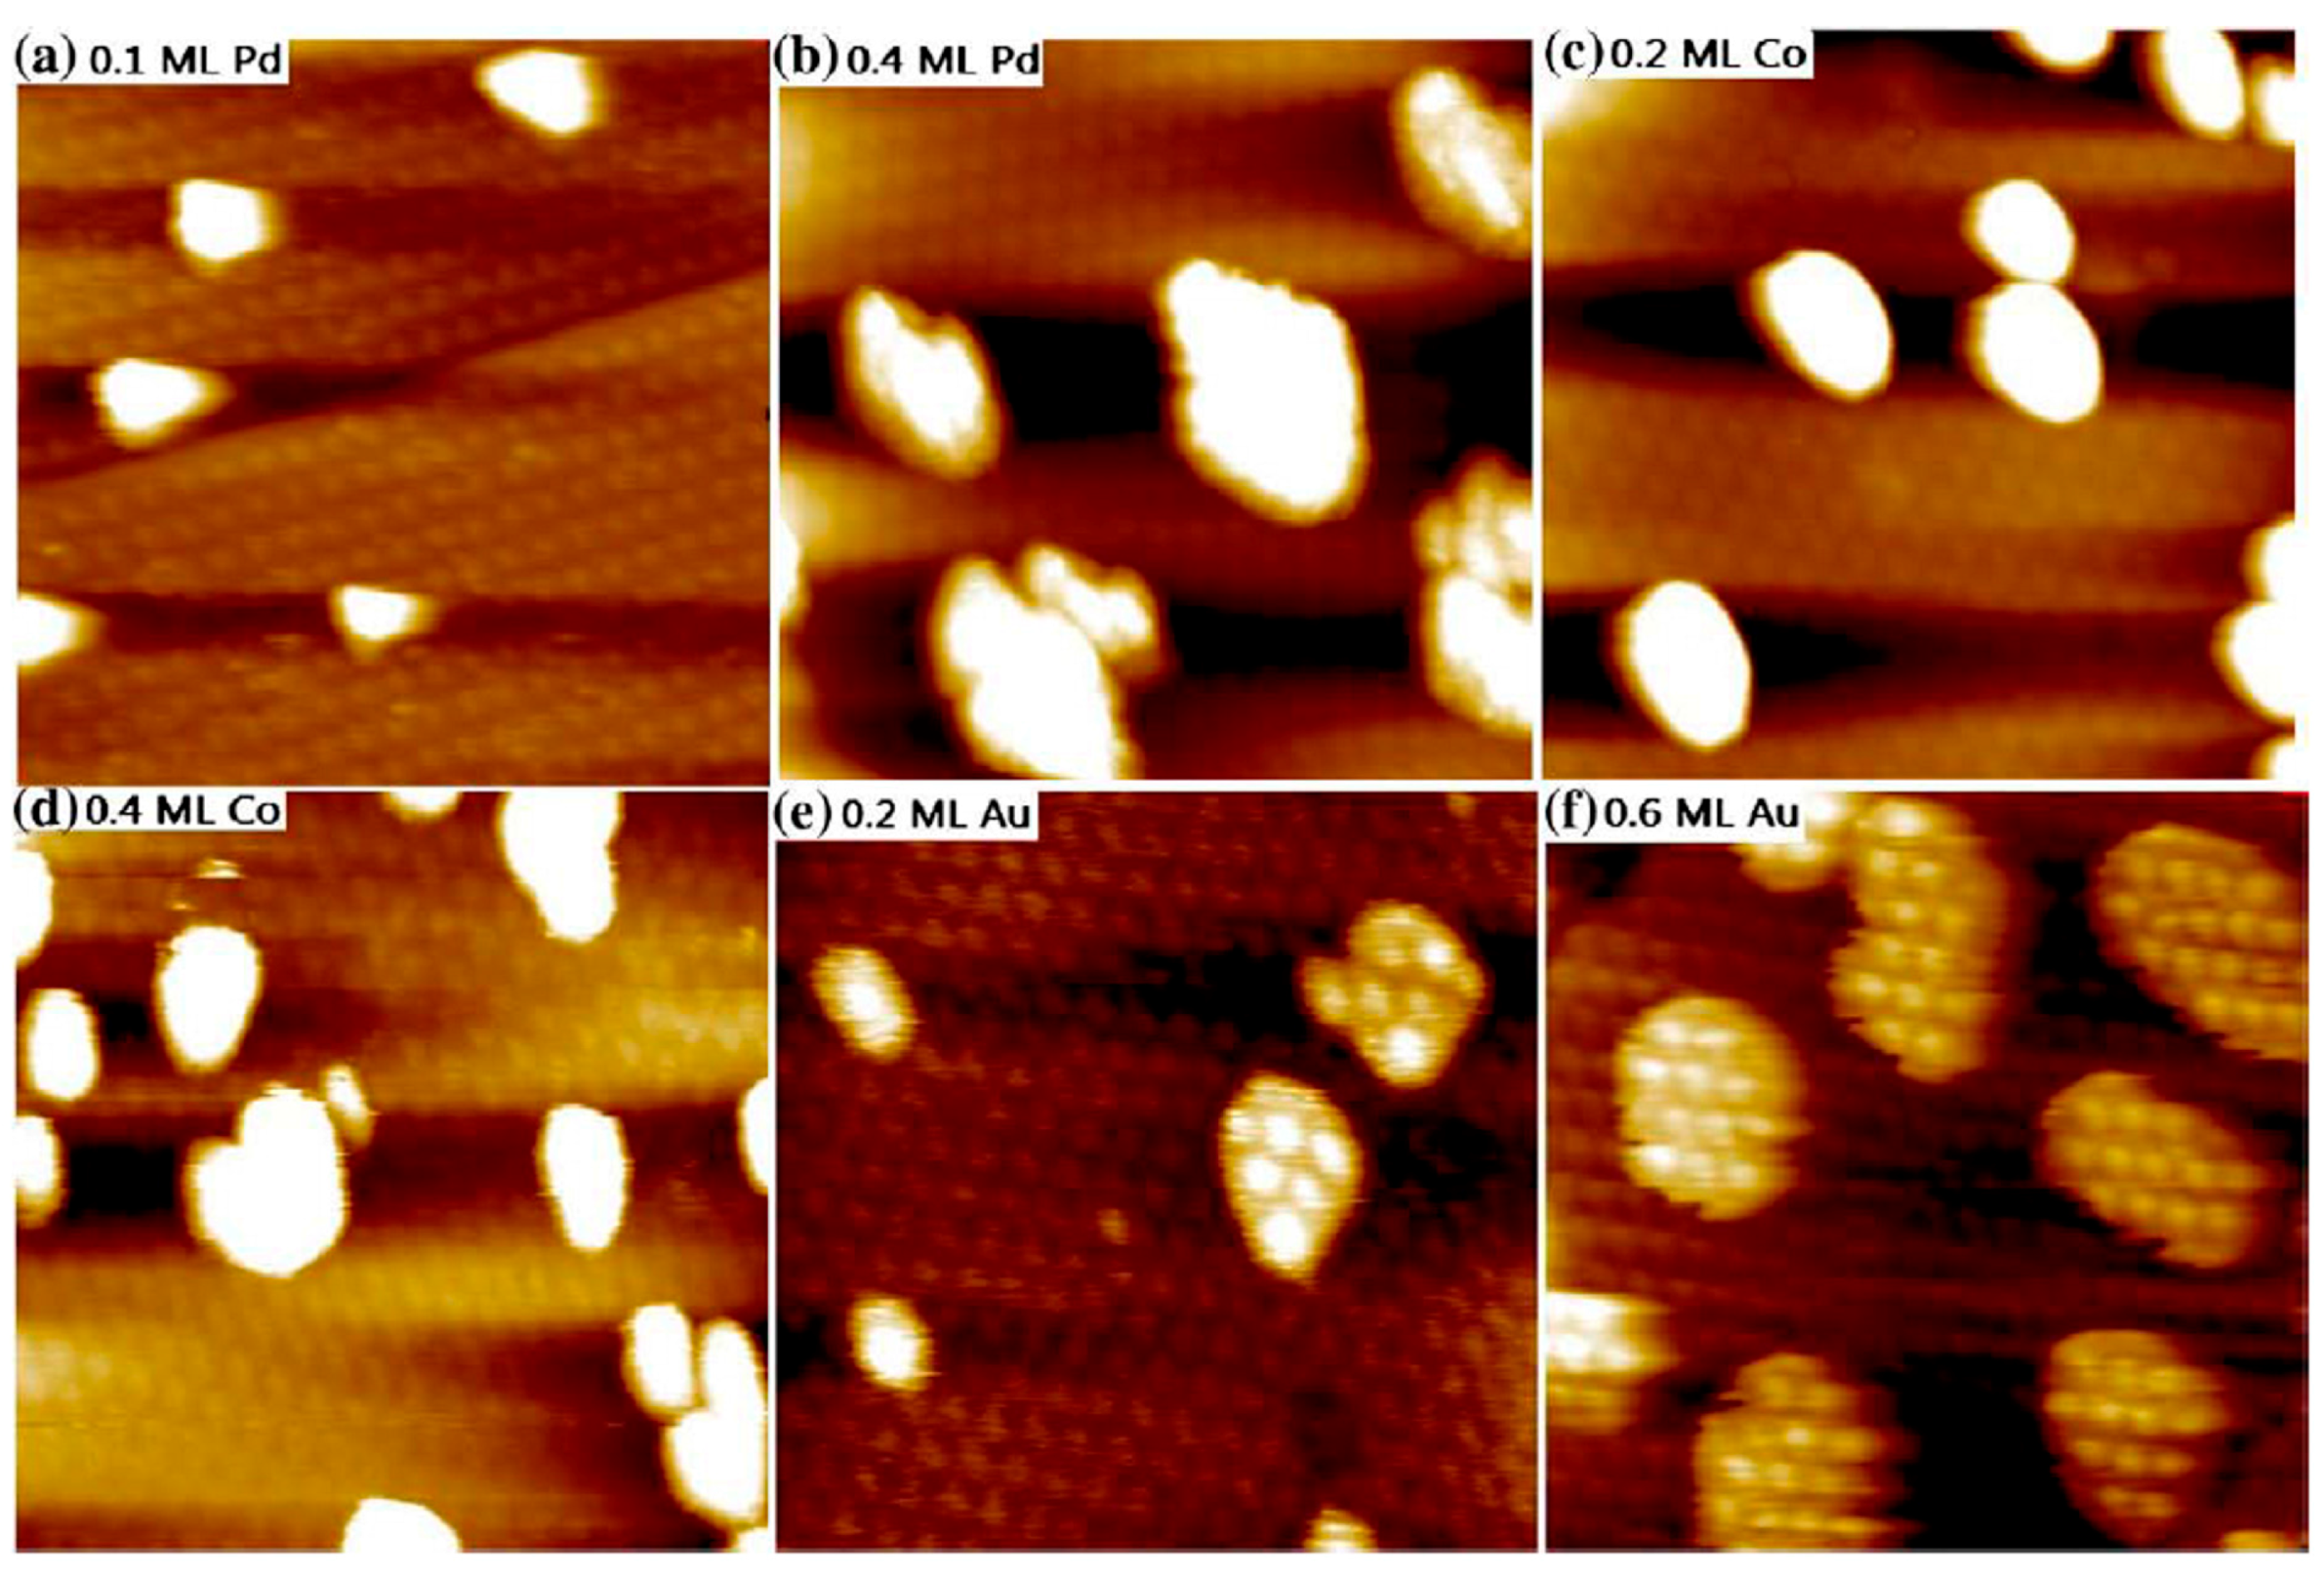
Figure 10 shows other Scanning Tunneling Microscopy images: (a) and (b) report images of 0.1 and 0.4 ML Pd deposited on graphene/Ru(0001), respectively. In this case, at a coverage of 0.1 ML, 8–14 nm-diameter three-dimensional Pd particles are formed at fcc sites and with a lower surface density compared to Rh and Pt. (c) and (d) report images of 0.2 and 0.4 ML of Co on graphene/Ru(0001). At a coverage of 0.2 ML, 10 nm-diameter three-dimensional Co particles are formed, while, at a coverage of 0.4 ML, 12 nm-diameter clusters are observed. (e) and (f) report images of 0.2 and 0.6 ML Au on graphene/Ru(0001). At 0.2 ML, small two-dimensional Au particles are formed at fcc sites. However, differently from the previous metals, increasing the coverage (0.6 ML, for example), Au forms a film of NPs covering the graphene moiré pattern. Finally,
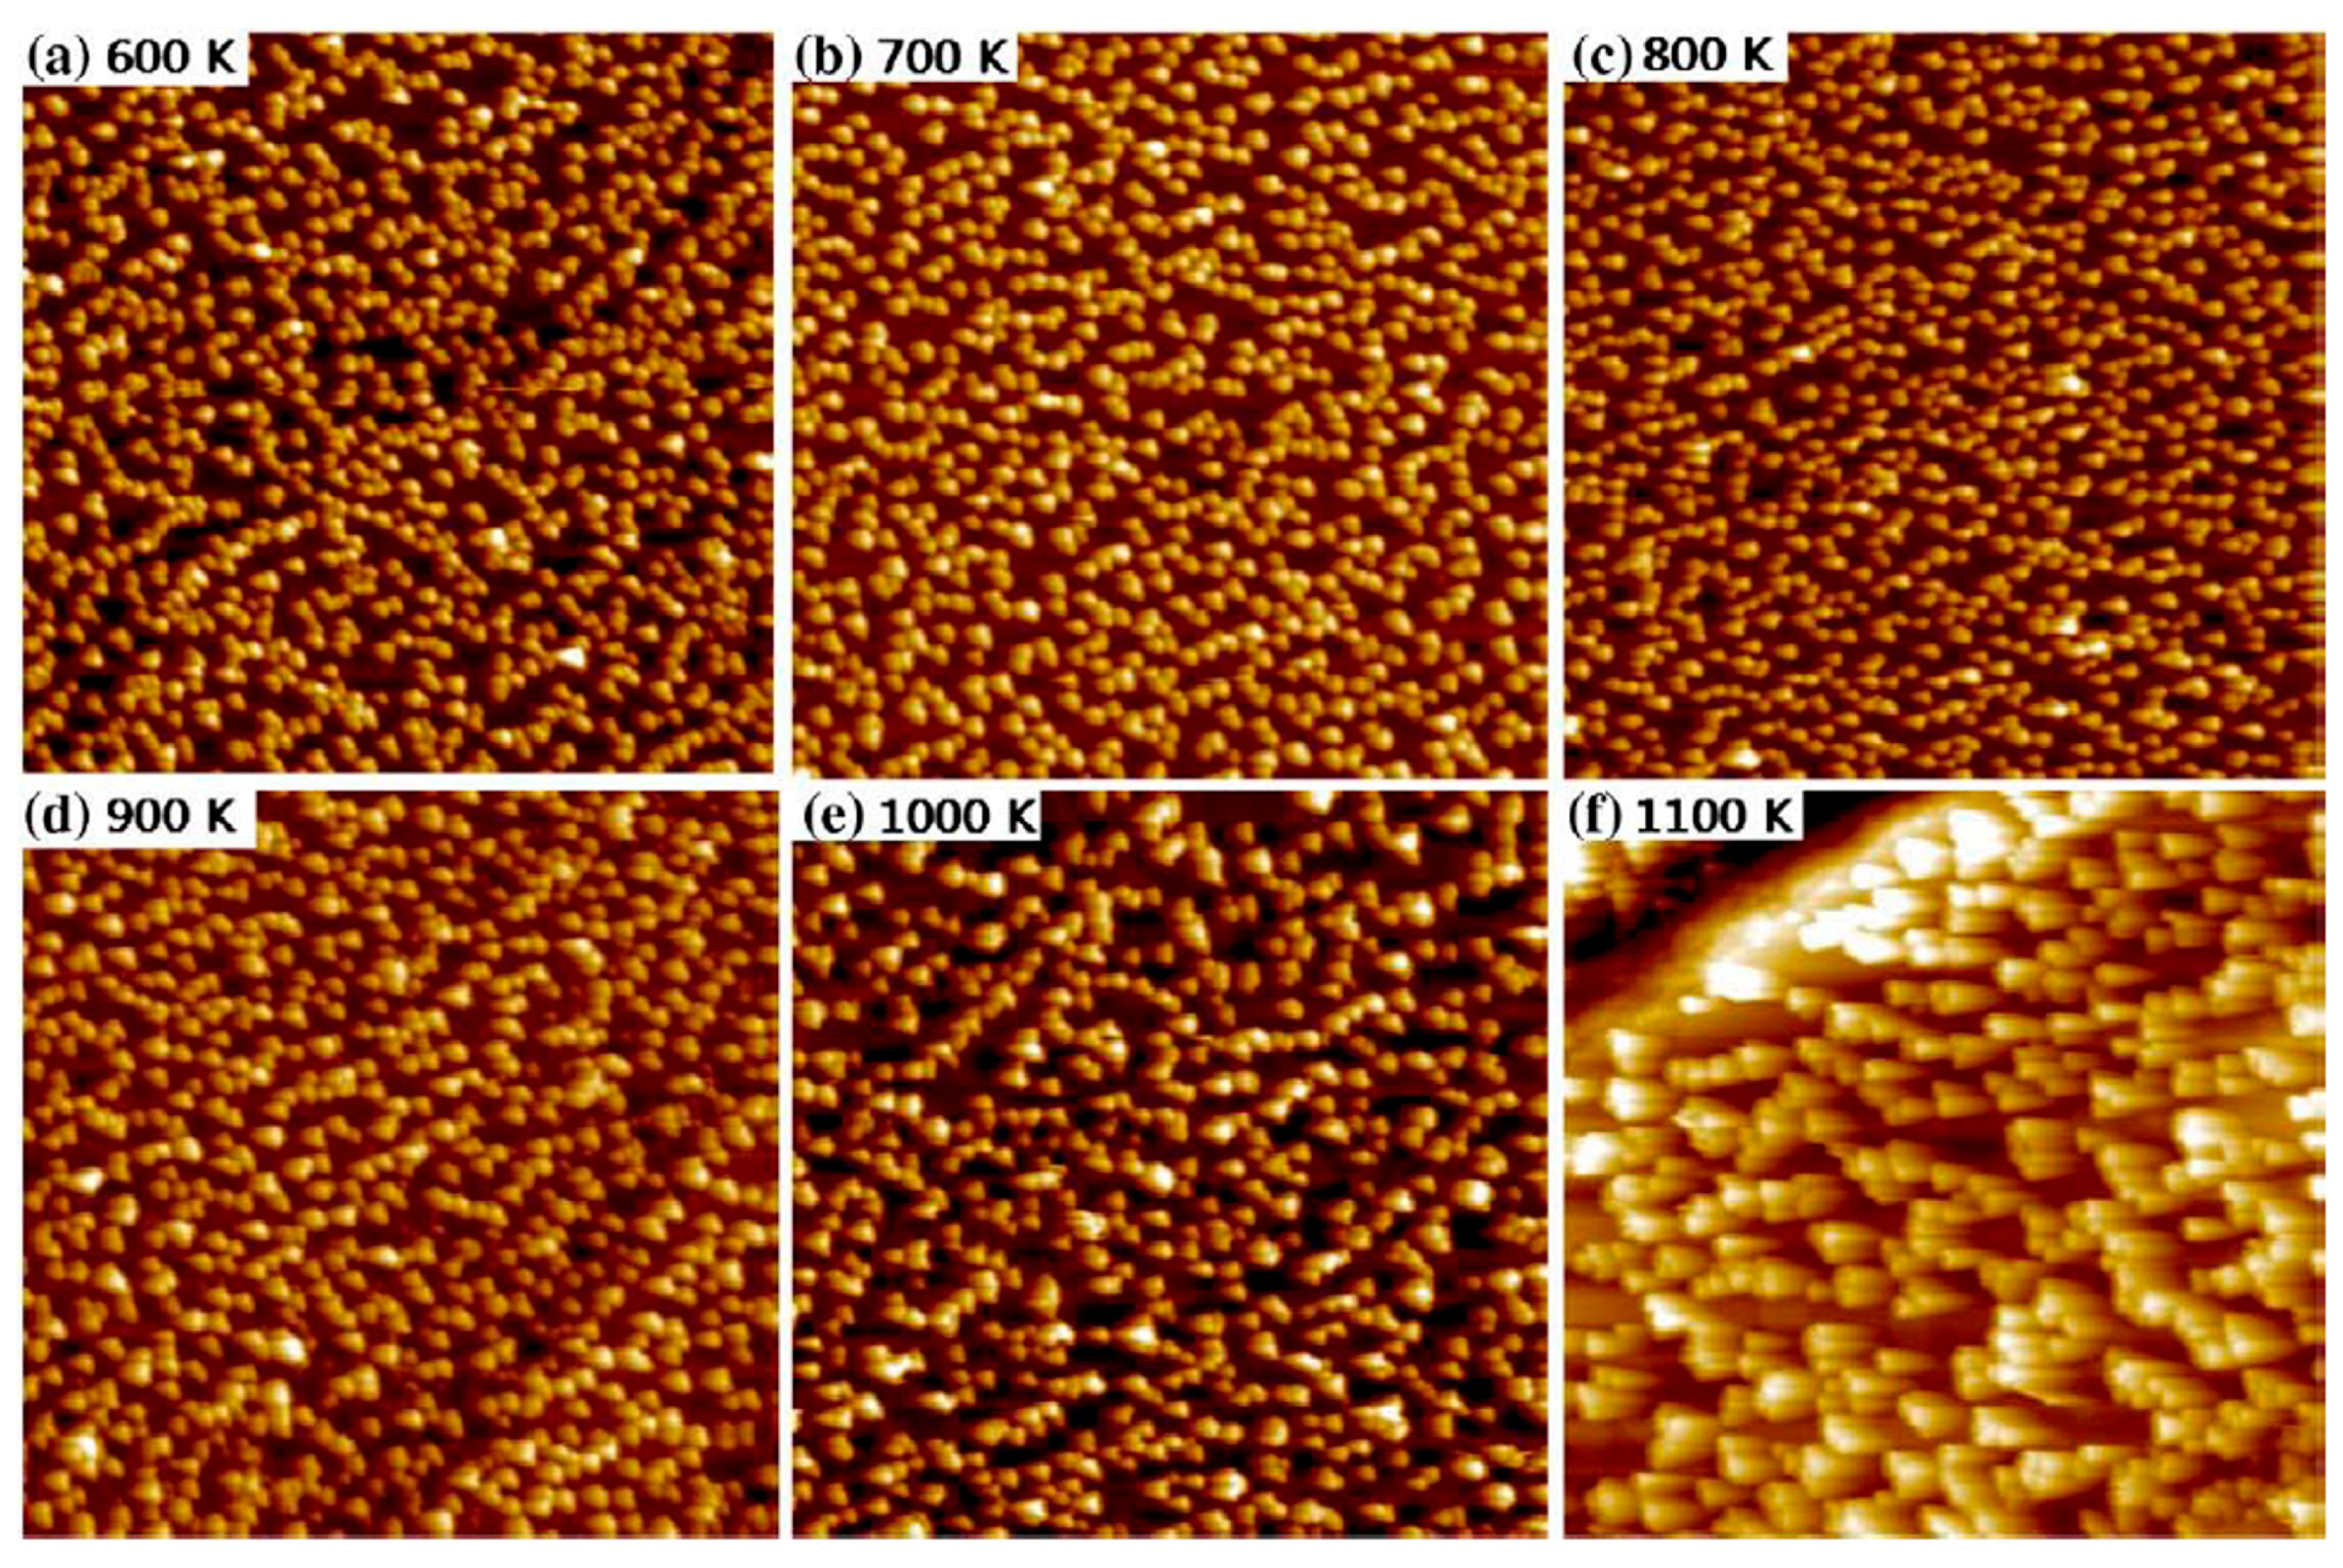
Figure 11 serves as an example to analyze the thermal stability of the nucleated NPs: it presents images of the Rh NPs on the graphene/Ru(0001) substrate after annealing process from 600 to 1100 K for 600 s. These images show that no significant change can be recognized in the Rh NPs below 900 K. Instead, a NPs coalescence process starts at ∼900 K as indicated by the decreased cluster density and larger dimensions. The NPs coalescence process is more evident after the annealing of the sample at 1100 K.
On the basis of their experimental results, Zhou et al. [
65] draw the following conclusions about the growth processes for the investigated metal NPs on the graphene/Ru(0001) substrate:
(a) Pt, Rh, Pd and Co: these metals should grow on the graphene as three-dimensional clusters due to the high difference in the surface energy of graphene (46.7 mJ/cm2) and of these metals (in the 1–2 J/cm2 range). However, the interaction between the metals adatoms and the graphene strongly influences this situation by determining the adatoms mobility. Only a small interaction energy of the adatoms with the graphene (with respect to the adatom-adatom interaction energy) will assure a high adatoms mobility and, so, the occurrence of the three-dimensional growth of the clusters.
On the basis of this consideration, the authors attribute the observed differences in the Pt, Rh, Pd and Co NPs growth morphologies to the different strengths of the metal-carbon bond. The increase of the strength of the metal-carbon bond will result in the decreasing of the diffusion coefficient for the metal on graphene at a given flux. As a consequence, the decrease of the diffusion coefficient will result in the increase of the metal clusters nucleation rate allowing to obtain, thus, uniformly dispersed the two-dimensional clusters at the initial growth stage. So, the authors note that the relevant metal-carbon dissociation energies are: 610 kJ/mol for Pt-C, 580 kJ/mol for Rh-C, 436 kJ/mol for Pd-C, and 347 kJ/mol for Co-C, so that the metals with higher bond dissociation energies (Pt and Rh) form highly dispersed clusters while those with lower bond dissociation energies (Pd and Co) form large three-dimensional clusters with low surface densities. On the other hand, however, with the continued atoms deposition, the pre-formed cluster on the graphene surface start to growth in size by incorporating the new incoming atoms and this process is competitive to the nucleation of new clusters on the surface. The joining of two or more metal atoms is characterized by the metals cohesive energy which establishes the strength of the metallic bonds. So, now, the metal-carbon dissociation energy and the metal cohesive energy become competitive parameters in establishing the final cluster growth mode and morphology. So, the authors’ picture is improved as follows [
65]: the C atoms of the graphene strongly interact with Pt and Rh atoms, largely influencing the initial growth stage leading to the formation of uniformly distributed small particles. On the other hand, the bond strength of Pd and Co atoms to the C atoms is much weaker, so that the metals cohesive energy drive the NPs formation and growth, resulting in the formation of large three-dimensional clusters at initial growth stage.
(b) Effect of the substrate supporting the graphene: in their analysis, Zhou et al. [
65] compared their results with other literature results. For example, they compared their results on the growth of Pt on graphene/Ru(0001) with the results of N’Daye et al. [
61,
64] on the growth of Pt on graphene/Ir(111) in similar conditions of depositions. They highlight some crucial differences in the growth morphology of the Pt clusters and impute these differences to the specific interaction of the metal atoms with the substrate supporting the graphene layer. In summary, Zhou et al. [
65] report that the equilibrium spacing between graphene and the Ir(111) surface has been calculated to be 0.34 nm. Instead, the equilibrium spacing between the graphene and the Ru(0001) surface has been calculated to be 0.145 nm. This difference arises from the higher interaction of the graphene with the Ru(0001) than with Ir(111). Thus, in general, increasing the interaction energy between the C atoms of the graphene layer with the substrate on which it is supported, will lead to a decrease in the interaction energy between the C atoms and the deposited metal adatoms. This will result in an increased metal adatoms diffusivity. The consequence is that the metal clusters grown on graphene/Ir(111) are spatially more ordered than on graphene/Ru(0001) and that the transition from two-dimensional to three-dimensional morphology of clusters on graphene/Ru(0001) occurs at much lower amount of deposited material.
(c) Au: due to the weak interaction between Au and C, Au is expected, so, to grow on graphene as three-dimensional isolated Au clusters. Instead, Zhou et al. [
65] observed that Au on graphene/Ru(0001) forms a continuous nano-granular film. They attribute this behavior, mainly, to the low Au cohesive energy (i.e., Au tends to wet a metal surface with a larger cohesive energy. Note that the Au cohesive energy is 3.81 eV whereas, for example, the Pt cohesive energy is 5.84 eV). In addition, the nearest-neighbor distance for Au is 0.288 nm which is larger than the graphene lattice parameter (0.245 nm). N’Diaye et al. [
61,
64] inferred that metal with a nearest-neighbor distance of 0.27 nm can perfectly fit the graphene lattice. So, Au atoms do not fit the graphene lattice, contributing to the lowering of the Au-C interaction energy. Therefore, the Au low cohesive energy and the low Au-C interaction energy contribute in determining the atypical Au growth.
In addition to Zhou et al. [
65], N’Diaye et al. [
61,
64] reported another set of experimental analyses on the growth morphologies of Ir, Pt, W, and Re on graphene/Ir(111) and then Feibelman [
75,
76] reported additional theoretical analyses on the experimental results of N’Diaye et al.
The main results of N’Diaye et al. [
64] rely in the establishment of the condition for which a metal form a superlattice on the graphene/Ir(111) substrate: (1) A large metal cohesive energy; (2) a high interaction energy of the deposited metal atoms with graphene established by the large extension of a localized valence orbital of the deposited metal; and (3) the fitting between the graphene lattice parameter and the nearest-neighbor distance of the deposited metal. In the course of their studies, N’Diaye et al. [
64] were able, in addition, to infer several characteristics on the metals growth morphology. From an experimental point of view, first of all, the authors choose to deposit materials with very different cohesive energy so to study the impact of this parameter on their growth morphology. In fact, the cohesive energy for W, Re, Ir and Pt is, respectively, 8.90, 8.03, 6.94, 5.84 eV.
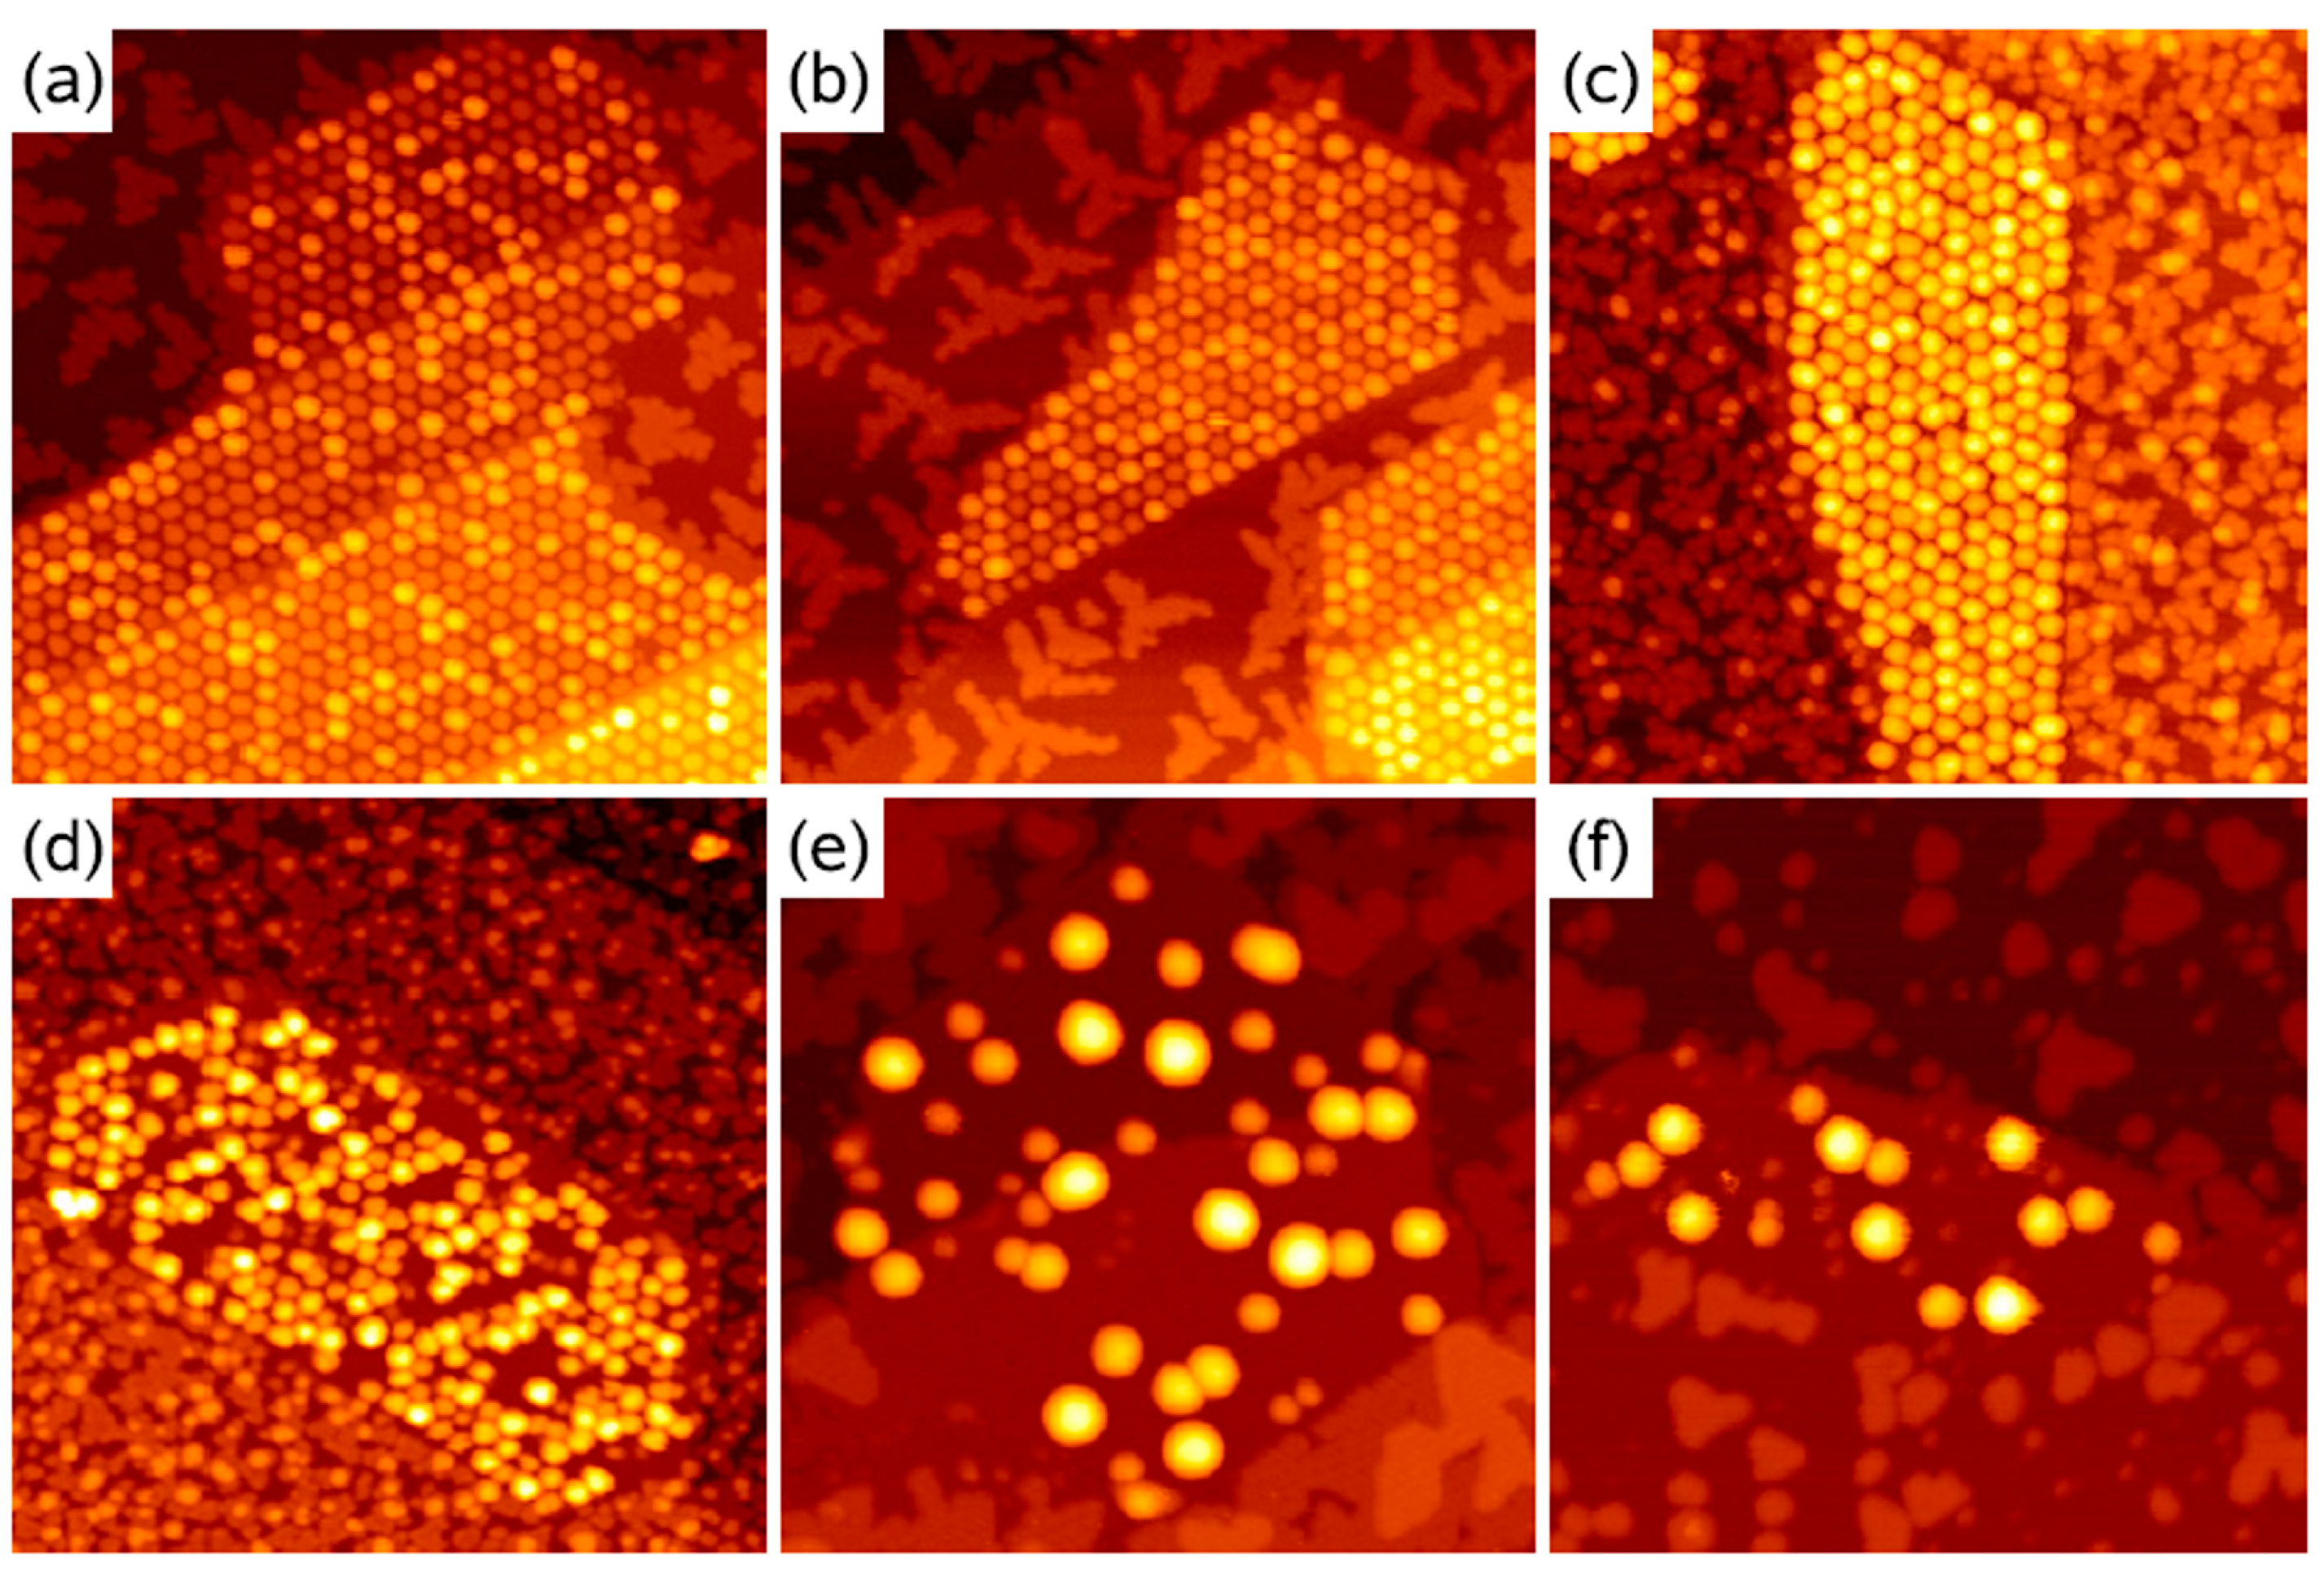
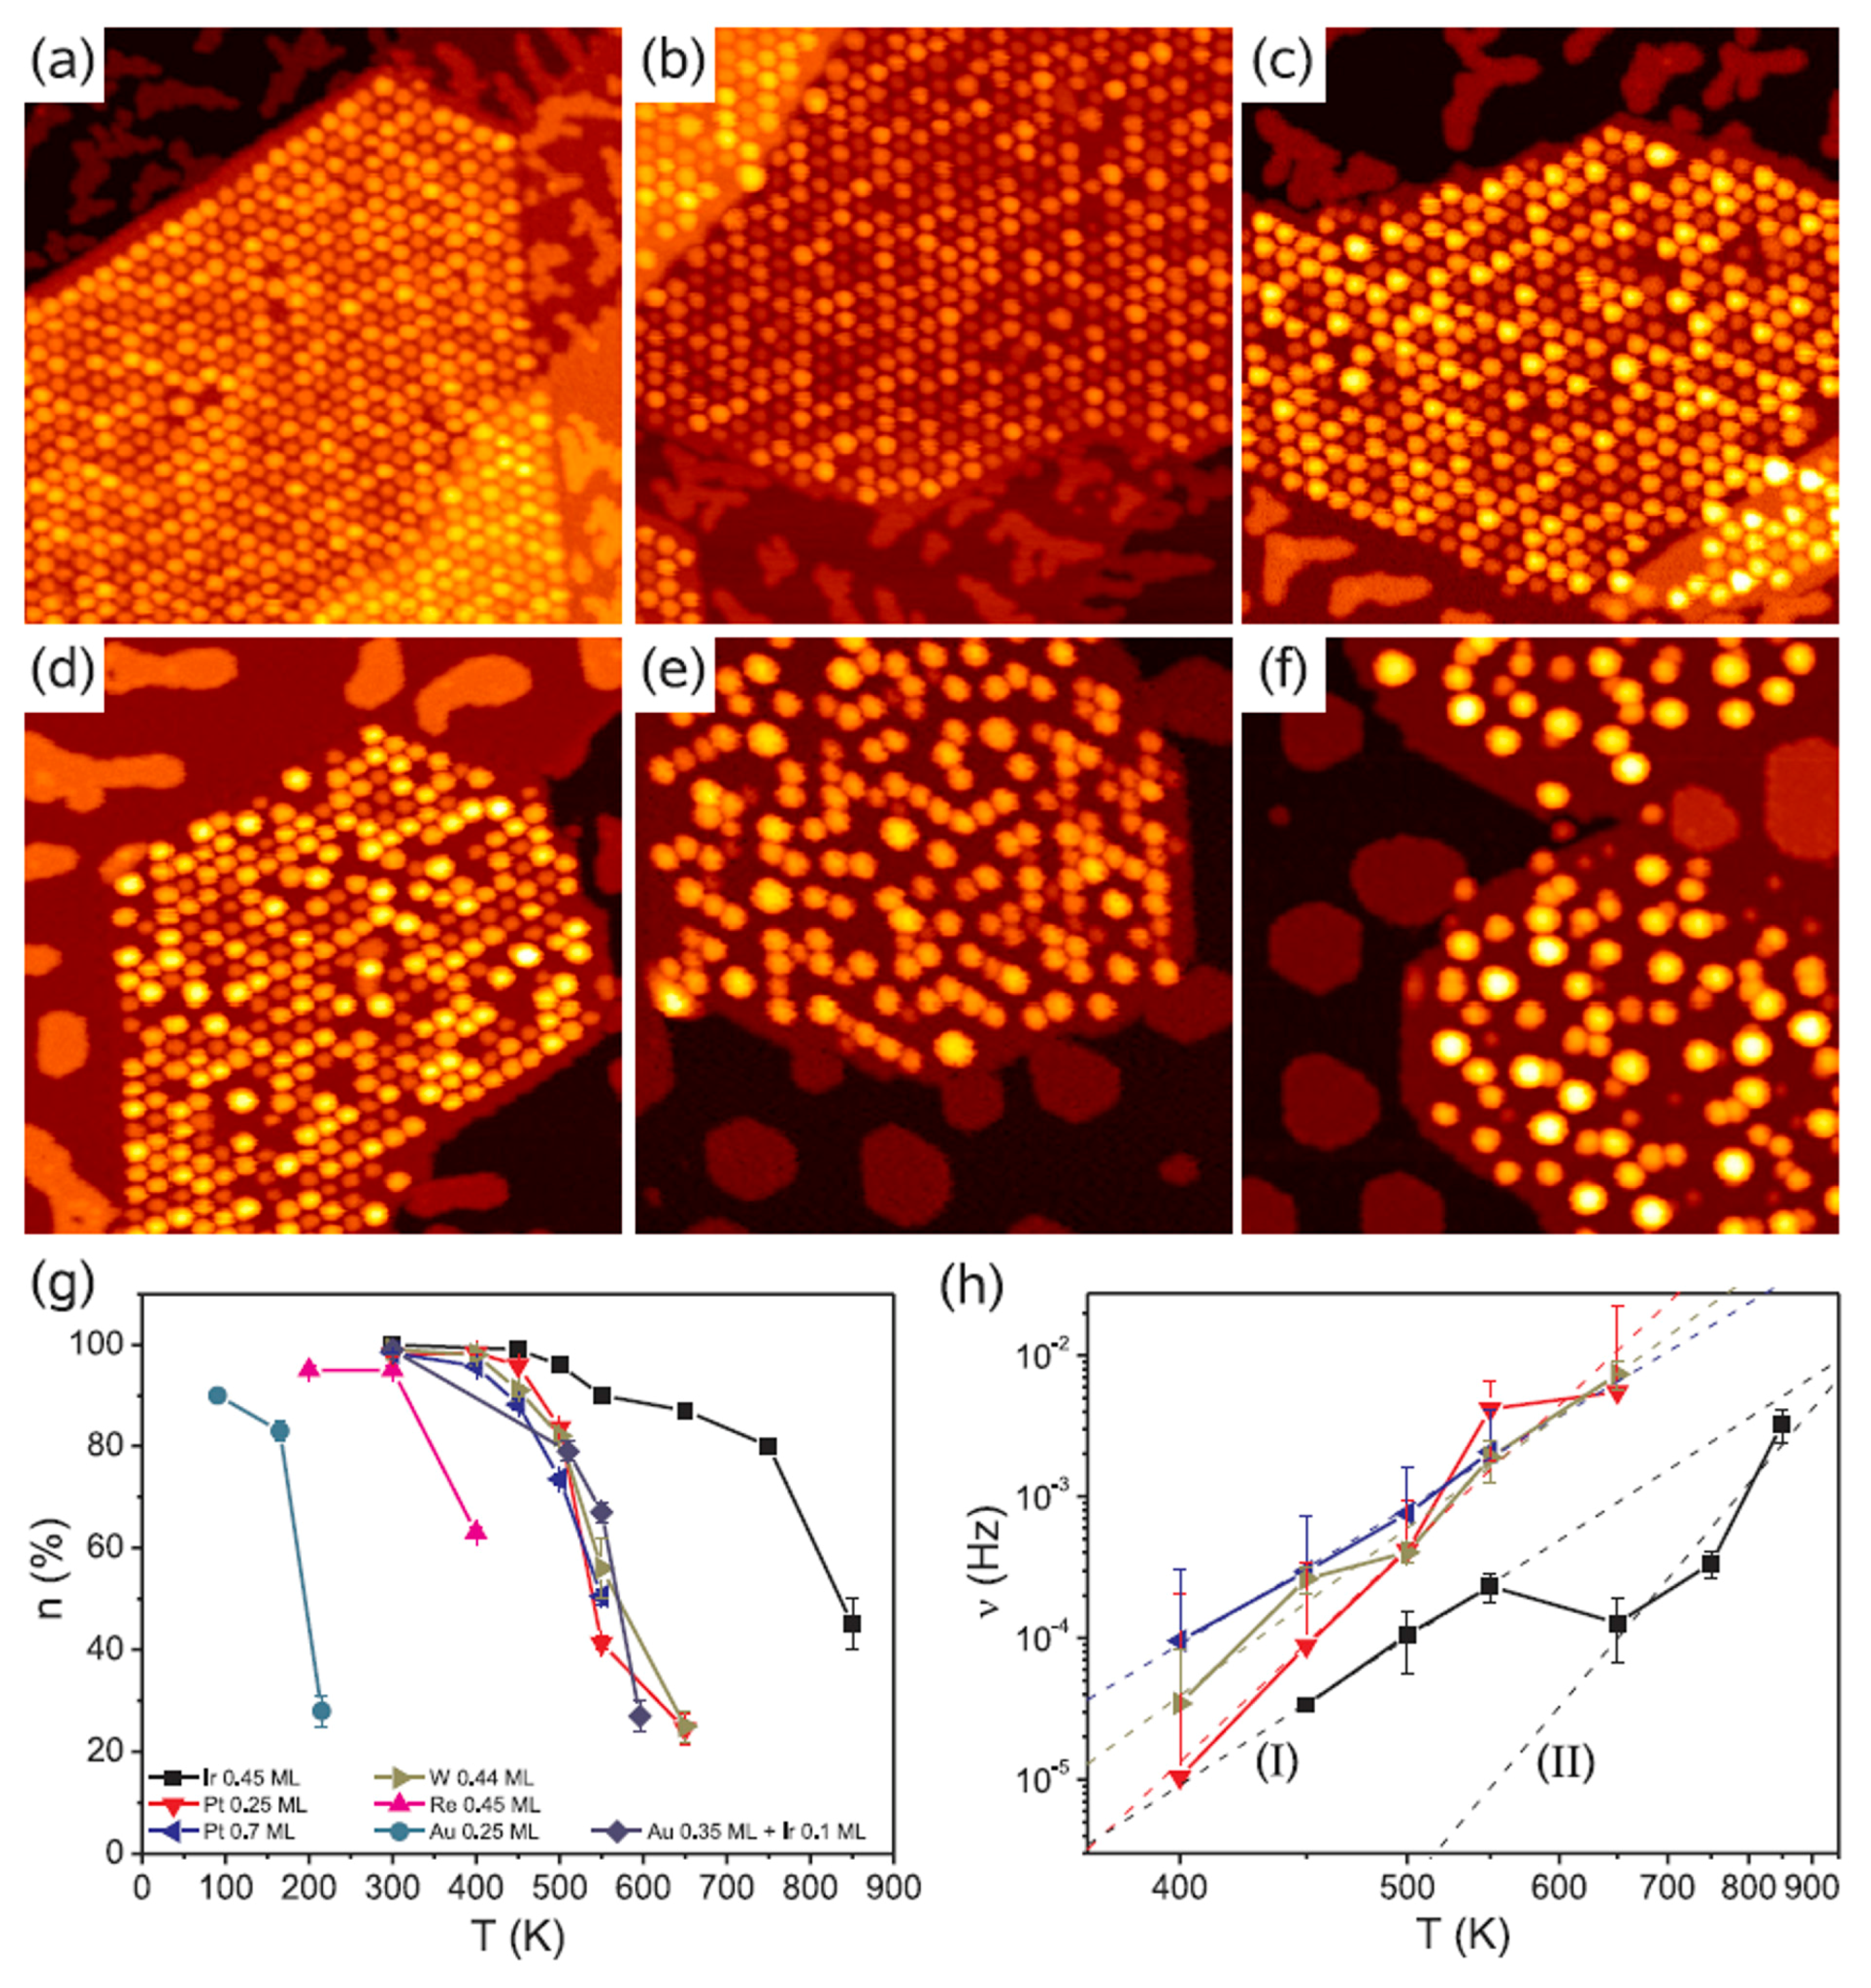
Figure 12 shows, for example, Scanning Tunneling Microscopies of graphene flakes grown on Ir(111) after deposition, at room-temperature, of 0.2–0.8 ML of various metals. In the areas without graphene, metals form some isolated islands of monolayer height. All deposited materials are pinned to graphene flakes forming NPs. Ir and Pt form similar very ordered superlattices of clusters on the graphene flakes (compare
Figure 12a,b). At 0.2 ML both materials exhibit two distinct height levels of the clusters. Also W forms an ordered cluster superlattice (see
Figure 12c), however with higher height than that obtained for Ir. These W clusters present distinct height levels. A lower spatial order is obtained, instead, for Re clusters as visible by
Figure 12d. For Fe (
Figure 12e) and Au (
Figure 12f) clusters the spatial order is completely absent so that no superlattice is obtained. The authors attribute the absence of the regular cluster superlattice for these metals to their small cohesive energy and/or small binding energy to graphene: metals with small cohesive energy present a more pronounced wetting behavior on graphene with respect to metal with higher cohesive energy (i.e., metals with small cohesive energy have lower surface energy than the metals with higher cohesive energy). Metals with low bonding strength to graphene present high mobility (with respect to metals with higher bonding strength) so that graphene is not able to trap efficiently these adatoms and small clusters). The authors verified [
64] these conclusions by depositing Re, Au and Fe on the graphene/Ir(111) substrate at lower temperatures (200 K), so to decrease the adatoms diffusivity. In this case the formation of the superlattices structures for the Re, Au, and Fe clusters was observed.
Then, the authors investigated the effect of a subsequent annealing process on the morphology and order of the deposited metal clusters. Some results are reported in
Figure 13: it reports the Scanning Tunneling Microscopies of Pt deposited on the graphene/Ir(111) substrate and annealed for 300 s from 350 K to 650 K.
Figure 13g quantifies the annealing effect by plotting the temperature dependence of the moiré unit cell occupation probability n as a function of the annealing temperature T for all the investigated metals.
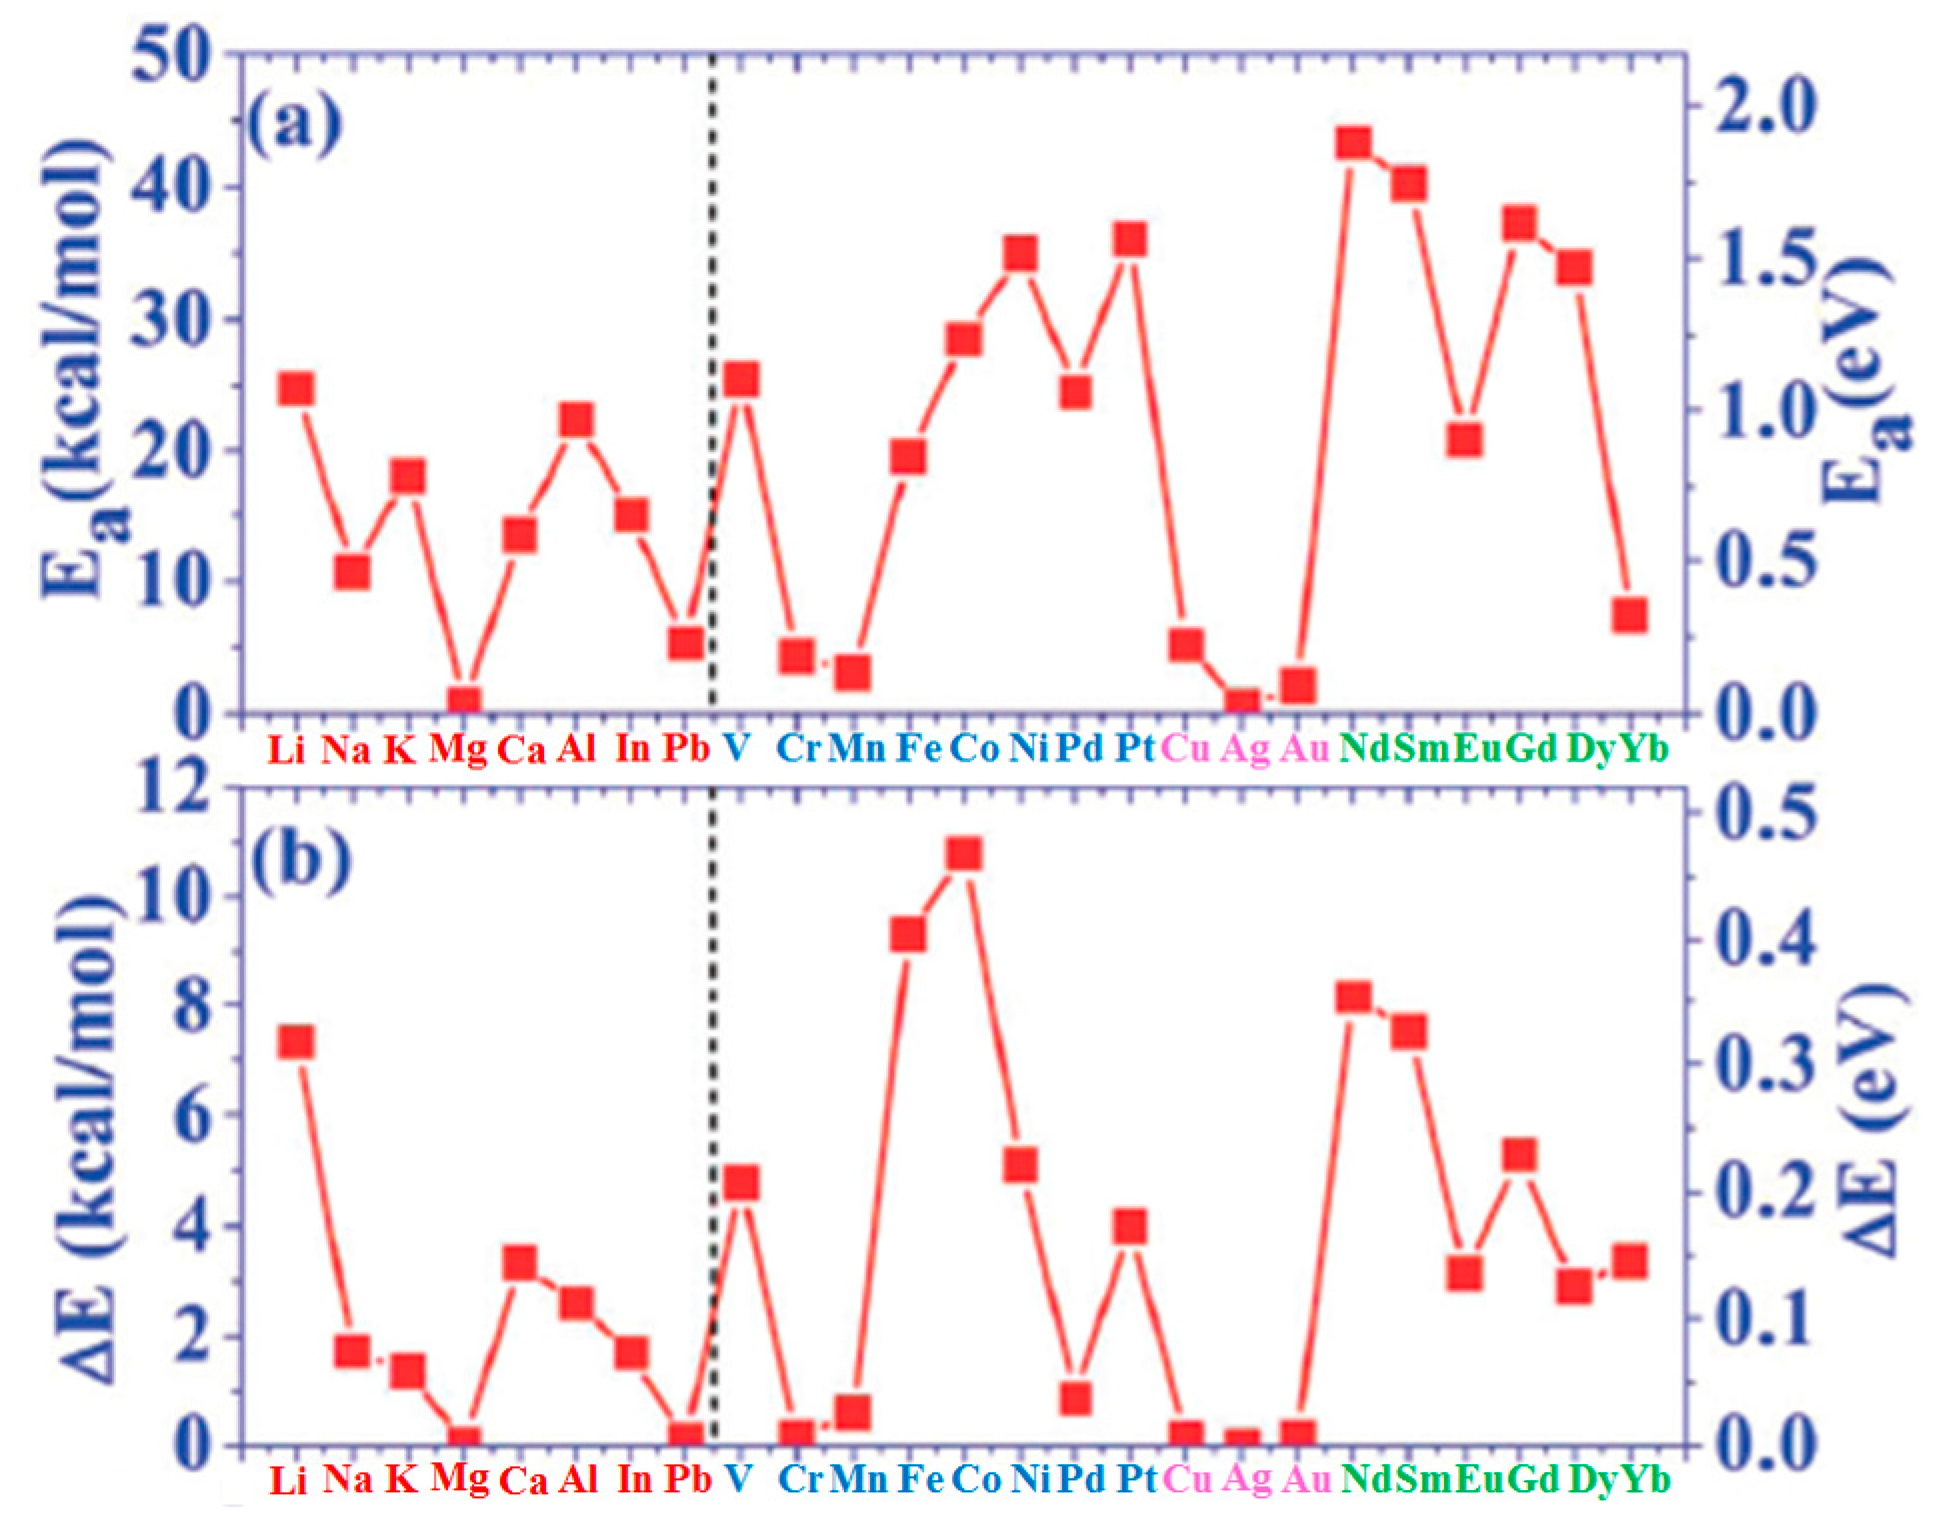
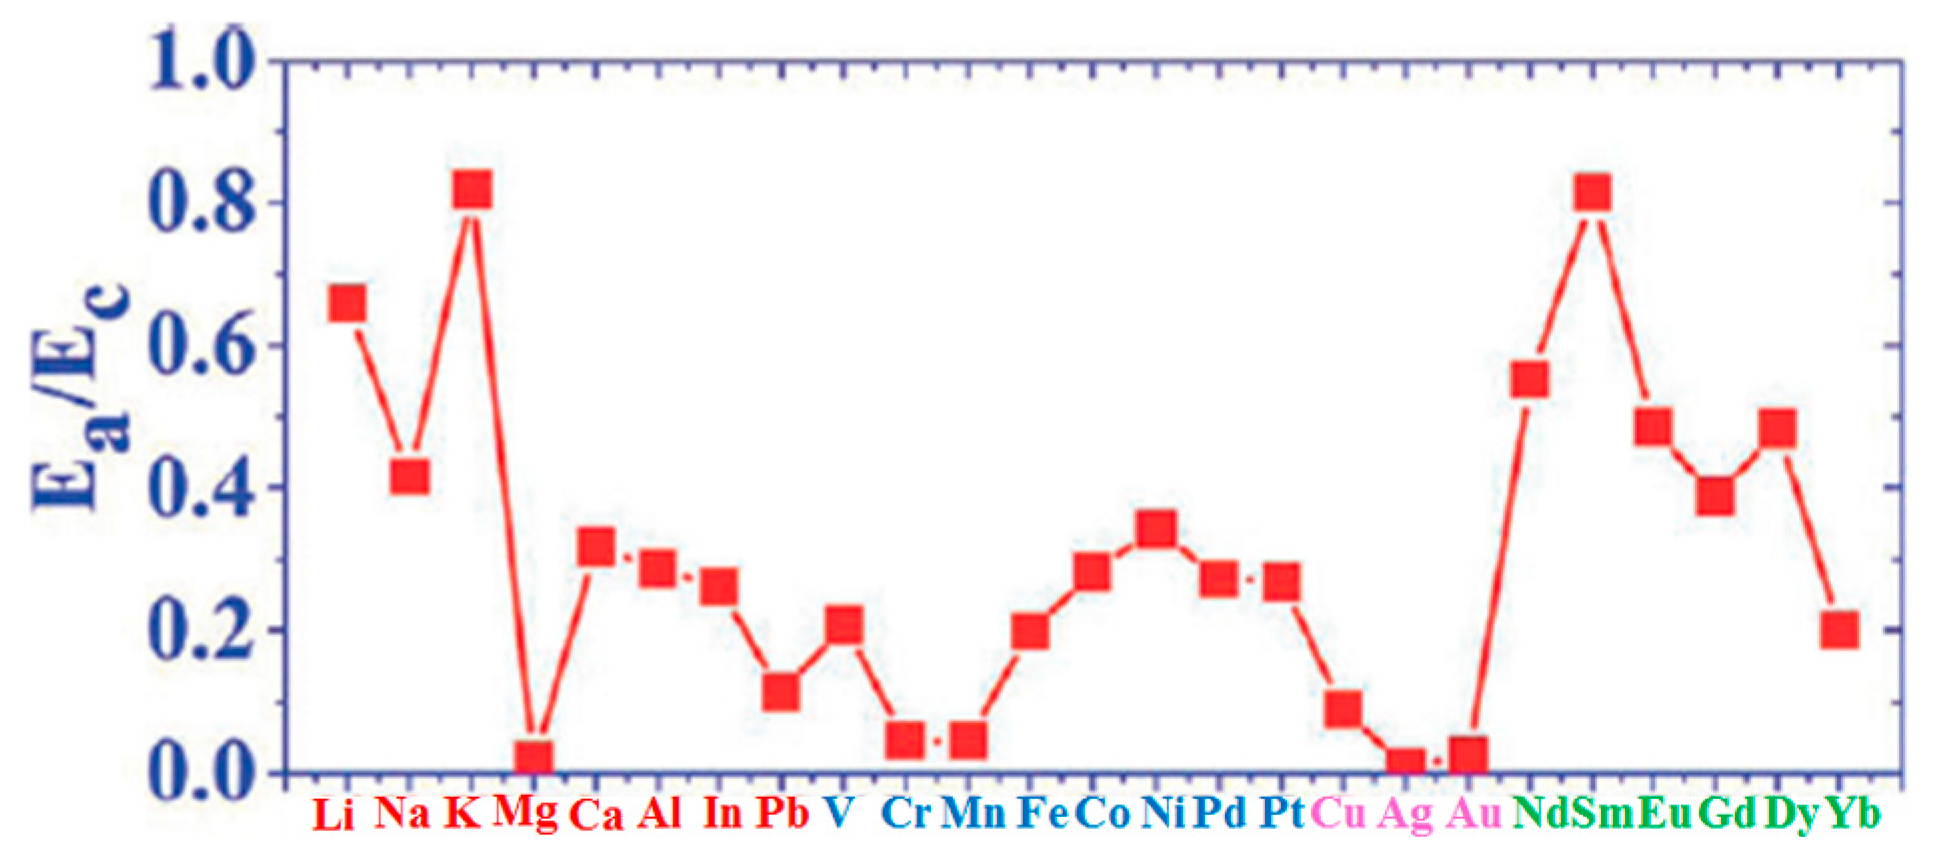
The evolution of the cluster superlattice (i.e., decay) is due to the thermally activated diffusion of clusters. The clusters perform a random motion around their equilibrium positions and two or more cluster can coalesce if the temperature is high enough to enough increase the diffusion length. The cluster diffusion, and so the probability for two or more cluster to join, is dictated by the activation barrier E
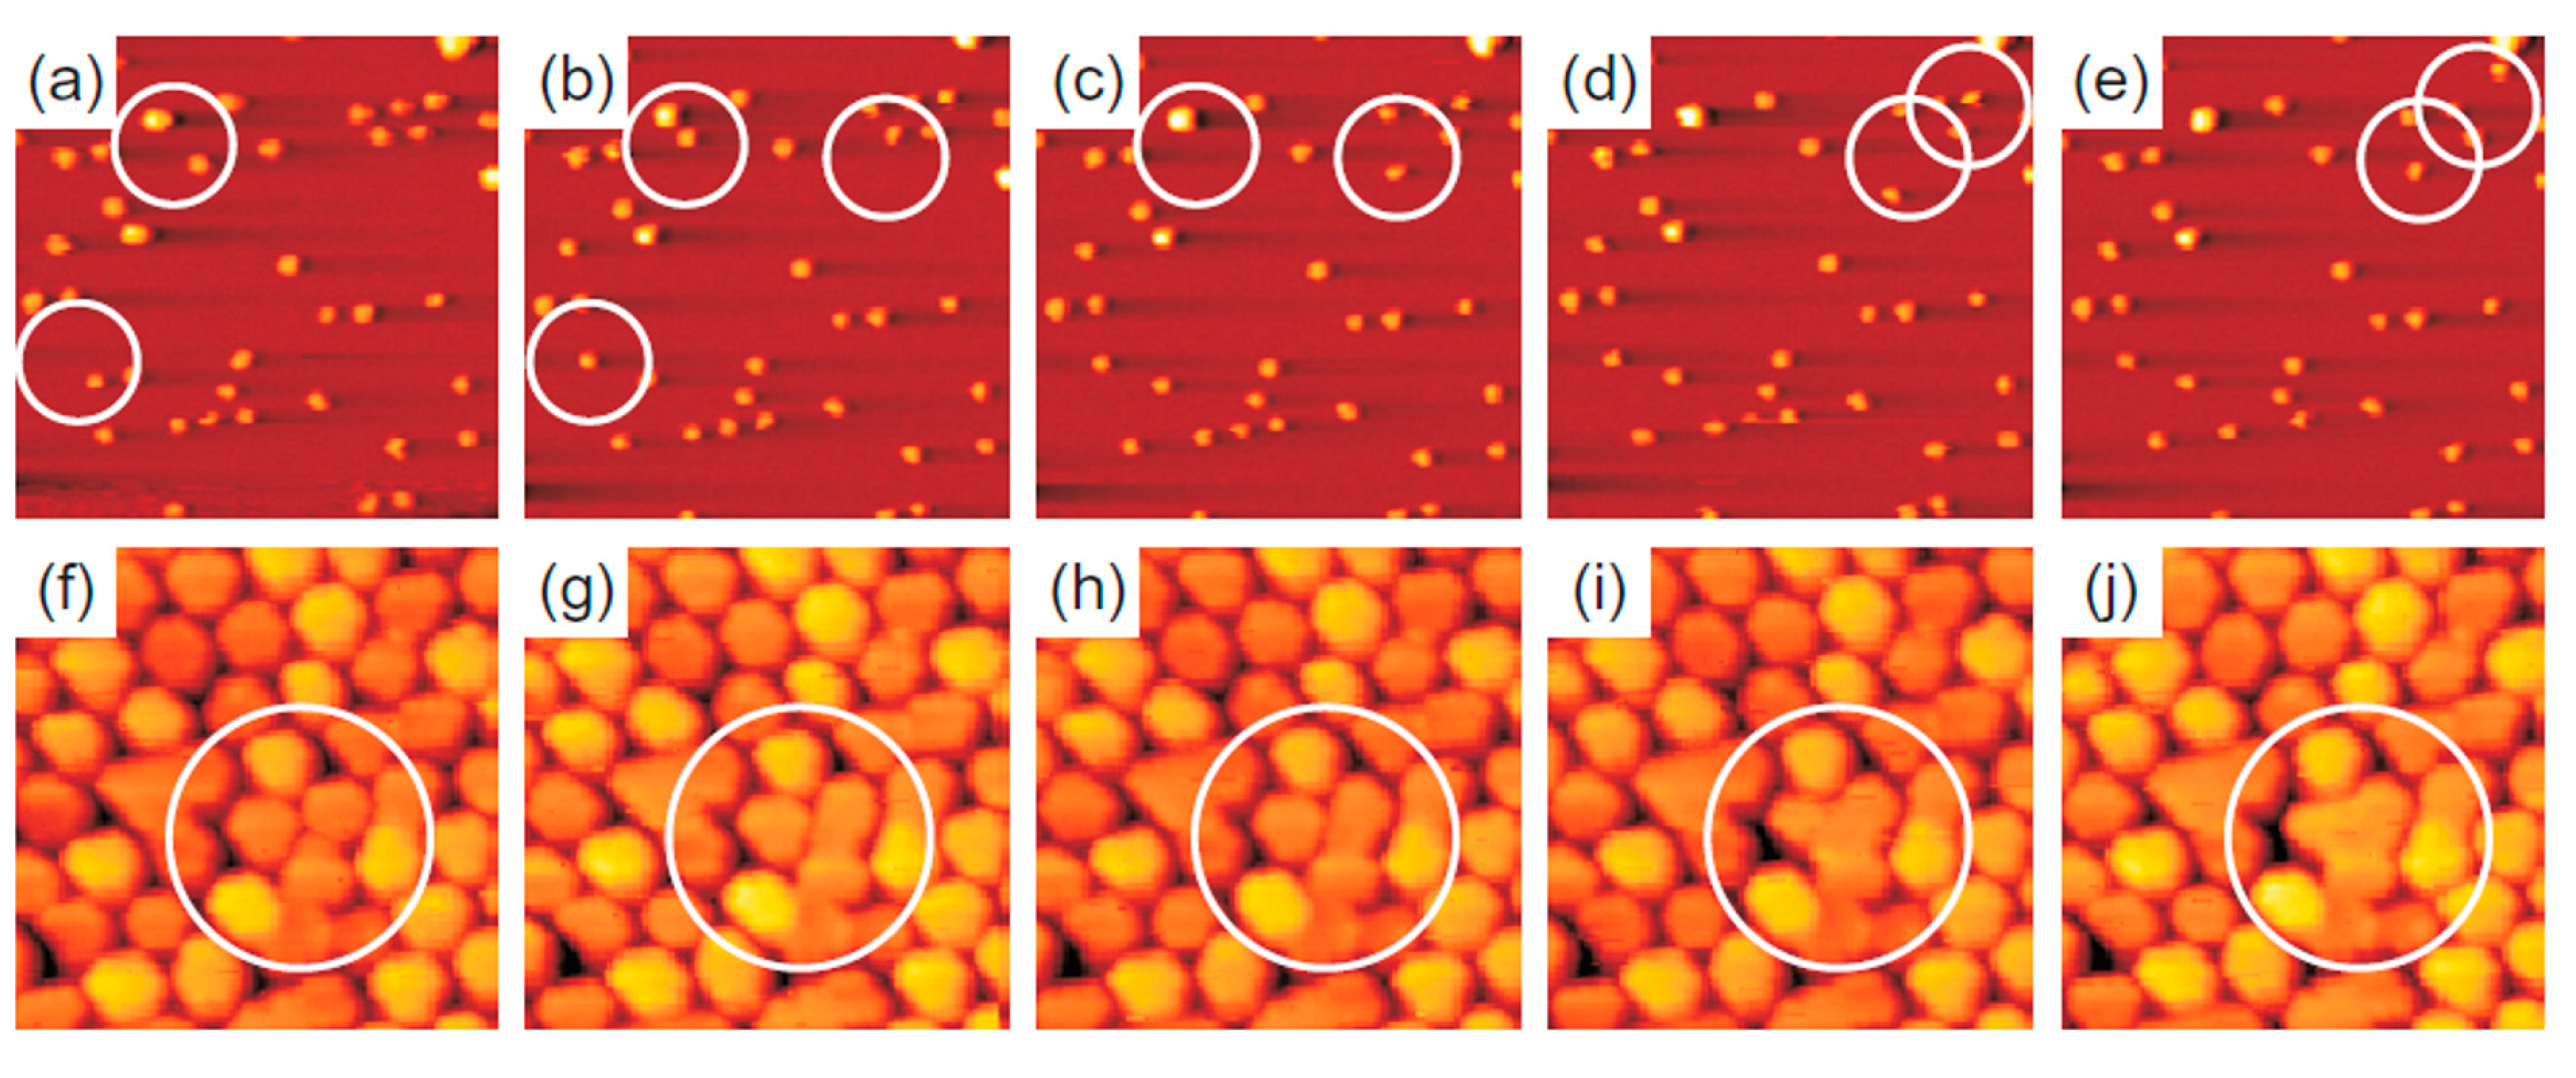
a which the cluster has to overpass to leave its moiré unit cell. This effect is illustrated by
Figure 14 showing a sequence of images taken at 390 K (a–e) or at 450 K (f–j). White circles in the images sequences indicate locations of thermally activated changes, i.e., clusters that having overpassed the activation barrier for diffusion and perform a coalescence process.
In addition, N’Diaye et al. [
64] were able to infer quantitative evaluations on the parameters involved in this process: supposing the clusters attempt frequency to overpass the diffusion barrier (i.e., the clusters joining frequency) expressed by an Arrhenius law, i.e., ν = ν
0exp(−E
a/kT), and supposing the probability that one cluster encounters another one is proportional to n, the data in
Figure 13h can be fitted to extract the clusters activation energy for diffusion (E
a) with the corresponding deviation (ΔE
a), and the pre-exponential factor ν
0. All these evaluated parameters are summarized in
Table 3.
2.2.2. Au Nanoparticles on Graphene
Zan et al. [
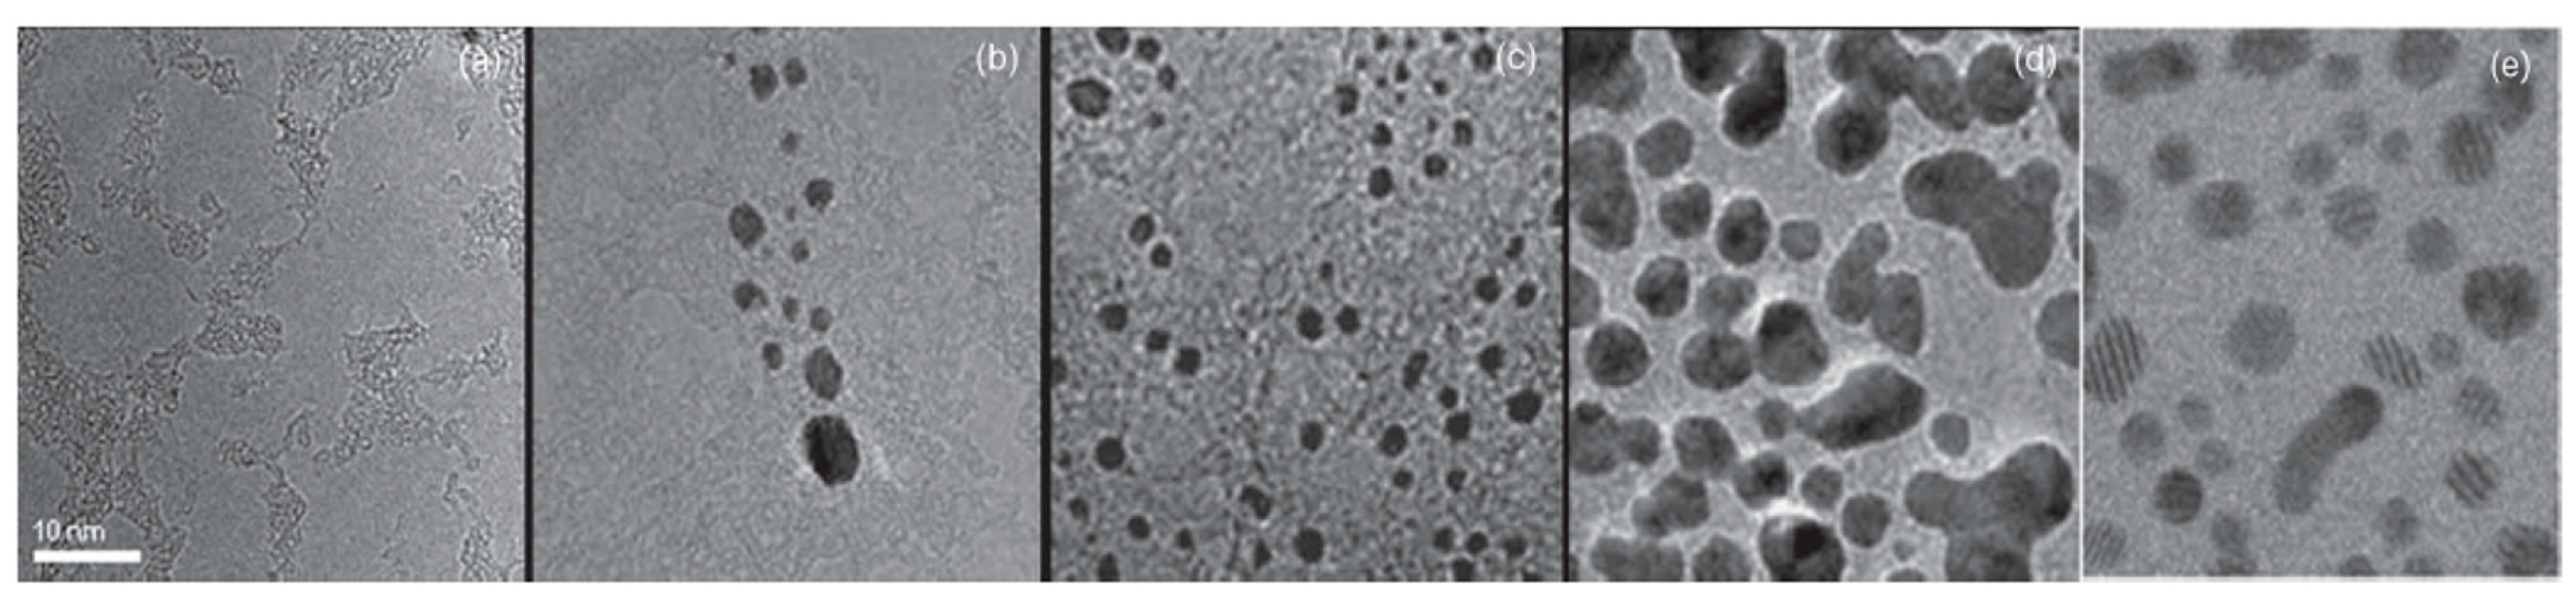
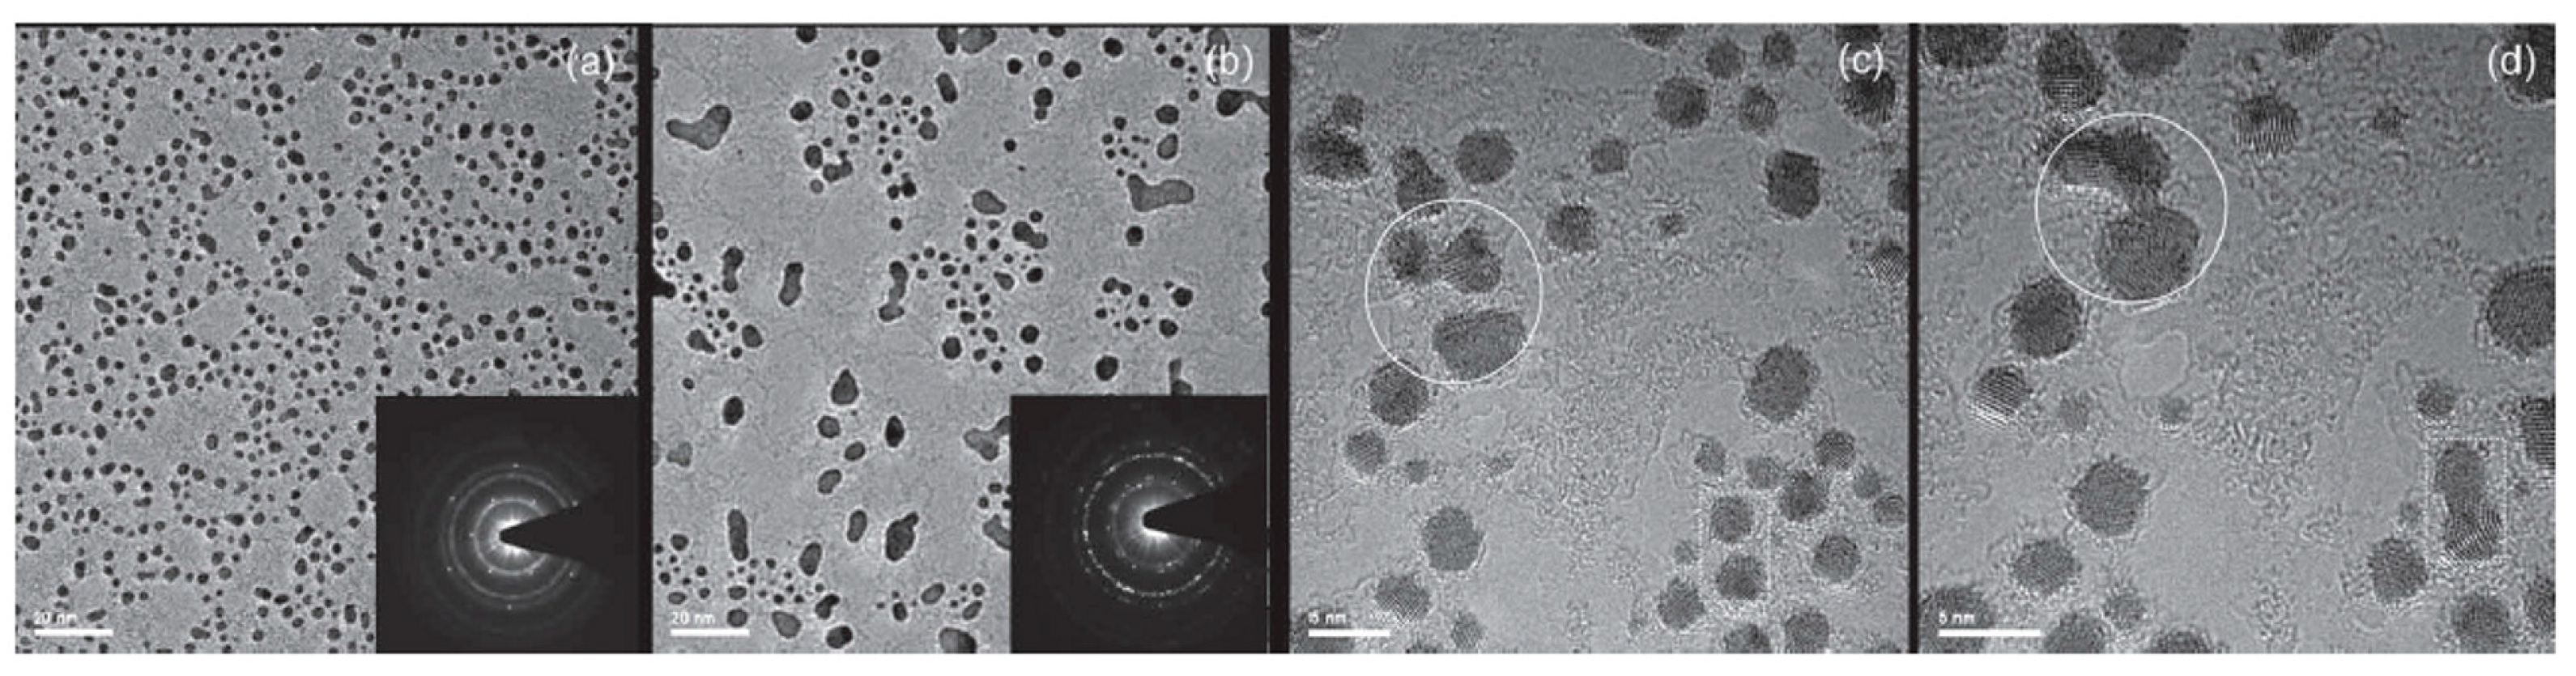
66] used Transmission Electron Microscopy to study the morphological and structural evolution of Au NPs on free-standing single-layer graphene sheet changing the effective deposited Au film thickness from less than 0.1 nm to 2.12 nm.
Figure 15 shows the results of the Au depositions: the preferential sites for the Au clusters nucleation are in correspondence of the Au hydrocarbon contamination, as revealed by the wormlike contrast in the high-resolution Transmission Electron Microscopy images. This is a signature of the very high diffusivity of Au atoms on graphene. Furthermore, the images show that the Au cluster number per unit area increases with increasing evaporated amount of Au, and at a nominal Au thickness larger than 1 nm clusters start to joining by coalescence.
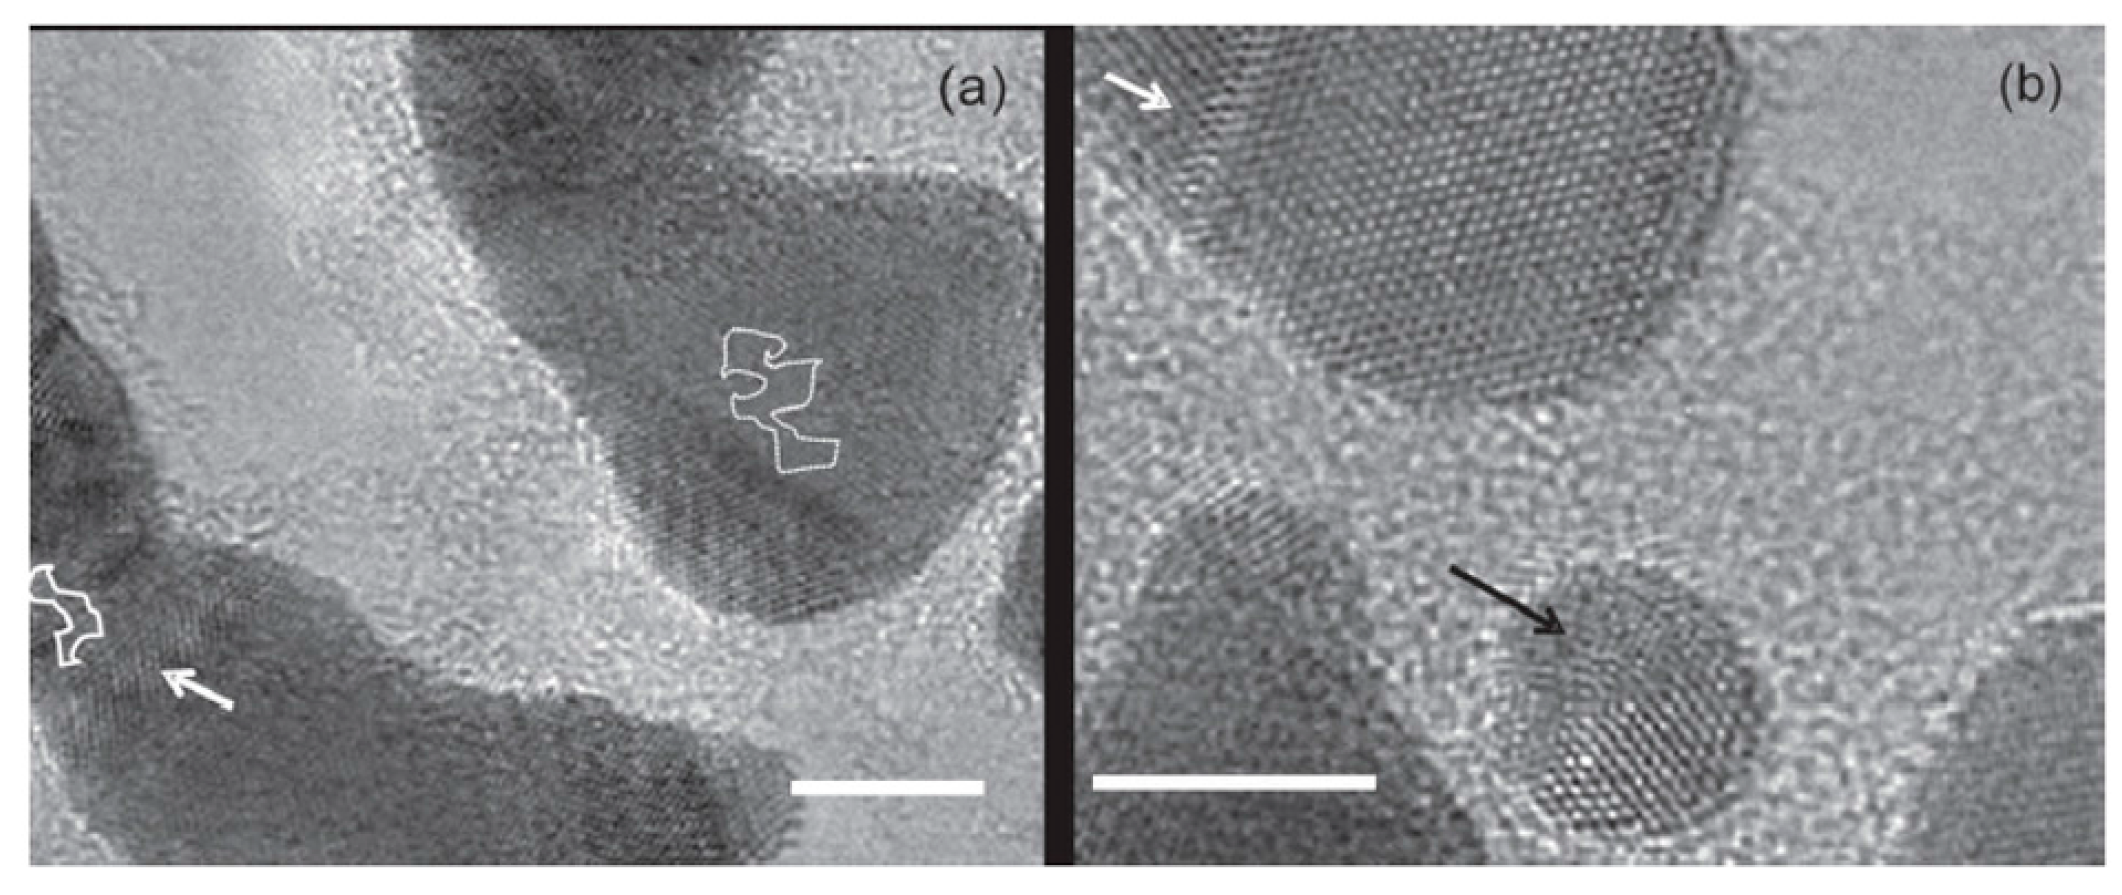
Figure 16 shows the observed in-situ coalescence process of some Au clusters. The lighter areas within the clusters correspond to clean graphene patches overlaid by the clusters. As examples two of these overlaid regions are marked by the white lines in
Figure 16a: the left one occurs at the coalescence front of two coalescing clusters, the right-hand one in the middle of a cluster.
In addition, Zan et al. [
66] motivated by the fact that a standard method to modify and functionalize graphene is by hydrogenation, studied the Au growth morphology on intentionally-hydrogenated free-standing graphene.
Hydrogenation breaks graphene sp
2 bonds and leads to sp
3 bond formation. Au depositions, 0.2 nm in nominal thickness, were, so, carried out on graphene surfaces that had been hydrogenated and the results compared to those obtained for 0.2 nm Au deposited on pure graphene. As can be seen in
Figure 17a, the hydrogenated sample presents a higher Au clusters density and cluster sizes are less dispersed than in the pure graphene sample, as shown in the image in
Figure 17b. However, similar to pristine graphene, Au clusters nucleate in the defects represented by the contaminations sites where the hydrogenation occurred. So, the increased hydrogenation of the graphene leads to a more effective adhesion of Au, enhancing the nucleation probability of Au clusters in the contaminations. This picture is confirmed by the observation of the occurring of coalescence of Au clusters under the electron beam of the Transmission Electron Microscopy (a process which is not observed for the Au on the pristine graphene). An example of this process in the hydrogenated sample is shown in
Figure 17c,d: these Transmission Electron Microscopies present the evolution of the Au clusters under the electron beam at temporal distance of about 10 s. The agglomeration of the Au clusters (marked by the solid circles and dashed rectangles in
Figure 17c,d) occurs rapidly, in the 10 s time range. In contrast, the Au clusters formed on the pristine graphene perform a coalescence process on the graphene during the Au deposition and not in few seconds under exposure to the electron beam. So, evidently, the hydrogenation process of the graphene lowers the diffusion barrier for the pre-formed Au clusters, the electron beam furnishes enough energy to the clusters to overcome this diffusion barrier, and the Au clusters coalescence starts and rapidly occurs (~seconds).
2.2.3. Au and Pt Nanoparticles in Graphene
Another aspect related to the kinetic processes of metal atoms interacting with graphene was analyzed by Gan et al. [
58]: they studied, experimentally, the in-plane diffusion characteristics of Au and Pt atoms in graphene and the corresponding nucleation process towards the formation of NPs by using in-situ Transmission Electron Microscopy analyses at high temperature. The analysis by the authors starts by the consideration that carbon vacancies in the graphene layers favor the atoms in-plane diffusion with respect to the on-plane diffusion.
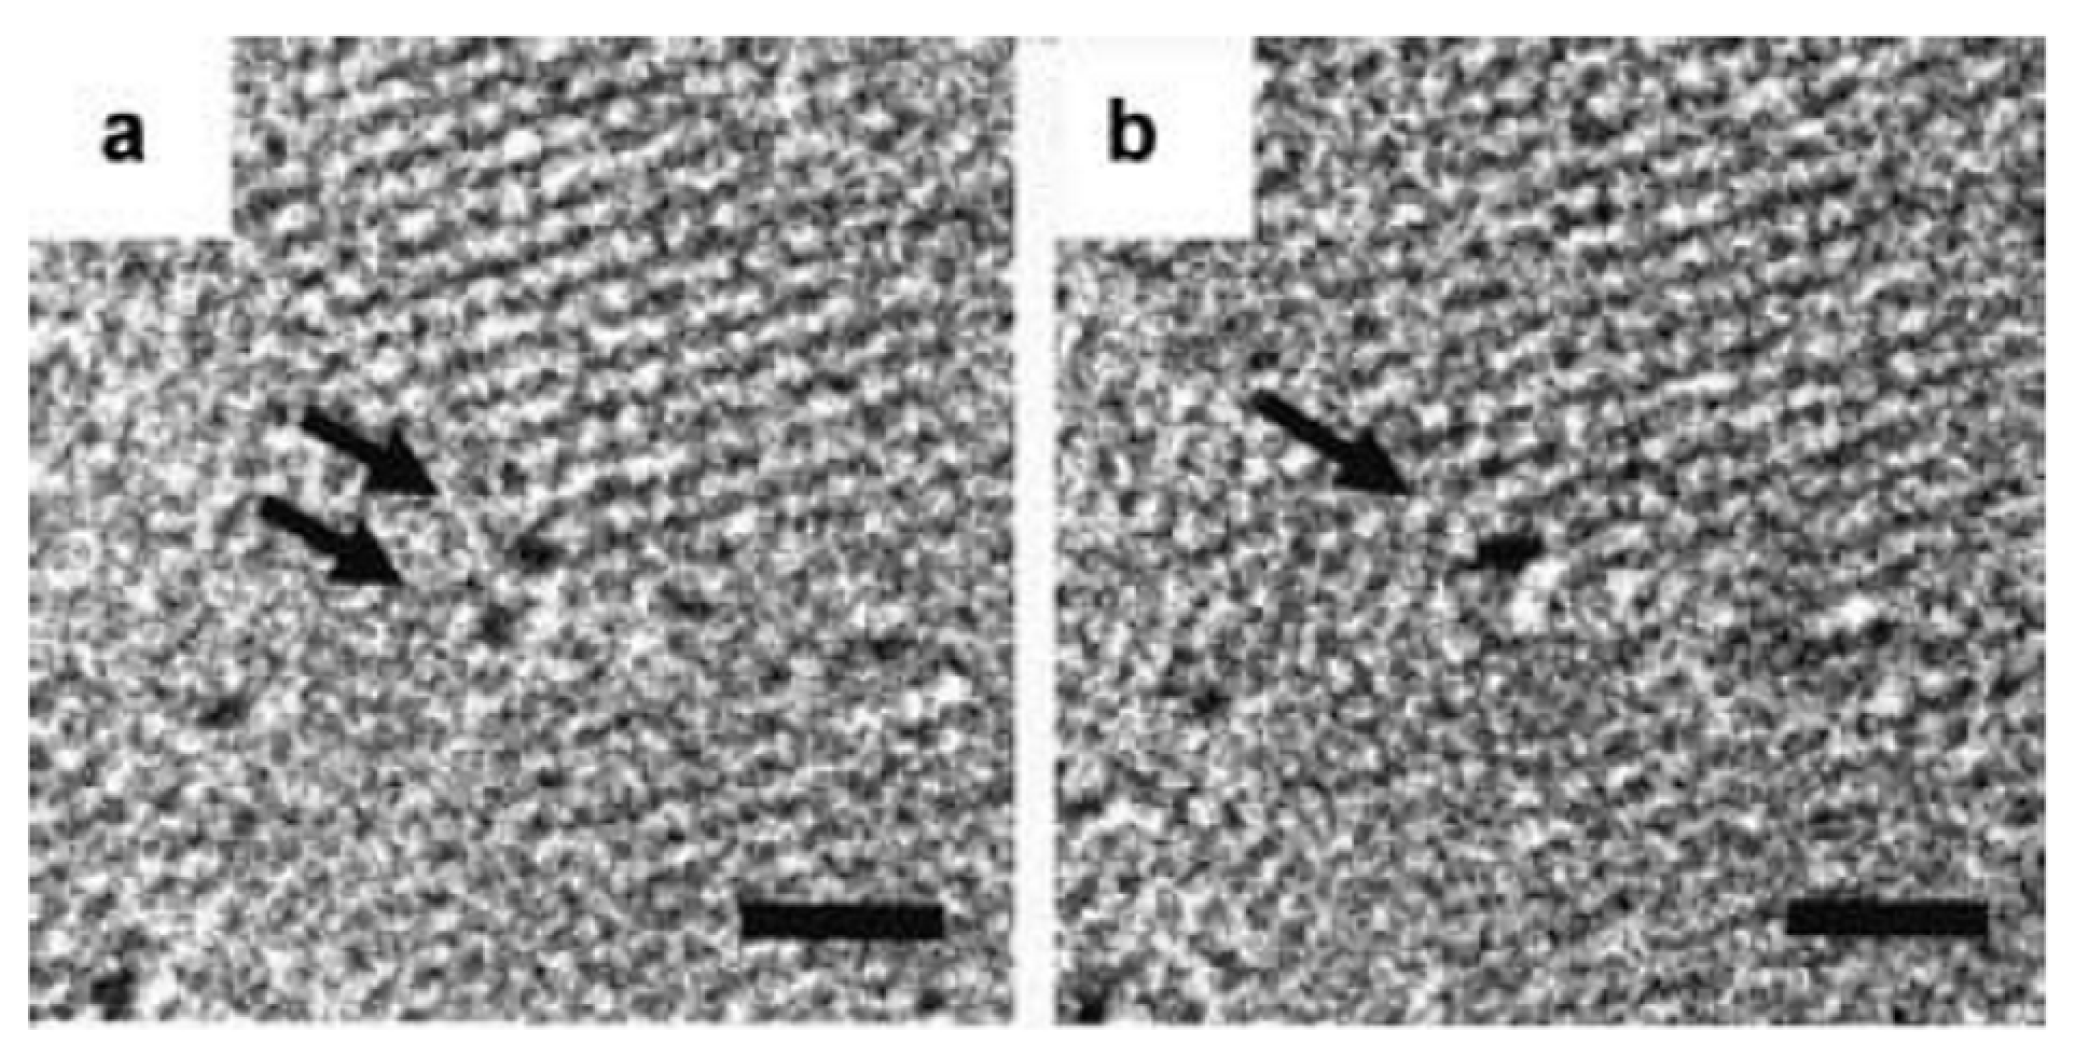
So, to perform the experiments, the authors mixed powders of Au or Pt with graphite powder. Then they obtained a mixed fine deposit by an electric arc discharge system. After dispersing and sonicating the resulting deposit, it was placed on standard grids for in-situ Transmission Electron Microscopy analysis. During the Transmission Electron Microscopy studies, the samples were annealed in the 600–700 °C range to induce the metal atoms diffusion. The used fabrication method produces layers consisting of one or few graphene layers characterized by crystal vacancies allowing the in-plane metal atoms diffusion. As an example,
Figure 18a,b show Pt atoms in a four-layers graphene structure held at 600 °C. The image in
Figure 18b was acquired 60 s after
Figure 18a. Two Pt atoms (indicated by the arrows) merge and form a nucleus. Such nuclei of two or several Au or Pt atoms were often observed by the authors. Then they acquired several images with the viewing direction along the graphene layers. In this condition, the observed metal atom apparently remains immobile during the annealing and overlaps with the contrast of the outermost graphene layers: this fact excludes that the metal atom is located on top of the layer. So, after several observations, the authors conclude that the metal atoms are located in-plane with the graphene sheet occupying vacancies on the carbon sites.
To analyze the atoms diffusion,
Figure 19 shows the temporal evolution by reporting plan-view Transmission Electron Microscopy images acquired in the same region of the sample which is held at 600 °C and increasing the time. These images follow, in particular, the evolution of Pt atoms. The arrows in the first images identify some Pt atoms and by the images sequence how these atoms change their position by diffusion can be recognized. Atoms diffusing within the layer are marked by ‘‘L’’. It can be concluded that metal atoms prefer edge locations rather than in-plane sites. It is also visible how the atoms at the edge (marked by ‘‘E’’) move along the edge. Using these real-time analyses, the authors, in particular, were able to measure the diffusion length for several of Au and Pt atoms (quantified along the layer) versus time at different temperatures, obtaining data which follow the square-root law connecting the diffusion length to the diffusion time.
So, the mean diffusion length x is connected to the diffusion time t by D = x
2/4t, with D the atomic diffusion coefficient. Using the experimental data, the authors derived values for the Pt and Au atoms in-plane diffusion coefficient: D = 6 × 10
−22–2 × 10
−21 m
2/s for Au at 600 °C, D = 4 × 10
−22–1 × 10
−21 m
2/s for Pt at 600 °C, D = 1 × 10
−21–7 × 10
−21 m
2/s for Pt at 700 °C. Using these values, Gan. et al. [
58] evaluated the activation energy for the graphene in-plane diffusion of the Pt and Au atoms: in fact, considering that D = ga
2ν
0exp[−E
a/kT], with g ≈ 1 a geometrical factor, a the graphene lattice constant, ν
0 the attempt frequency which can be assumed to be the Debye frequency, then E
a is estimated, both for Pt and Au, in about 2.5 eV.
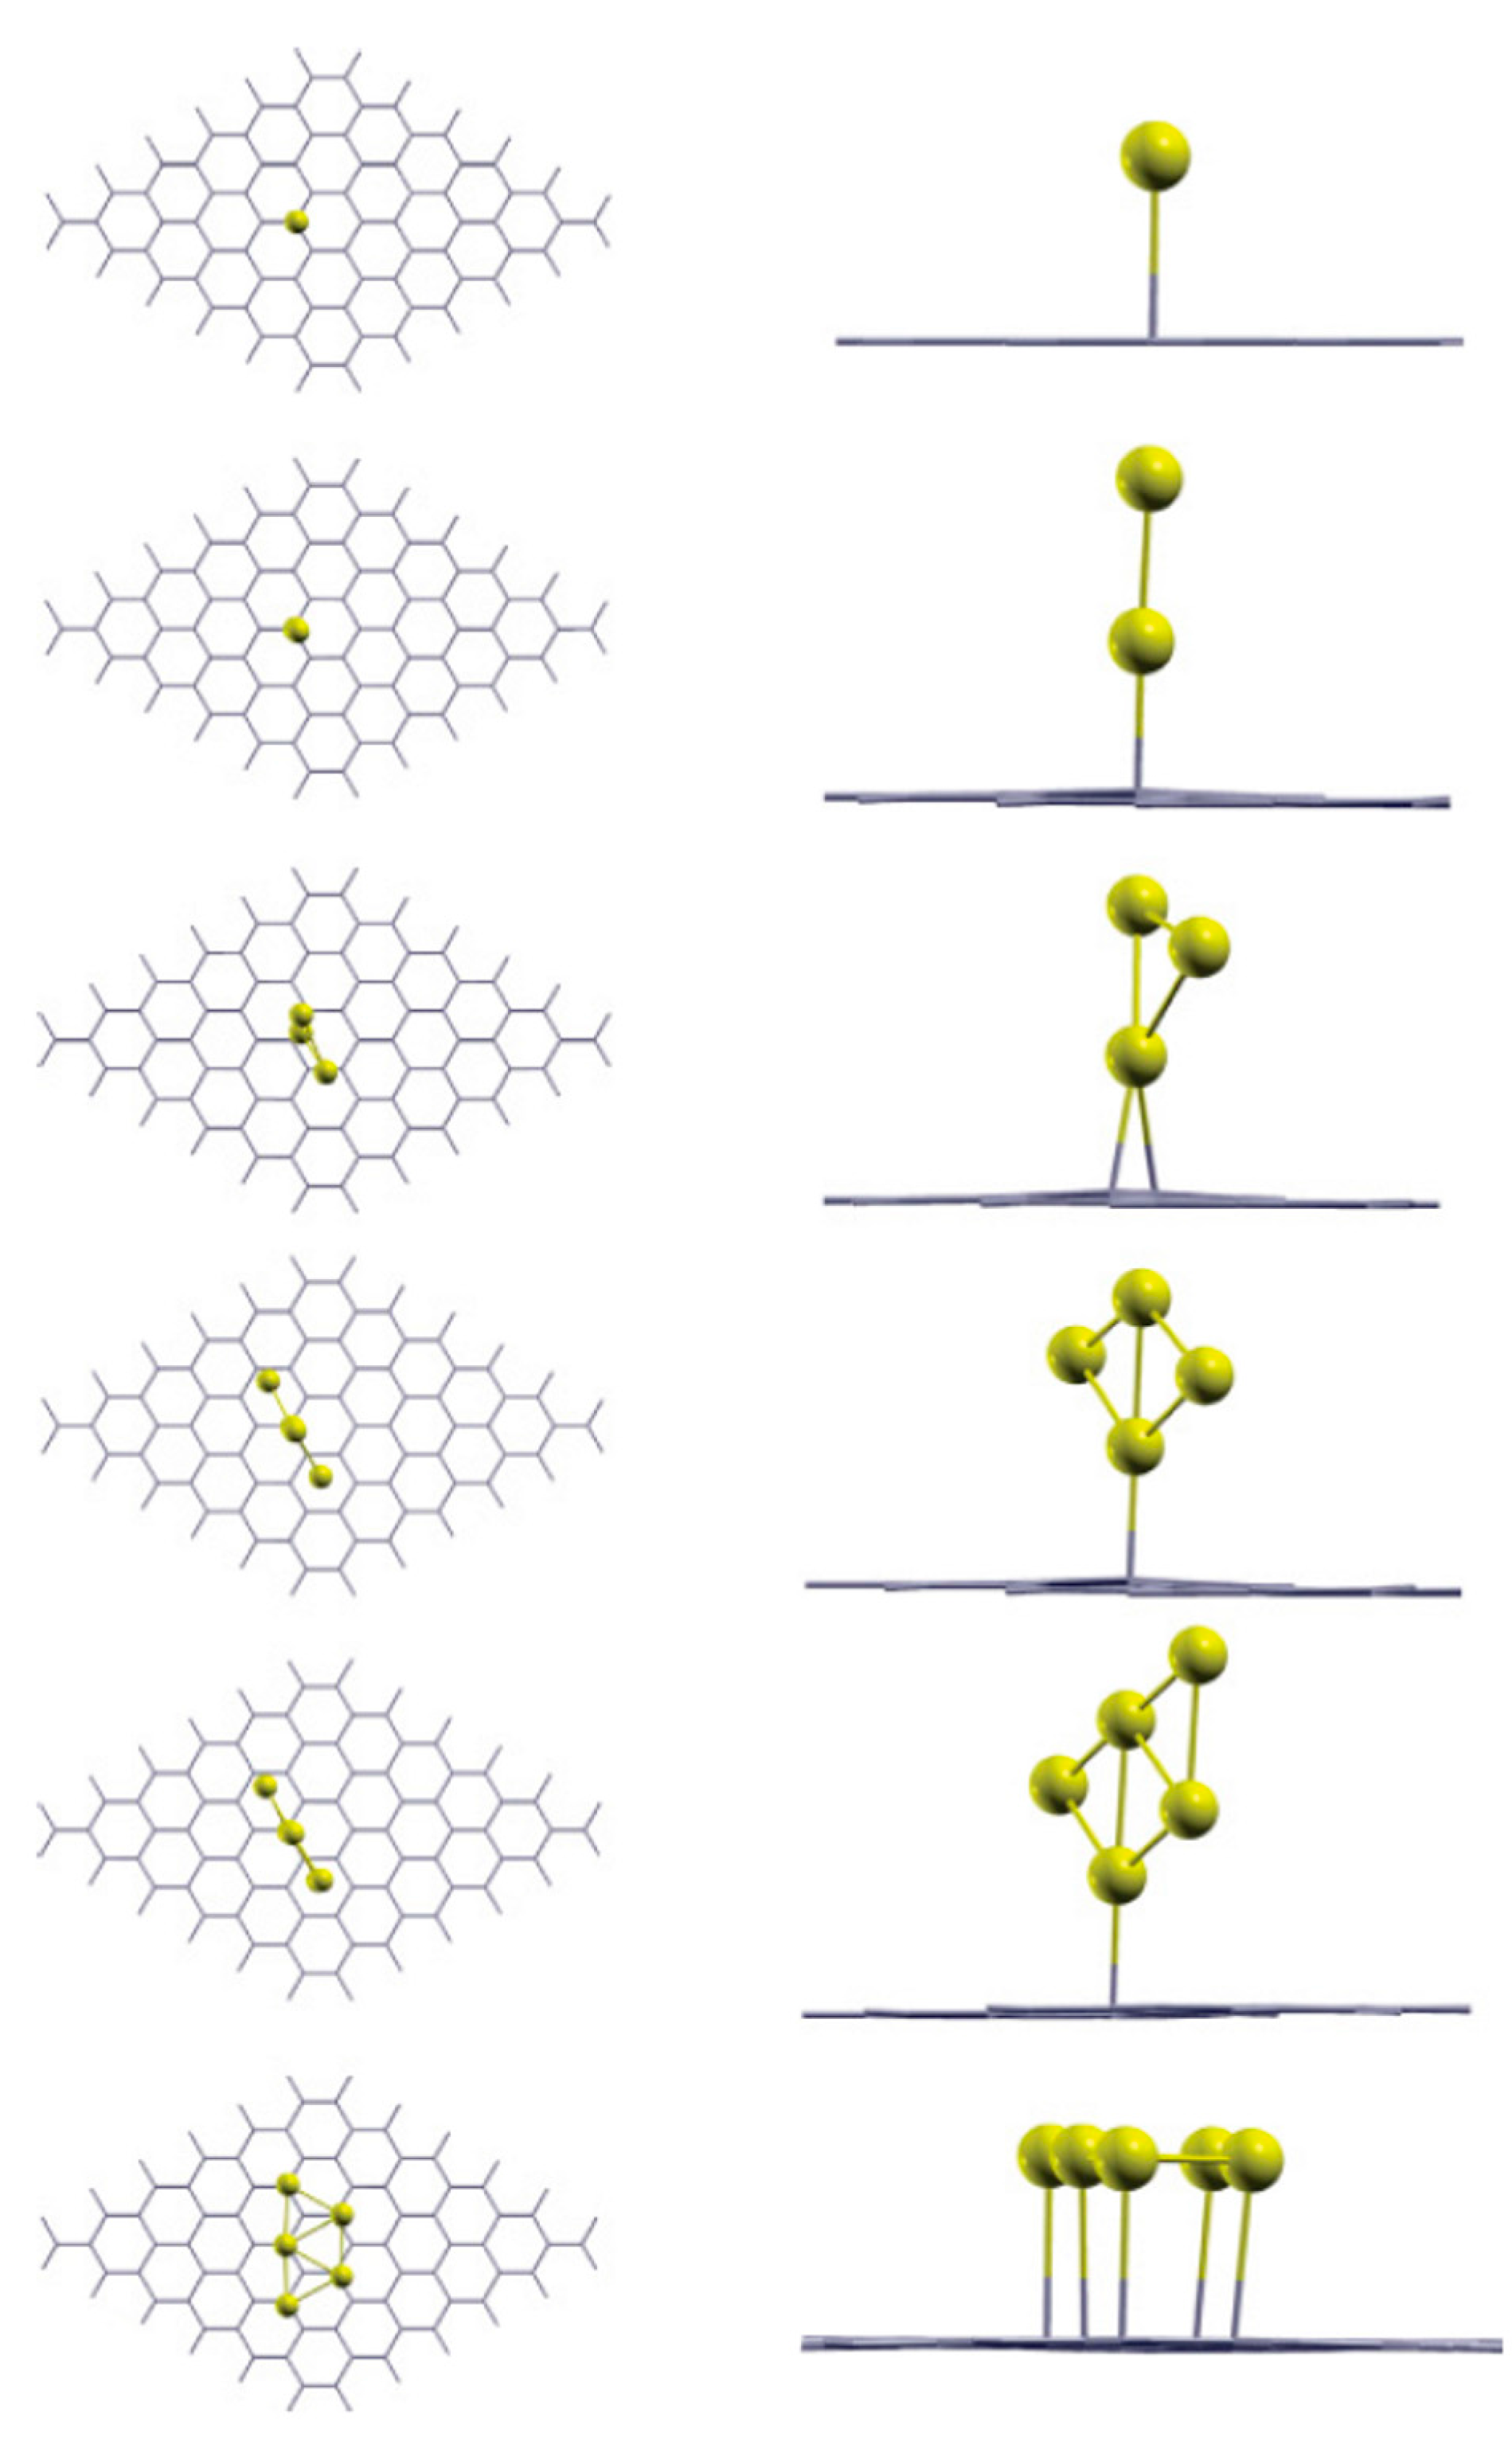
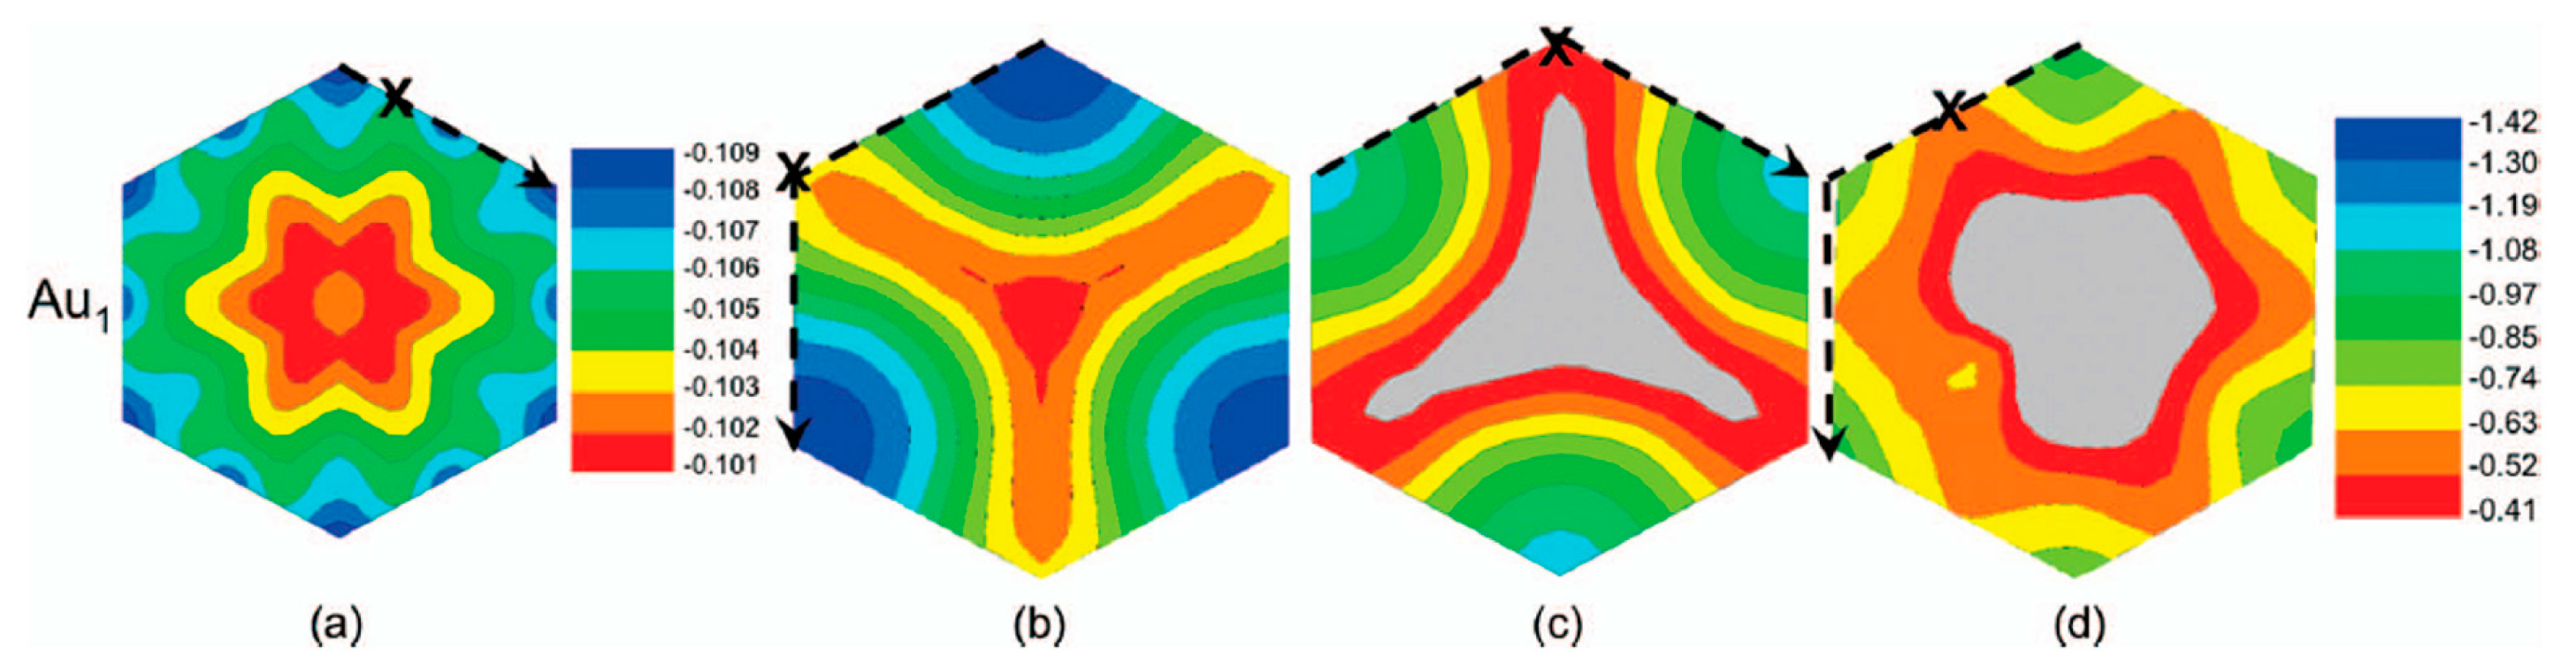
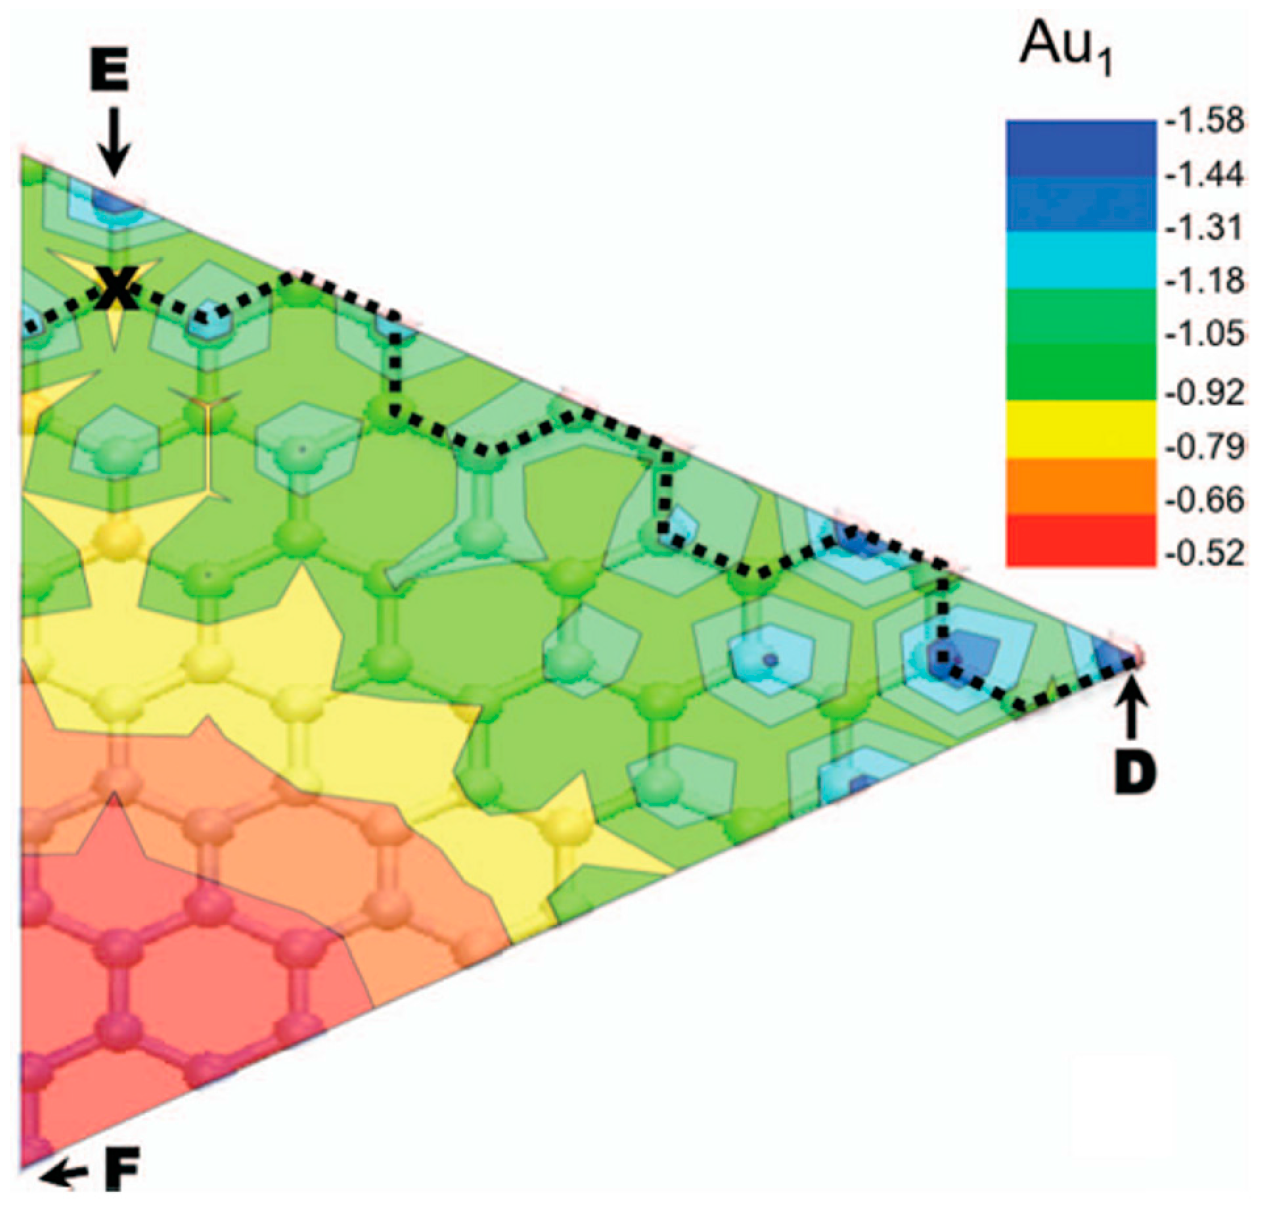
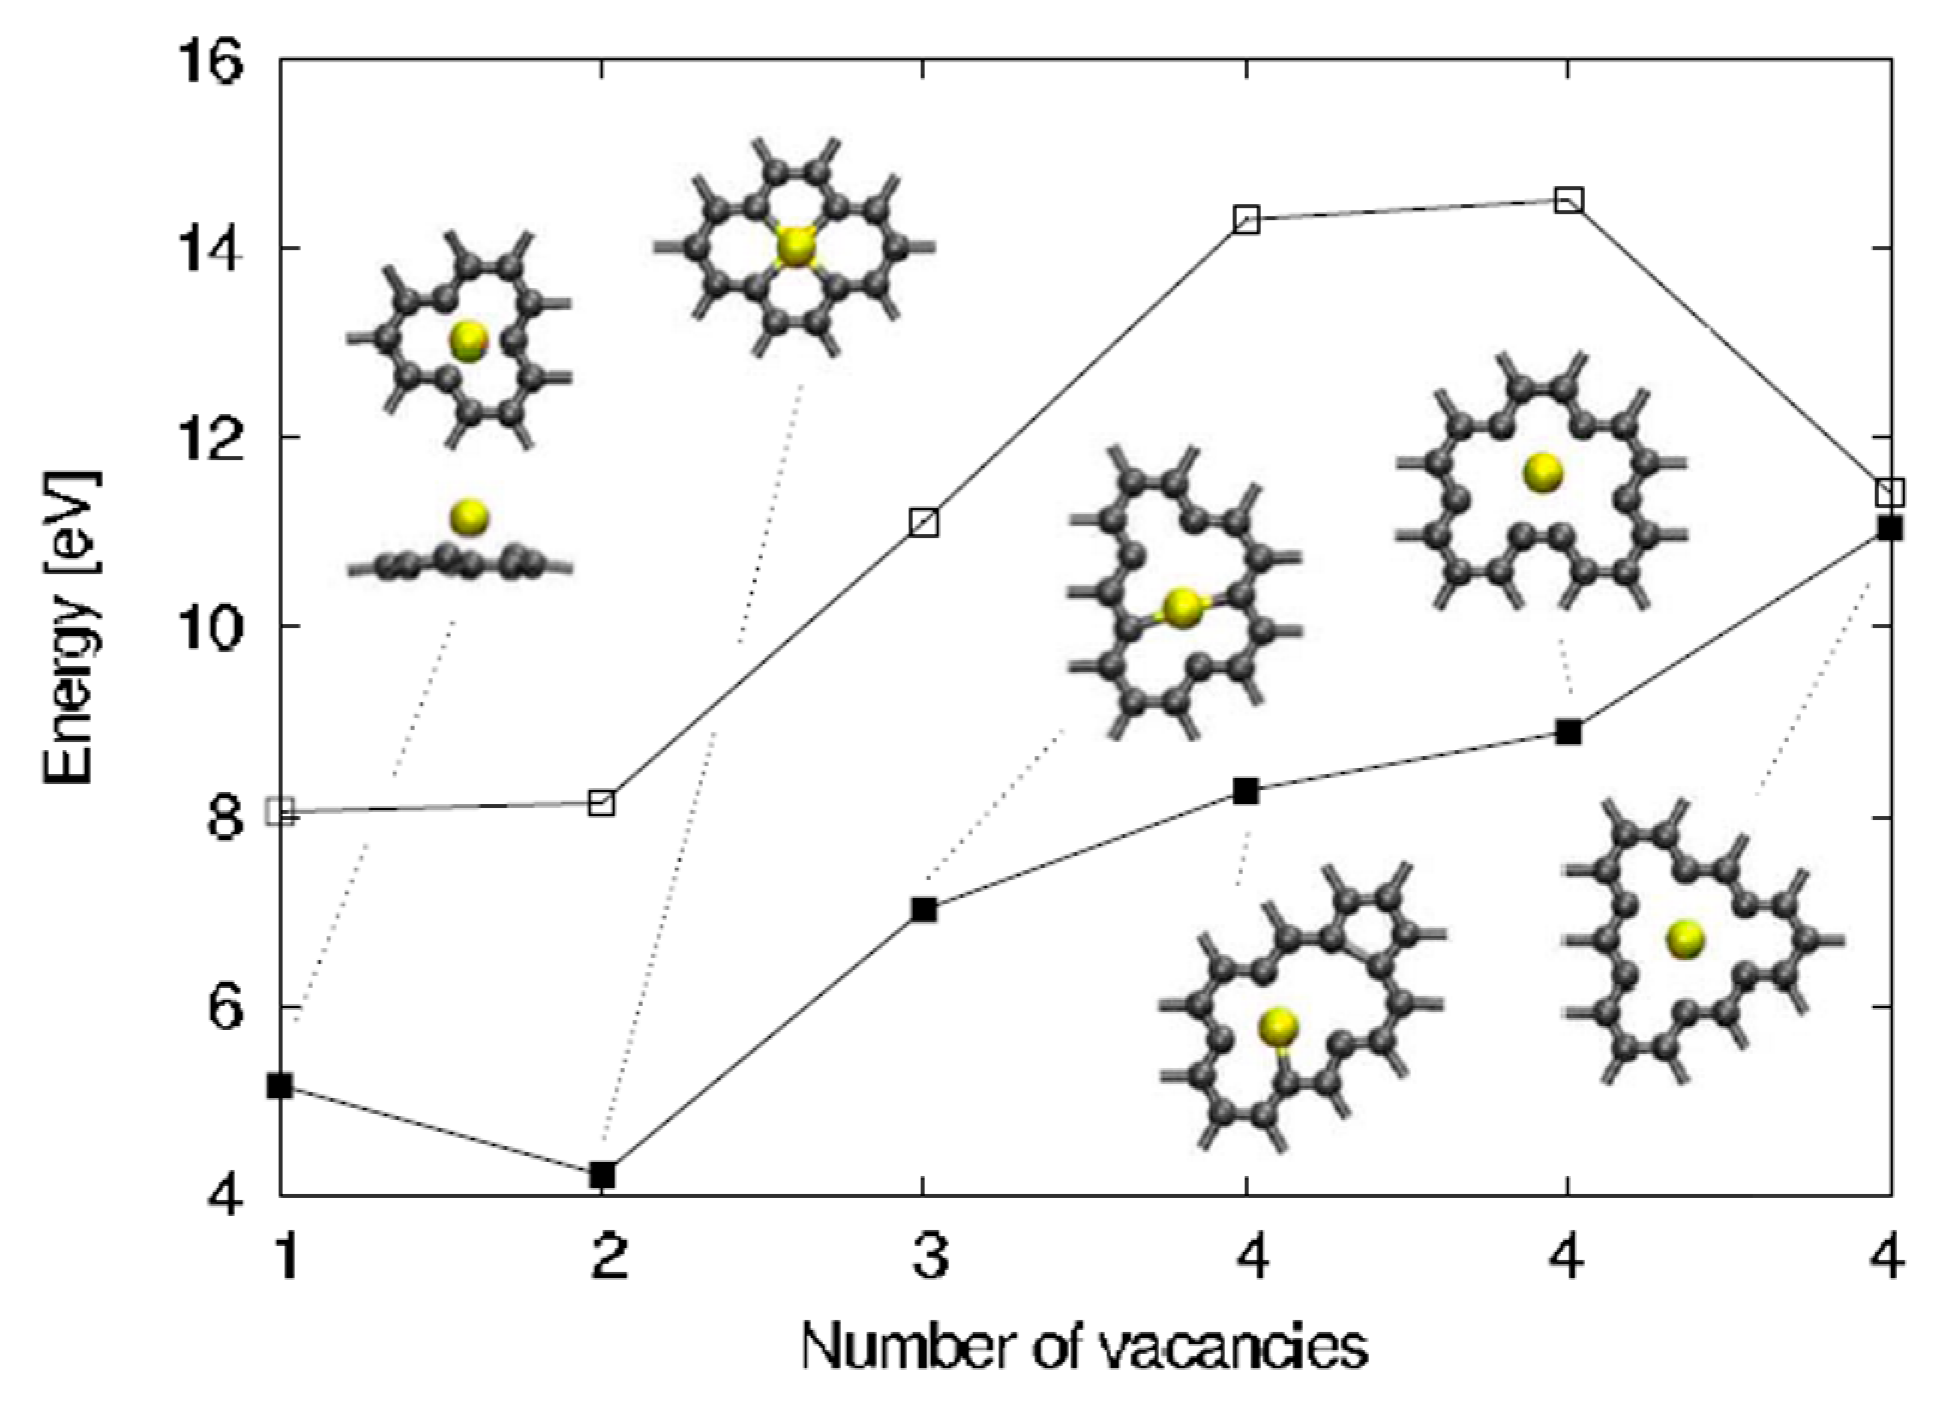
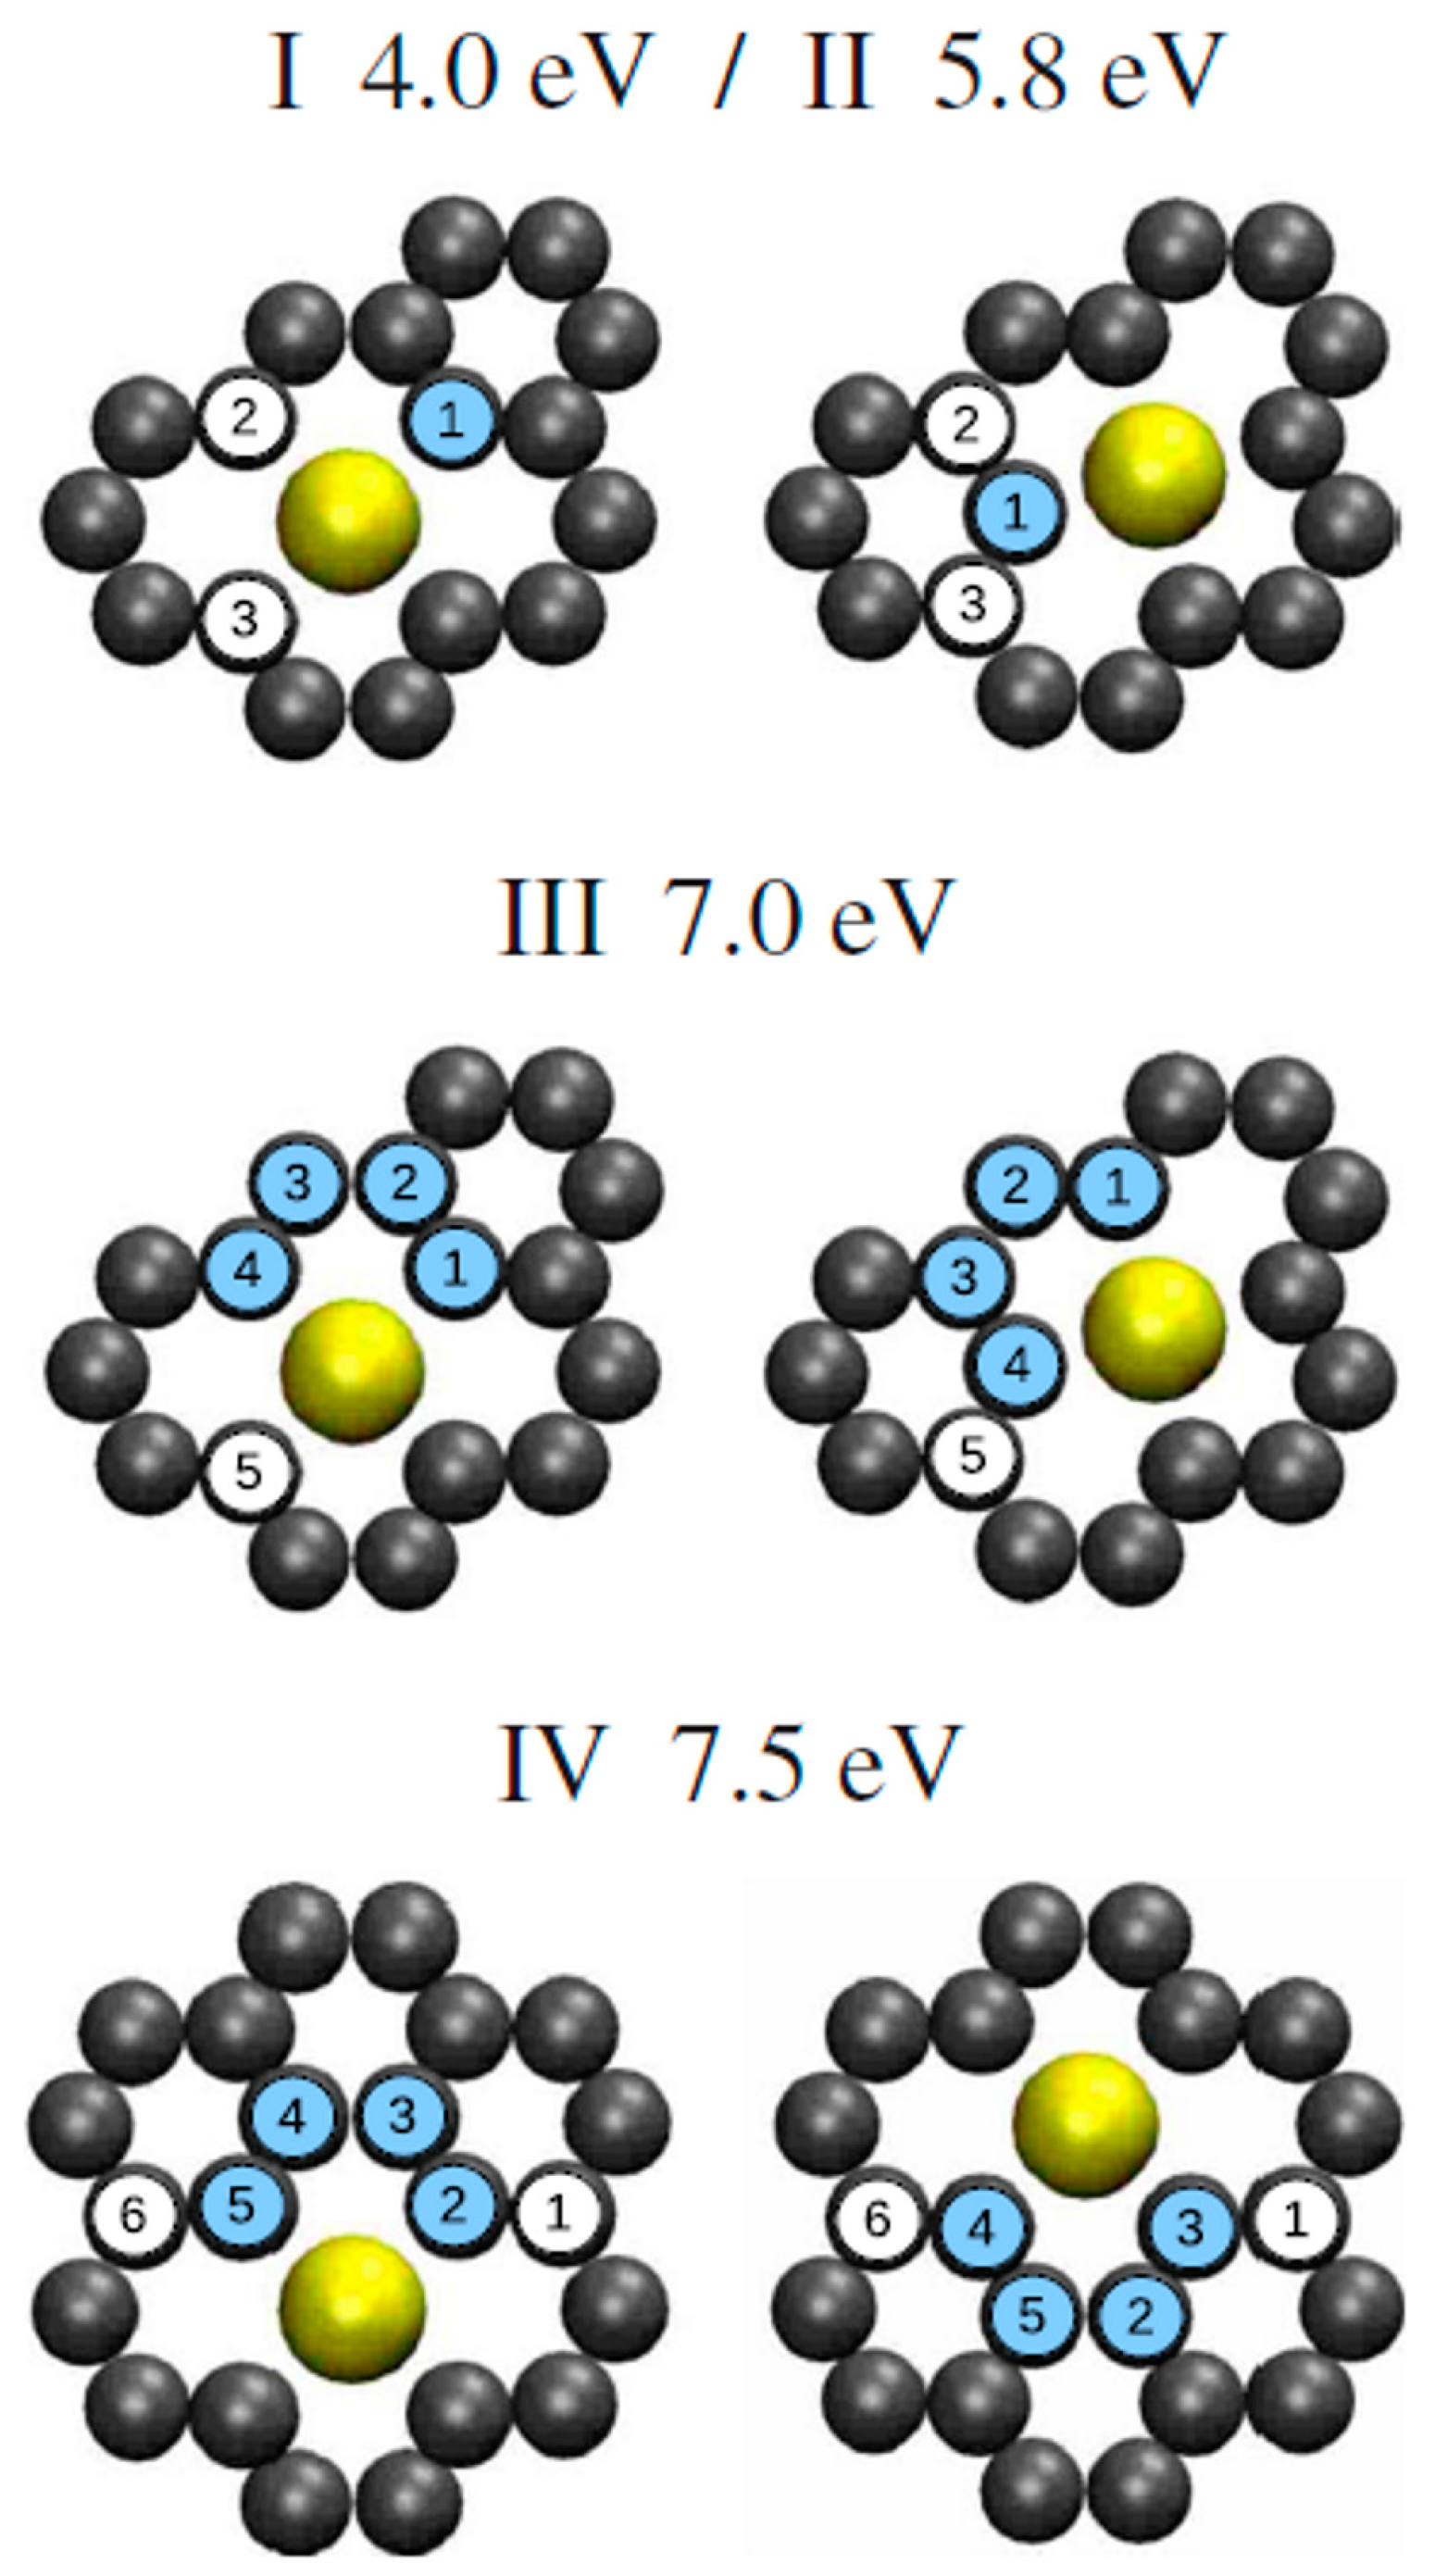
This value arises by the combined effect from the covalent bonding between Pt or Au and C atoms and from the activation energy for site exchange of carbon atoms that is given by the vacancy migration energy in graphene (1.2 eV). However, a question arises about these results: the role of the electron beam used for the in-situ Transmission Electron Microscopy analyses on the observed metal atoms diffusion process. In fact, it could determine an enhanced radiation diffusion. This point was, in particular, addressed, from a theoretical point of view, by Malola et al. [
84] as discussed in
Section 2.1.4. Their theoretical simulations indicate that the lowest-energy path with 4.0 eV barrier involves out-of-plane motion of Au (see
Figure 8). Other diffusion paths are characterized by higher energy barriers. So, the 2.5 eV barrier value measured by Gan et al. [
58] for the in-plane diffusion of Au atoms in graphene should arise as an electron (300 keV) radiation enhanced diffusion: in fact, assuming Au in double vacancy, at least one of the 14 neighboring C atoms should be removed every 10 s as result of the electron beam interaction. This generation of vacancies favor Au to overcome the large 4 eV (or higher) energy barrier, resulting in the effective 2.5 eV. The radiation enhanced diffusion interpretation is in agreement with the experimental result that the 2.5 eV barrier is found both for Au and Pt which is not expected a-priori considering that C–Pt interaction is stronger than the C–Au one. In fact, on the basis of this fact, the activation energy for the Pt diffusion should be higher. Instead, the C-metal energy interaction is substantially negligible in the diffusion process if it is dominated by radiation enhancement.
2.2.4. Au Nanoparticles on Graphene Supported on Different Substrates
Liu et al. [
60] investigated, from an experimental point of view, the nucleation phenomenon of Au NPs on graphene. In particular, they focused the attention on the effect of the substrate supporting the graphene and of the graphene layer number on the NPs nucleation kinetics. The experimental data were discussed within the mean field theory of diffusion-limited aggregation, allowing to evaluate the Au adatom effective diffusion constants and activation energies.
Liu et al. [
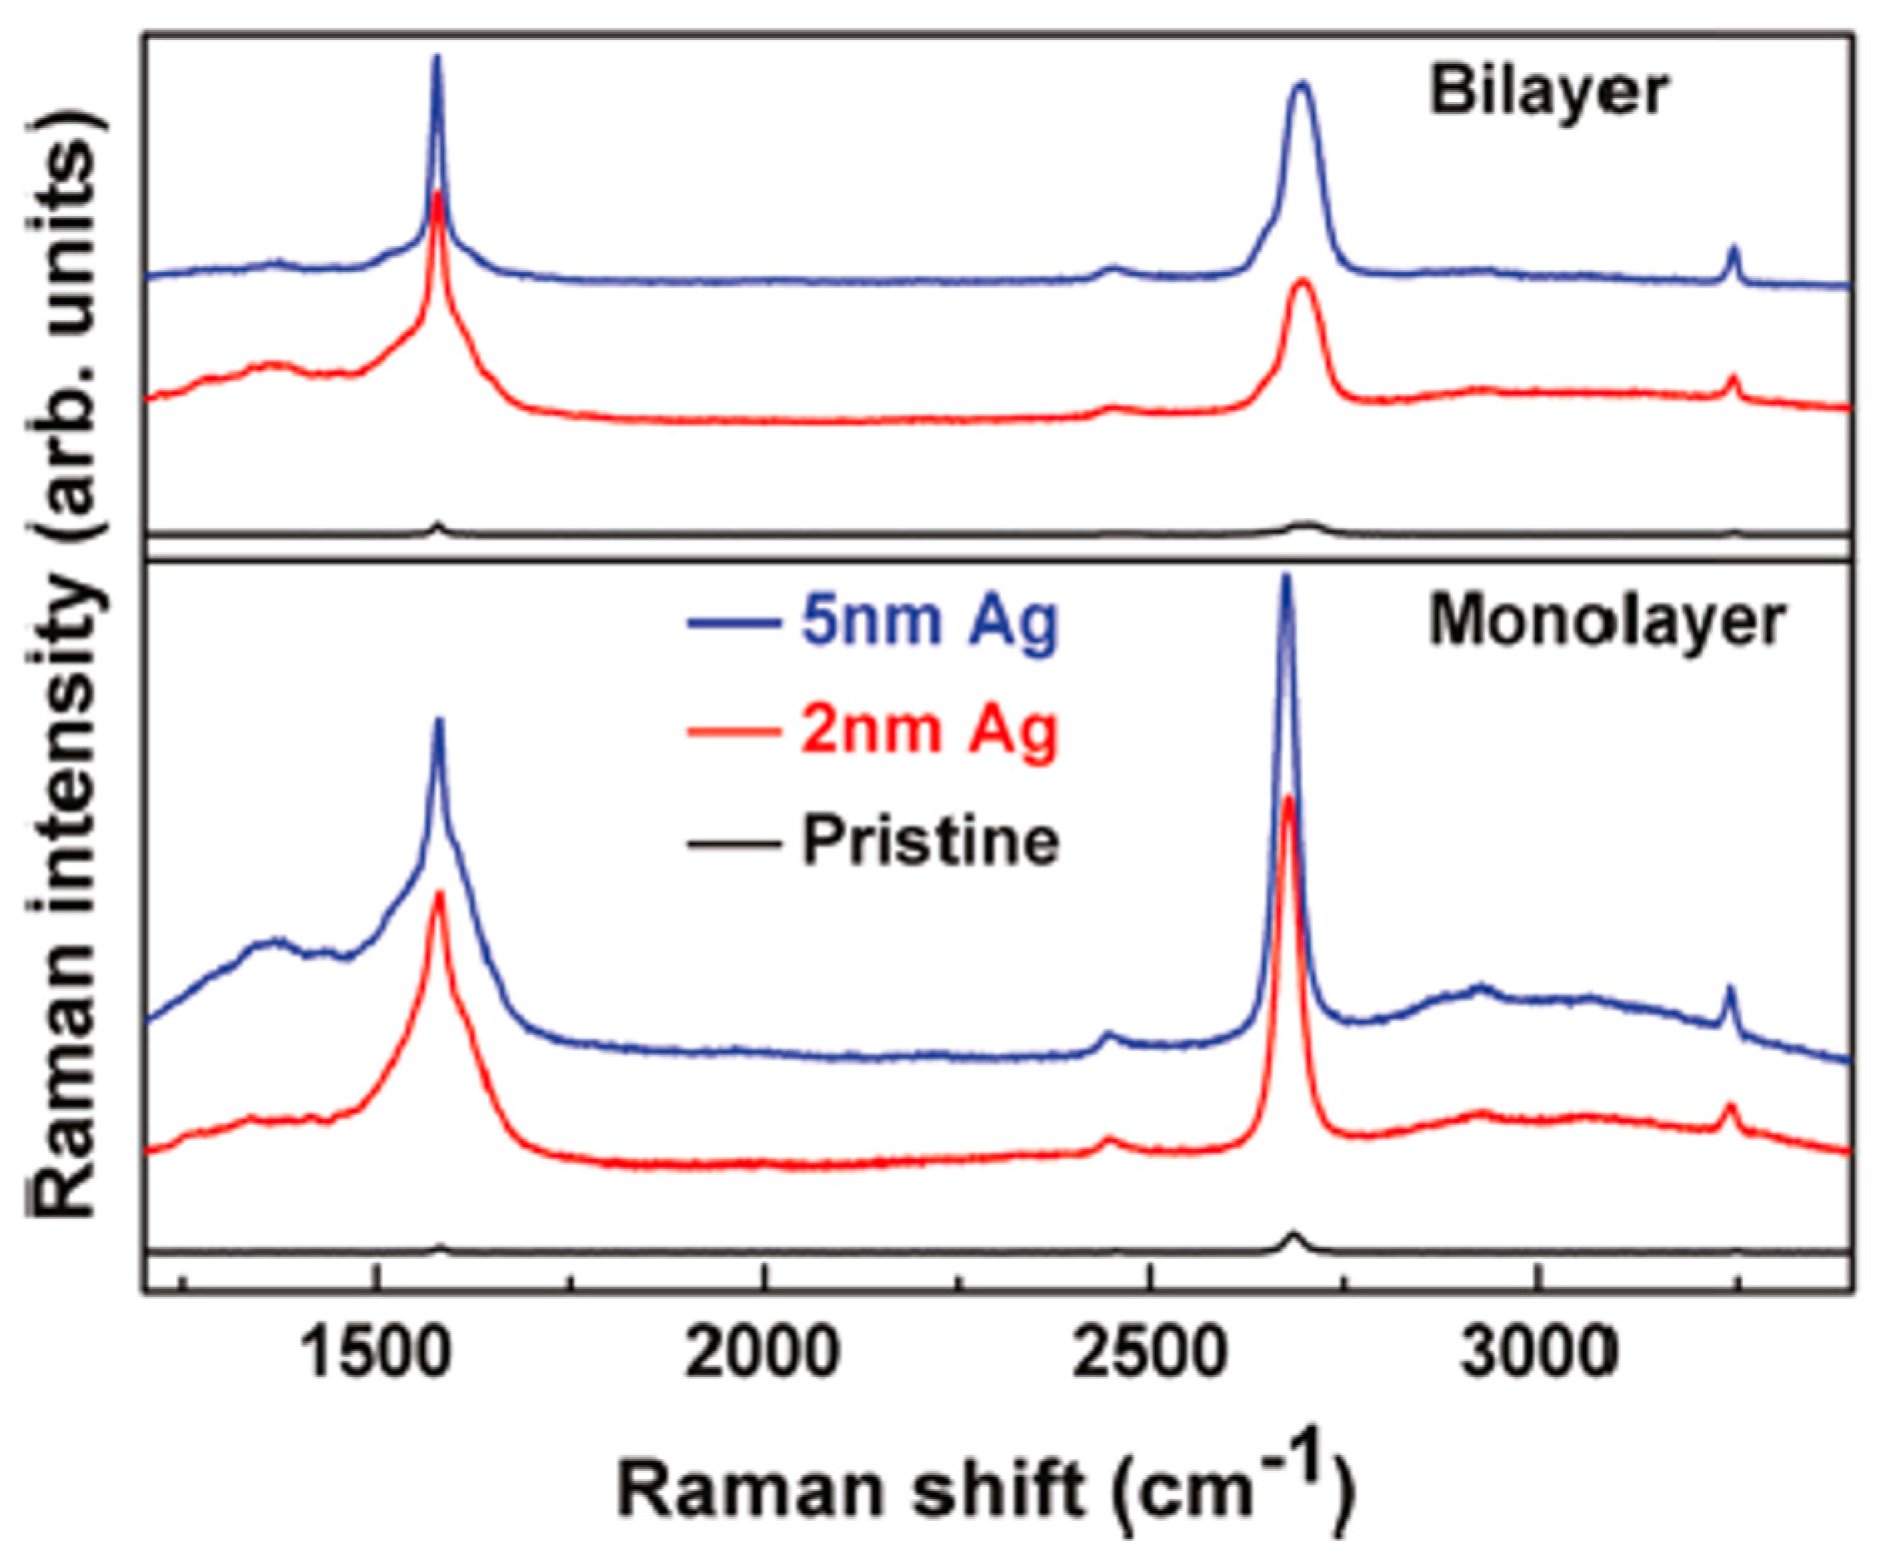
60], so, prepared graphene samples by mechanical exfoliation of graphite onto SiO
2/Si substrates or hexagonal boron nitride substrates. Raman spectroscopy was used to analyze the number of graphene layers. Au was deposited on the graphene layers by electron beam evaporation, having care, in addition, to produce reference samples were by depositing Au on graphite substrates. To induce morphological evolution of the Au on the substrates, subsequent annealing processes were performed. At each step of evolution, the authors performed Atomic Force Microscopy analyses to study the samples surface morphology, i.e., the Au NPs morphology, size, surface density and surface roughness.
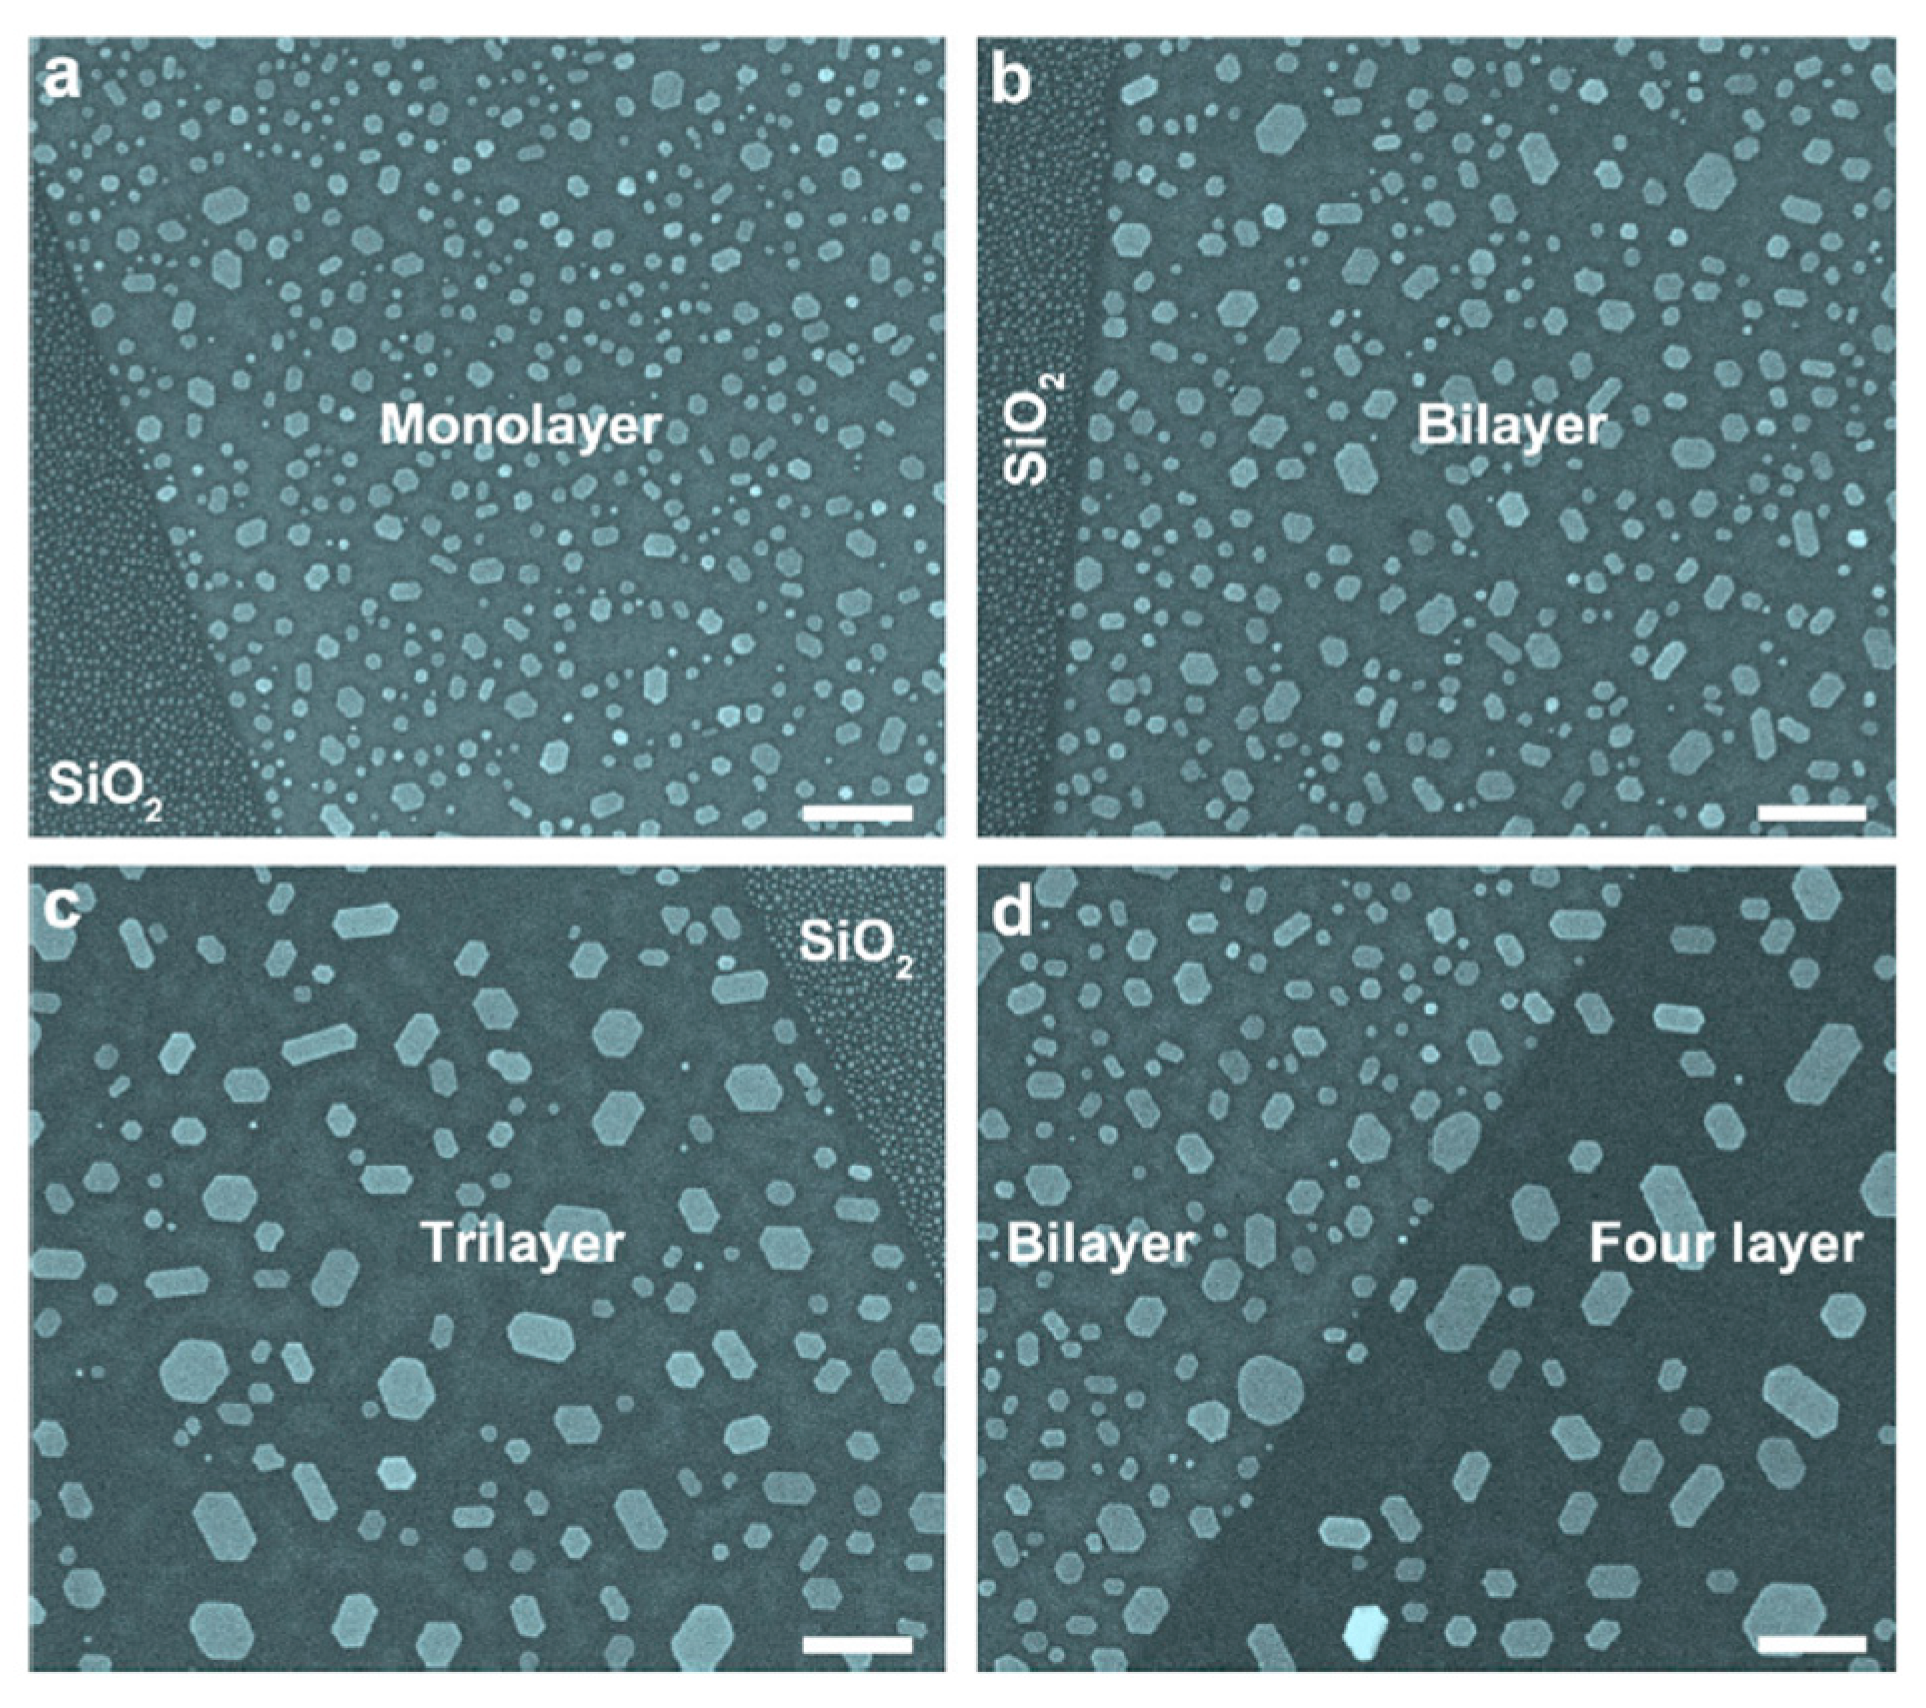
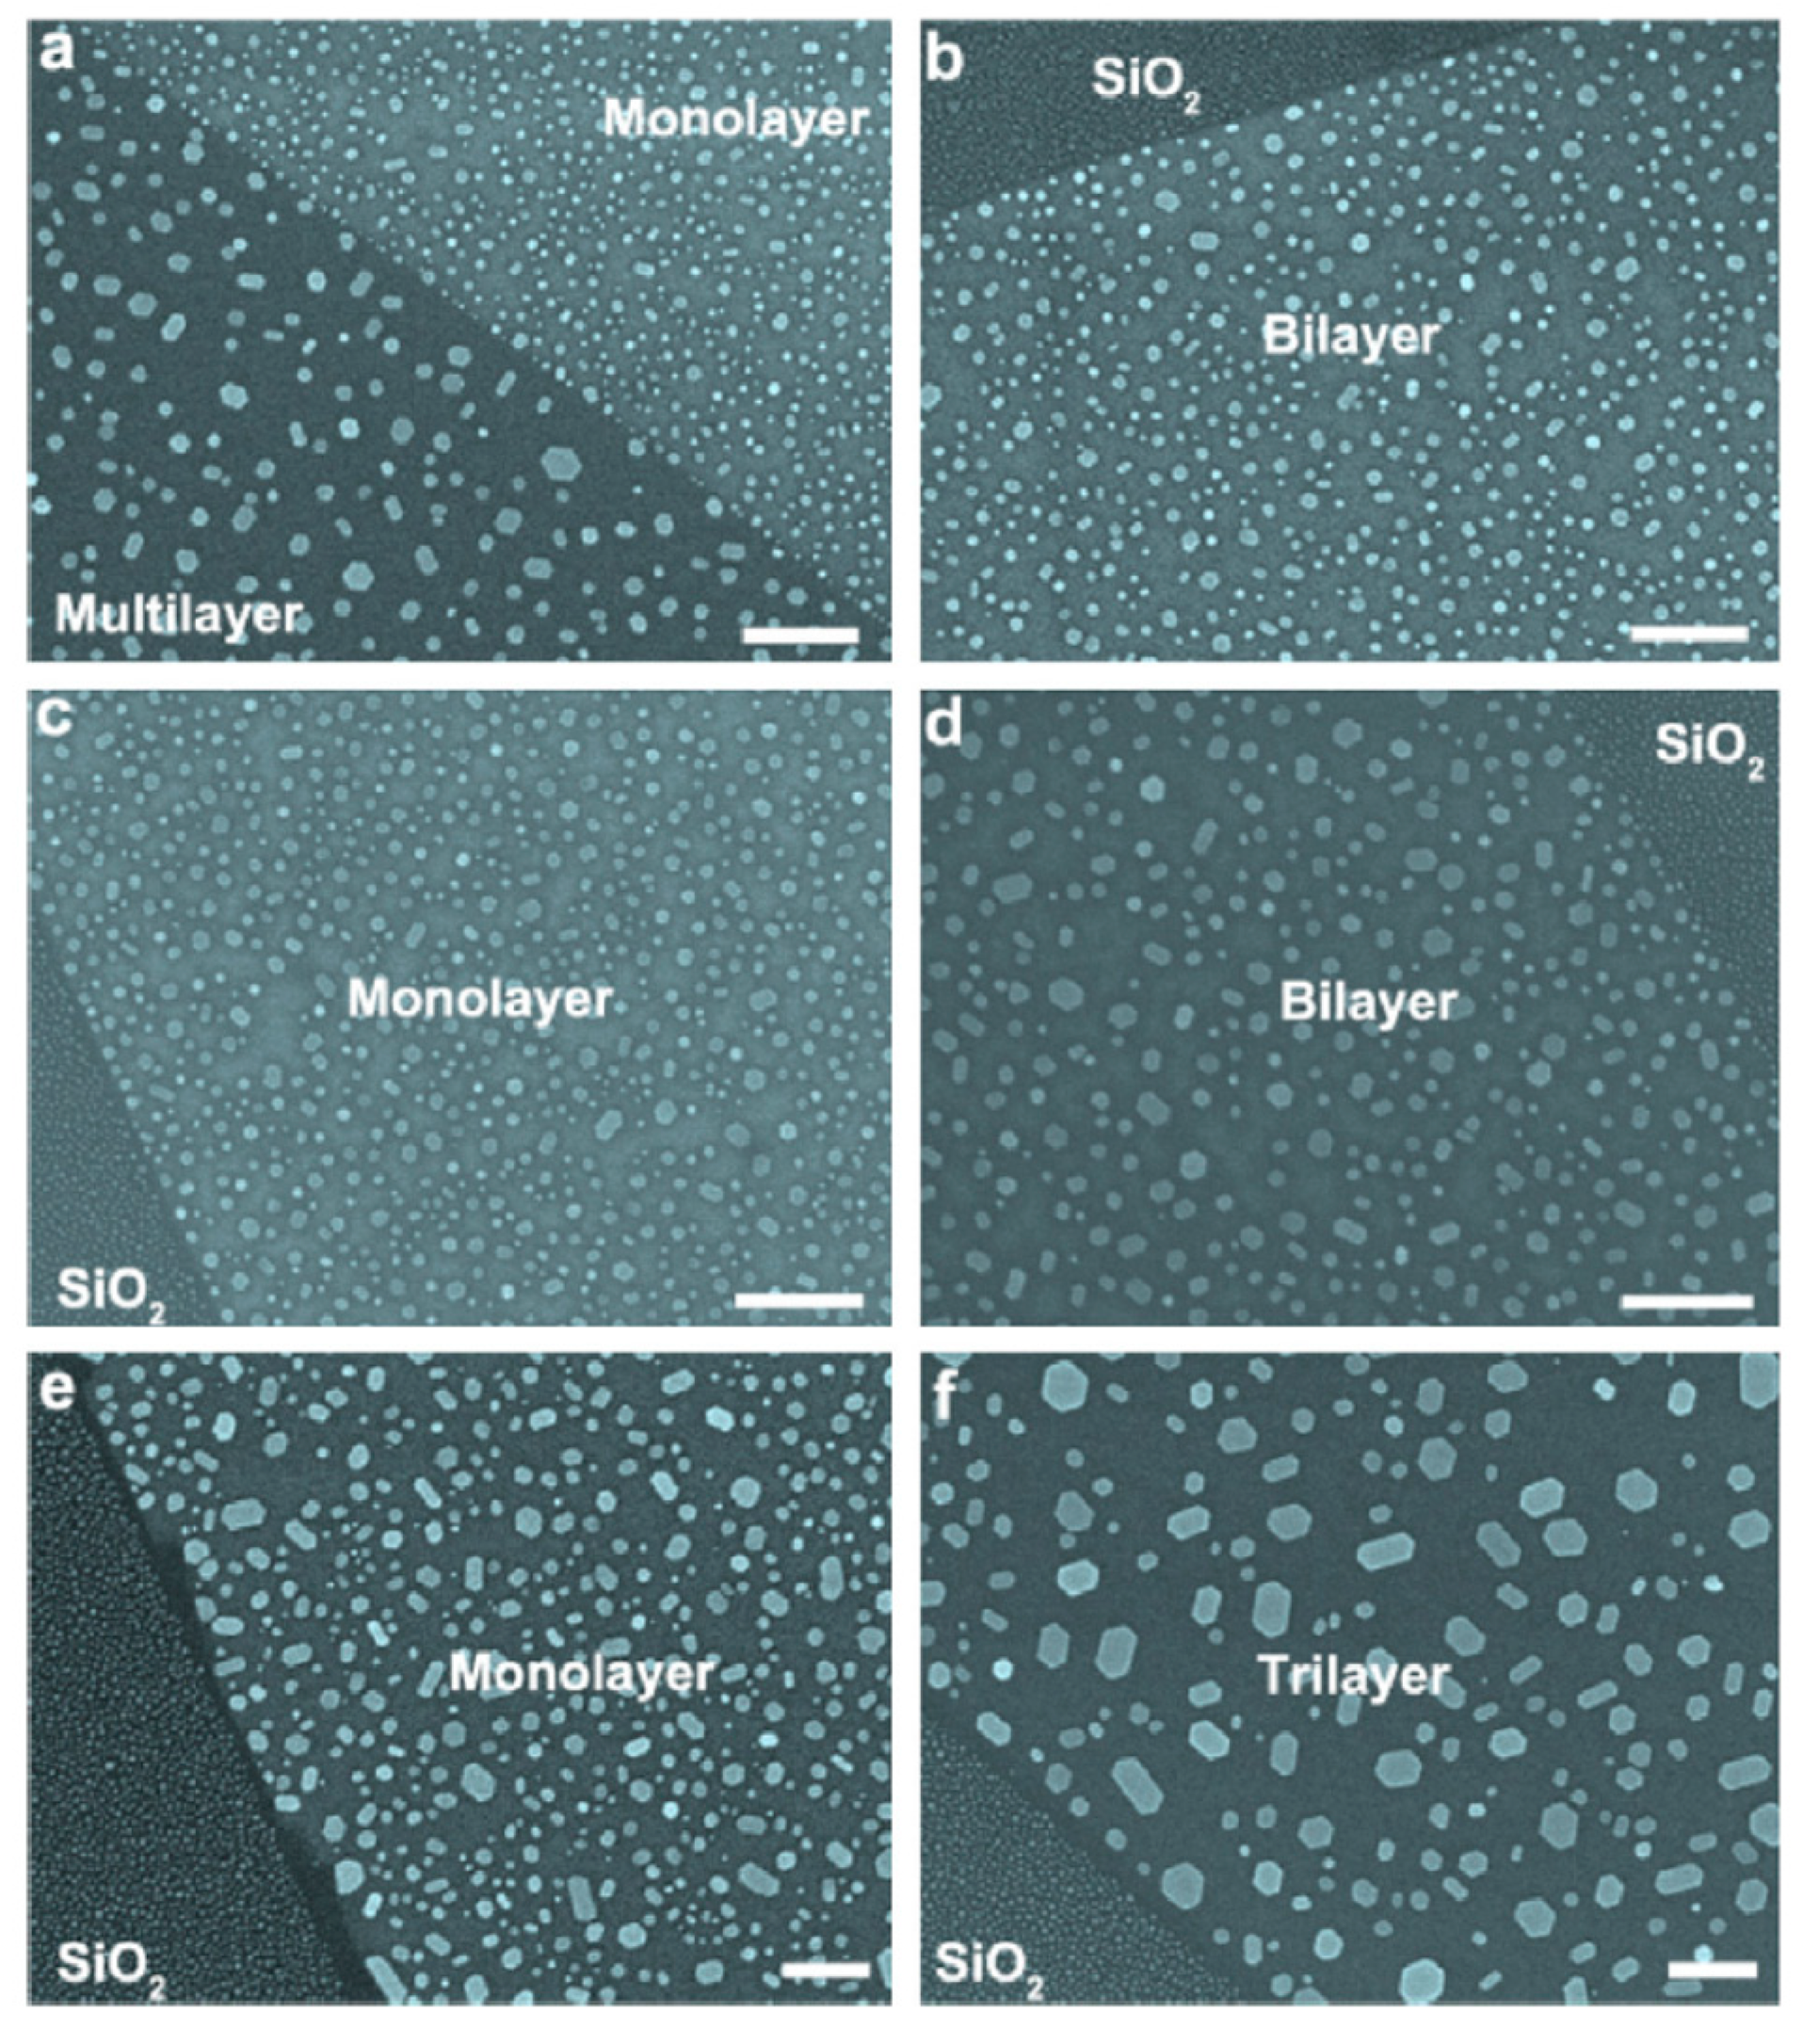
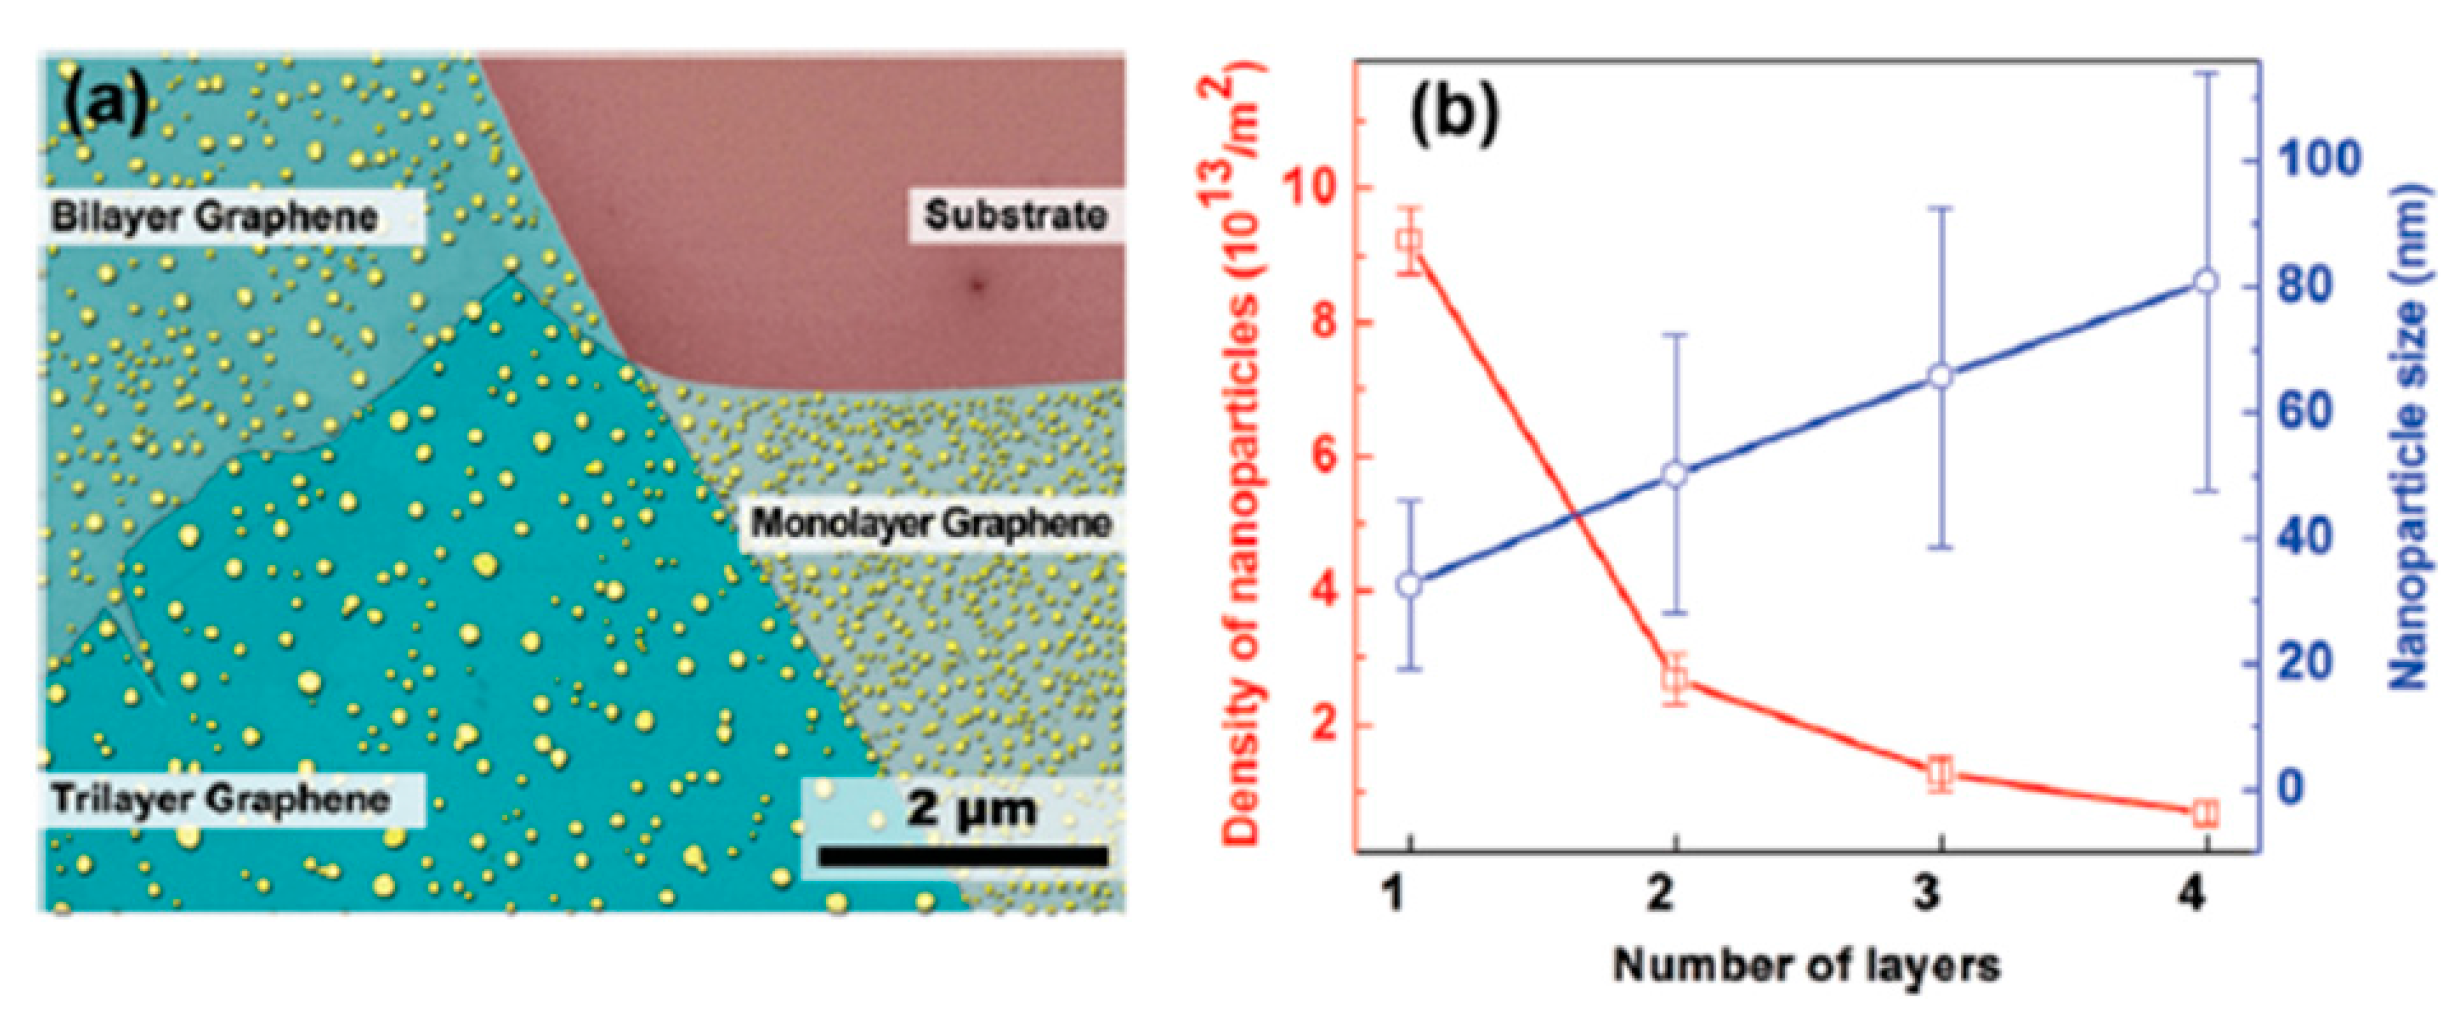
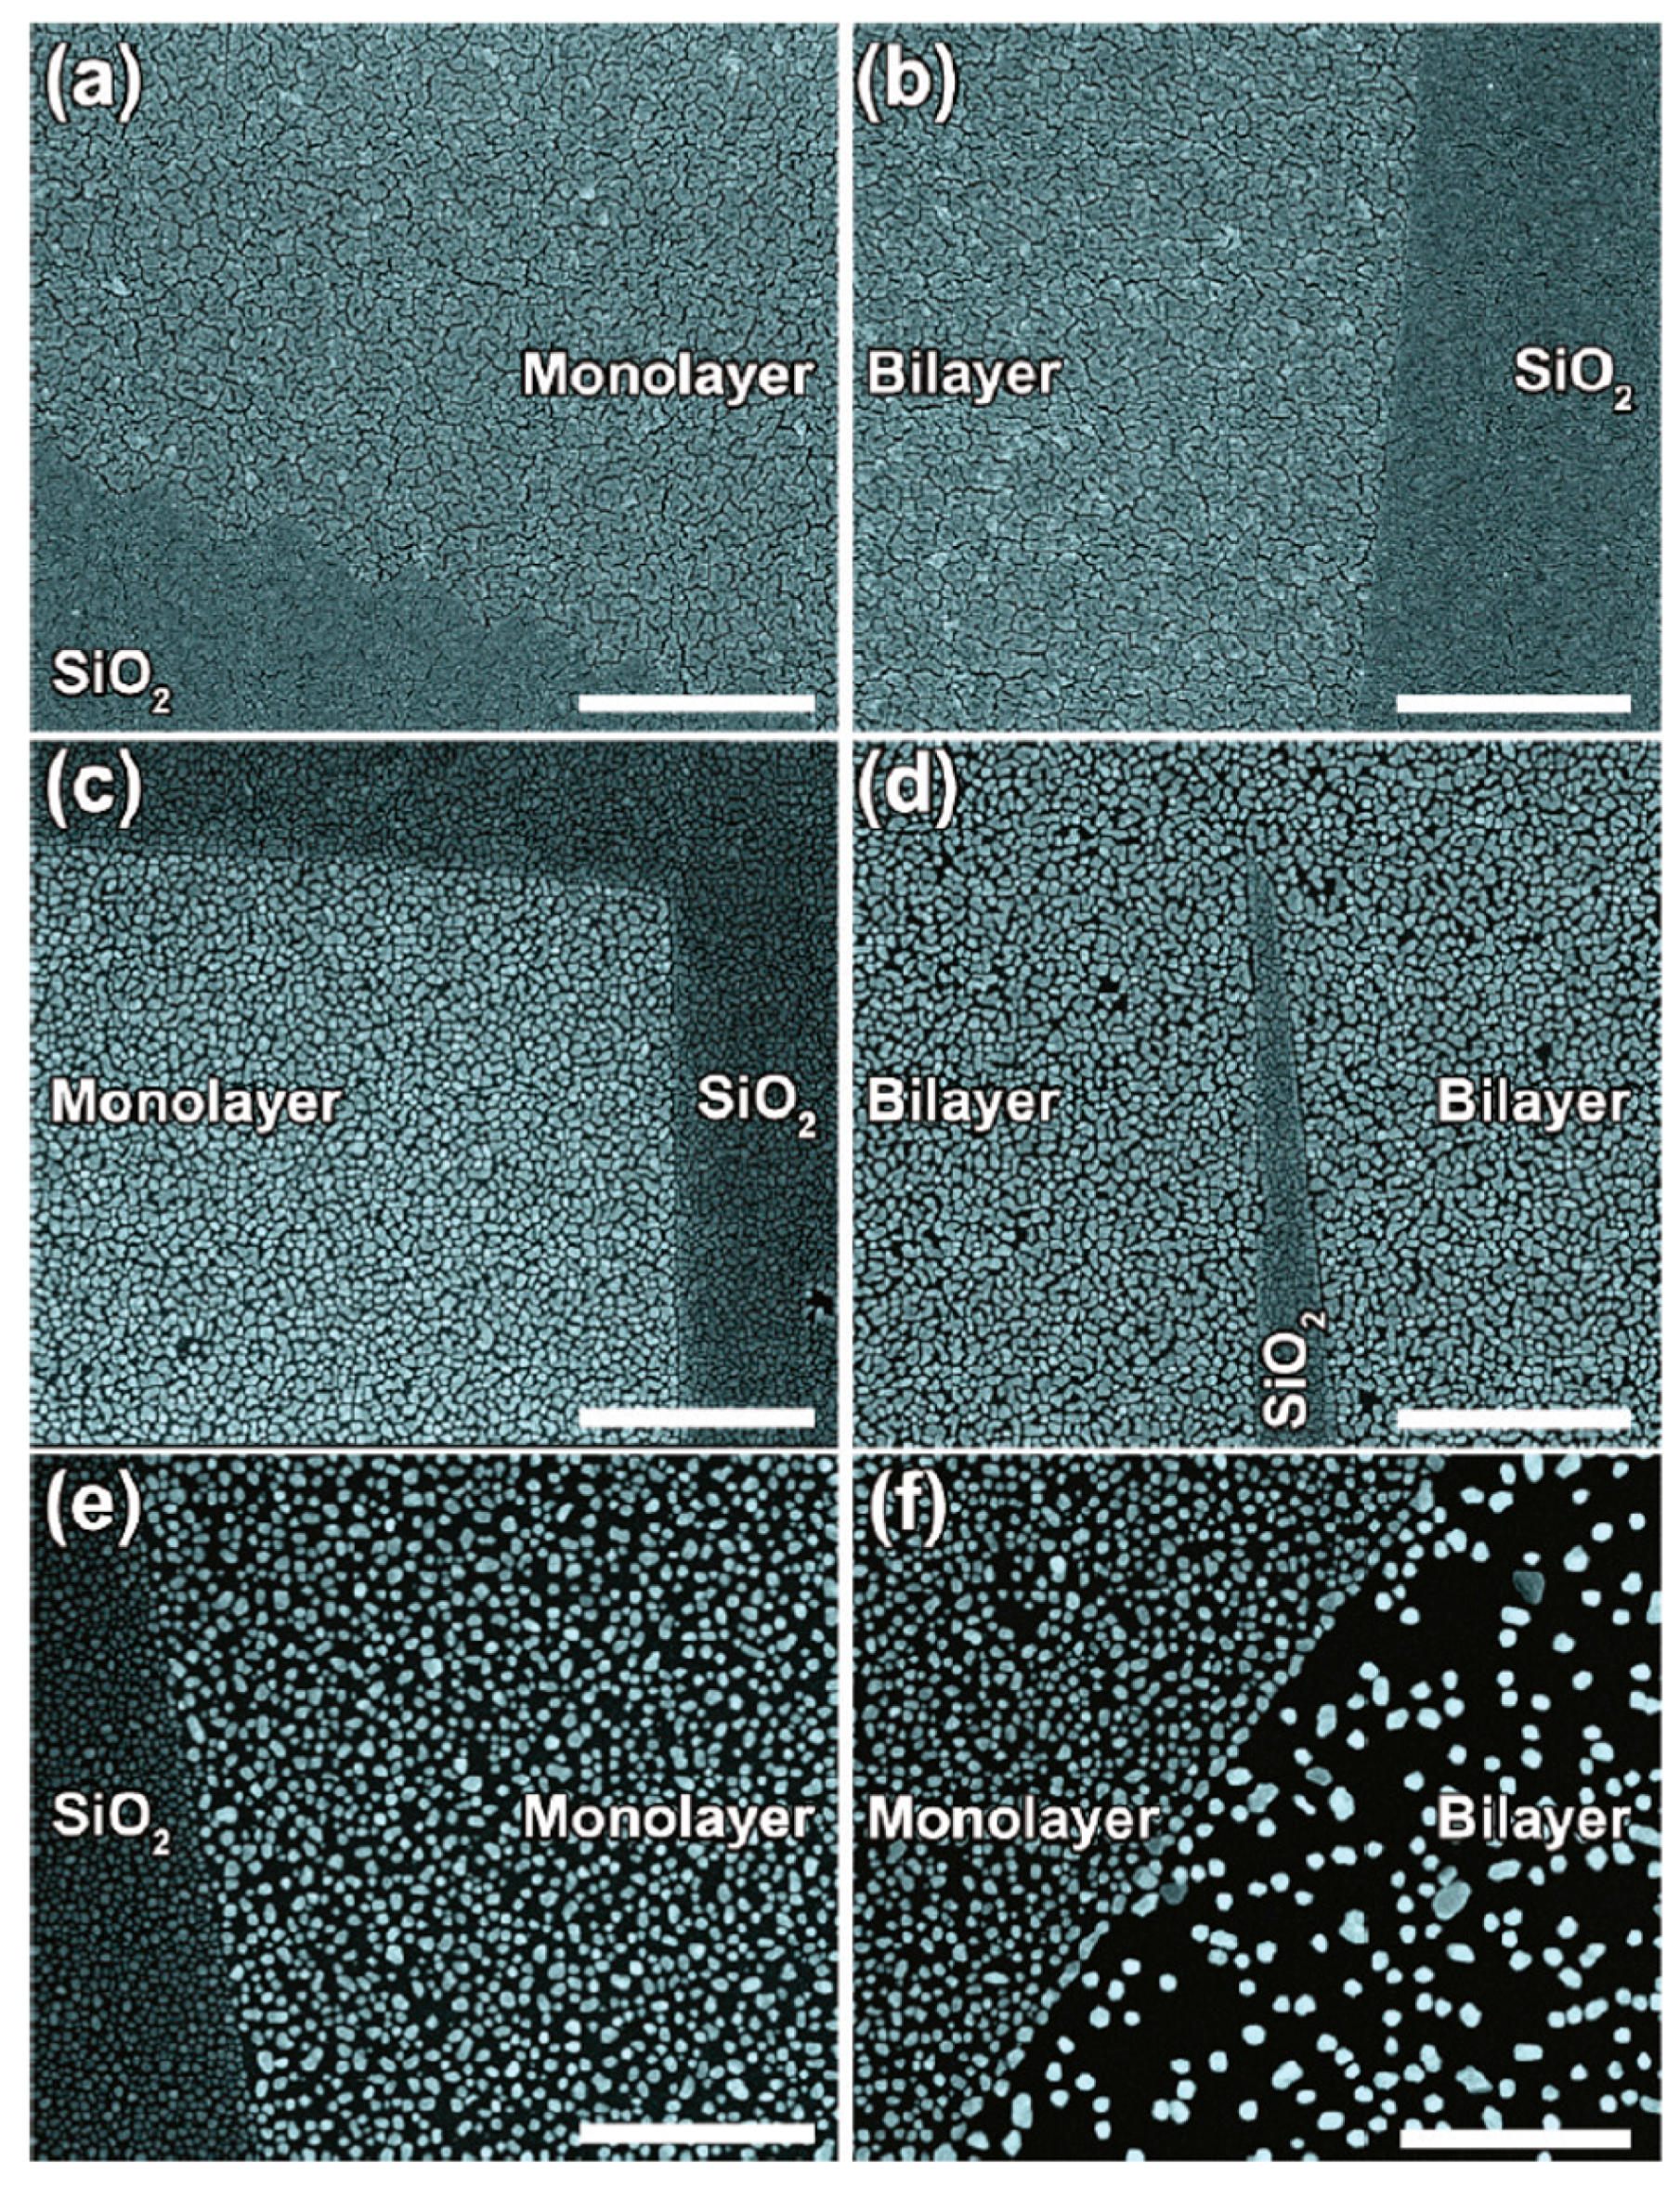
First of all, the authors deposited 0.5 nm of Au on single-layer (1 L) graphene and bilayer (2 L) graphene supported onto SiO
2/Si, and onto graphite surfaces maintaining the substrates at room temperature. Then, the Atomic Force Microscopy analyses allowed infer the following conclusions: on the graphite surface, Au NPs coalesce to form ramified islands. The large Au-Au binding energy (∼3.8 eV), drives the Au adatoms diffusion towards the joining and formation of small compact NPs. Once formed, these very small NPs diffuse slowly on the graphite and then they coalescence to form islands. Under the same deposition conditions on the 1 L graphene, Au NPs with a narrower-size distribution and higher surface density are obtained. Instead, concerning the Au NPs obtained on the 2 L graphene, some of these evidence an ongoing evolution from elongated islands structures to ramified structures. This difference with the Au NPs obtained on graphite is the signature of the lower diffusion coefficient of the Au adatoms on 1 L and 2 L graphene than on graphite. Further results are summarized by
Figure 20: by depositing 0.1 nm of Au, the observed density of Au NPs is about 1200 μm
−2 (
Figure 20a) on 1 L graphene. A 350 °C-2 h thermal process leads to the decrease of the surface density of the Au NPs to about 130 μm
−2 (
Figure 20c). Instead, on the graphite substrate, the thermal process causes a decrease of the Au NPs density from about 180 μm
−2 (
Figure 20b) to about 3 μm
−2 (
Figure 20d). These data confirm the thermal-activated nature of the NPs growth mechanism.
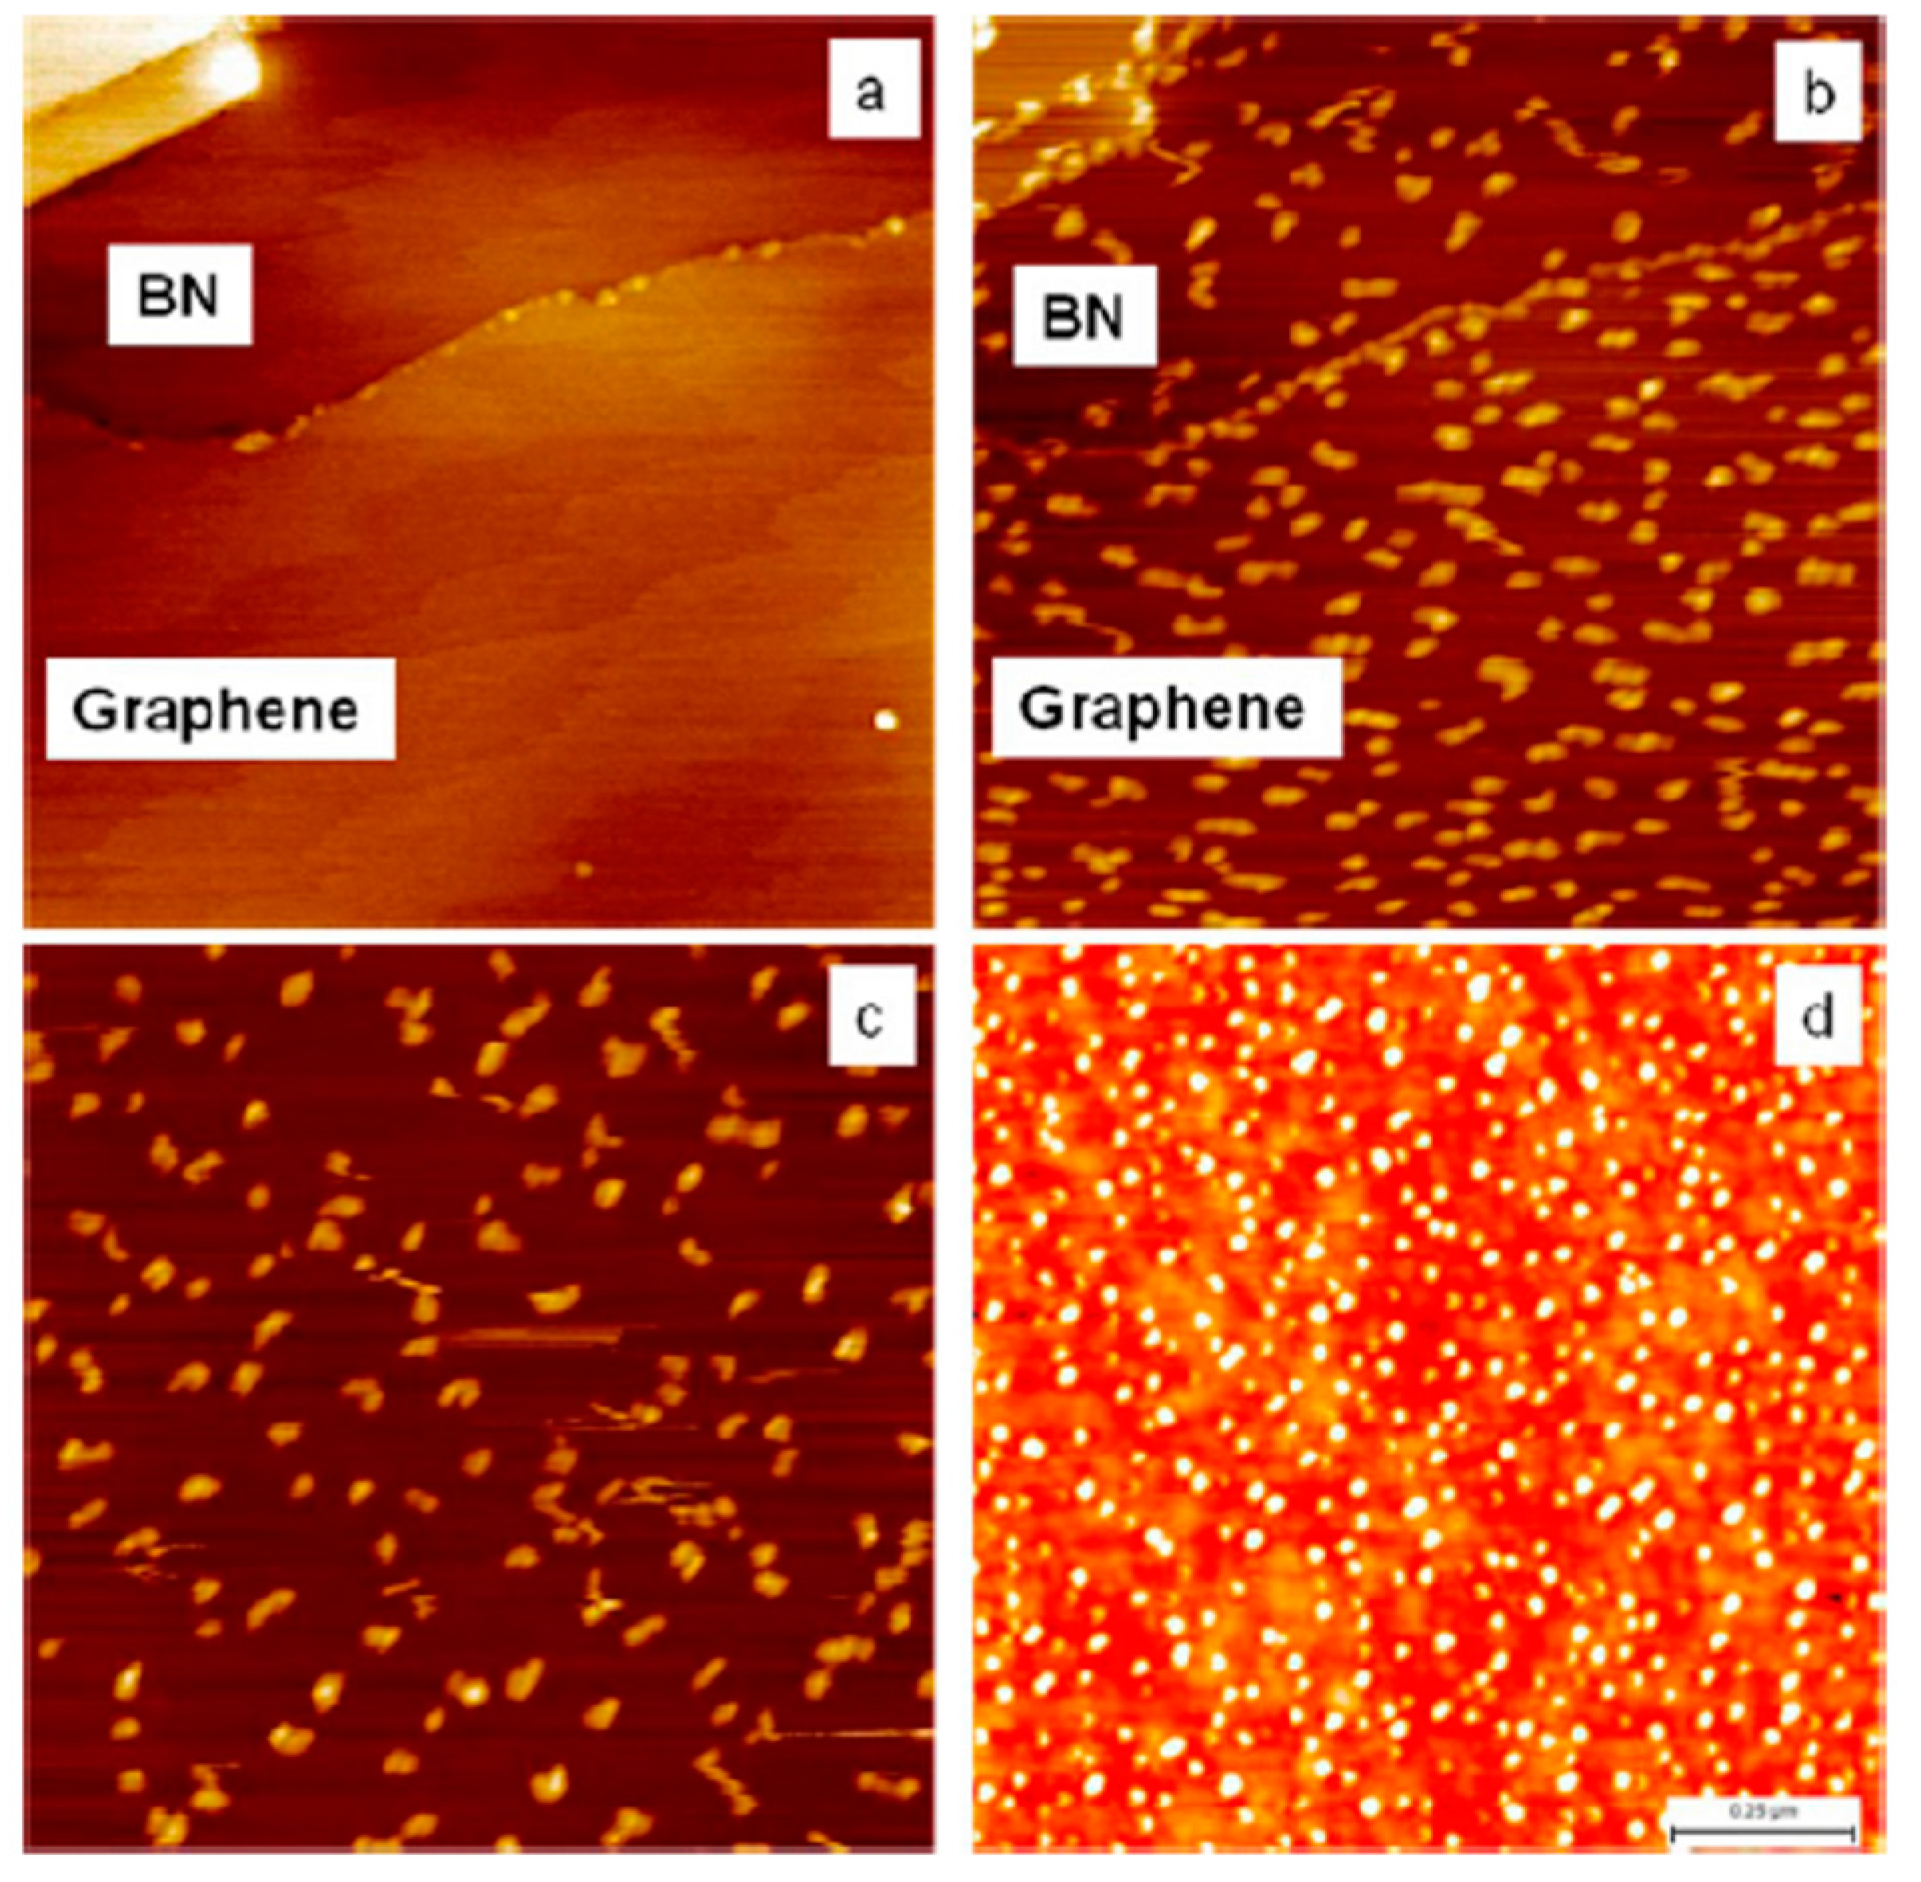
As a comparison, the authors performed similar studies for Au deposited on graphene supported onto hexagonal boron nitride (h-BN): this choice is dictated by the fact that graphene is known to be flatter on single-crystal h-BN than on SiO
2. So, the upper part of the image 21a shows the surface of h-BN presenting a roughness of 47 pm, while the bottom shows the h-BN surface supporting 1 L graphene, with a roughness of 54 pm. The other Atomic Force Microscopy images in
Figure 21 show the resulting Au NPs obtained by the deposition of 0.1 nm of Au on the surface of bare h-BN, on 1 L graphene supported on h-BN and on 1 L graphene supported on SiO
2. The comparison of these images allow us to conclude that the NPs growth is faster on h-BN and 1 L graphene supported on h-BN than on 1 L graphene supported on SiO
2.
At this point, once recorded these experimental data, Liu et al. [
60] exploited the mean-field nucleation theory to analyze these data so to extract quantitative information on the parameters involved in Au NPs morphological evolution processes. As the amount of deposited materials increases, three kinetic regimes for the Au clusters growth can be recognized: clusters nucleation, clusters growth, and steady-state. At the early stages of deposition, moving adatoms on the substrate explore a certain area in a certain time so that they can encounter each other and and, so, they have some finite probability to join (nucleation process) and form stable nucleii. The number of nuclei increases with time. However, in the same time, new atoms arrive from the vapor-phase and they can be captured by the preexisting nuclei. At enough high deposition time, so, the nuclei growth in cluster of increasing size and new nucleii are not formed: a steady state is reached. In this condition, the mean Au adatoms diffusion length is equal to the mean Au NP spacing and a saturation density for the nuclei is obtained. The authors, then, considered that, according to the mean-field nucleation theory, the nuclei saturation density n is predicted as n(Z)~N
0η(Z)(F/N
0ν)
i/(i+2.5)exp[(E
i + iE
d)/(i + 2.5)kT] being Z a parameter depending on the total deposition time, N
0 the substrate atomic density (cm
−2), η(Z) a dimensionless parameter, F is the rate of arriving atoms from the vapor phase (cm
−2 s
−1), ν an effective surface vibration frequency (∼10
11–10
13 s
−1), i the number of Au atoms in the critical cluster, E
i the Au atom binding energy in the critical cluster, and E
d the activation energy for the Au atom diffusion.
Clusters of size smaller than
i shrinks while clusters larger than size
i grow and form the stable NPs. The authors consider that in the examined experiments,
i should be small and, so, they analyze their experimental data on n(z) for
i = 1 and
i = 2 obtaining the values reported in
Figure 22: the Au adatom diffusion energy E
d and the corresponding diffusion coefficient D calculated as D = (a
2ν
d/4)exp[−E
d/kT] with a the graphene lattice parameter (0.14 nm) and ν
d the adatom attempt frequency (∼10
12 s
−1).
On the basis of
Figure 22 it is clear that the activation energy for the Au adatom diffusion process is higher on 1 L graphene on h-BN, 1 L and 2 L graphene on SiO
2 than on graphite and bare h-BN. In addition, it is higher on 1 L graphene on SiO
2 than on 2 L graphene on SiO
2 which is, in turn, higher than 1 L graphene on h-BN.
Now, the question concerning why these differences are observed arises. In this sense, the authors, first of all, note that adatom diffusion is affected by the surface strains which is, in turn, related to the surface roughness. A compressive strain of the surface reduces the energy barrier for the adatom diffusion while a tensile strain tends to increase it. In its free-standing configuration, 1 L graphene displays ripples with about 1 nm height variation. In contrast, when supported and annealed on SiO
2/Si substrates, graphene follows the local SiO
2 roughness: the graphene−SiO
2 van interaction energy is balanced by the elastic deformation energy of graphene with the consequent increase of the graphene roughness with respect to its free-standing configuration. The Atomic Force Microscopy measurements by Liu et al. [
60] show that 1 L graphene on SiO
2 presents a roughness 8 times higher than bulk graphite. On this rough graphene surface, there will be regions of both concave and convex curvature. The Au adatoms have, locally, different mobility on these different-curvature regions: within regions where they have a lower mobility then their nucleation in small clusters is favored with respect to defect-free graphite. A further aspect is that the energy barrier for the adatoms diffusion increases as the bonding strength of Au with the C atom increases: 2 L graphene is more stable than 1 L graphene due to the π bonding between the layers. In addition, the 2 L graphene has a lower roughness compared to 1 L graphene. Both factors should create weaker Au bonding and, thus, faster diffusion of the Au adatoms on 2 L graphene. About the diffusion of Au atoms on 1 L graphene on h-BN: according to the experimental data the mobility of the Au adatoms on 1 L graphene supported on h-BN should be higher than on 1 L graphene supported on a SiO
2 substrate. However, the calculations in
Figure 22 lead to the opposite conclusion which the authors impute to increased van der Waals forces between 1 L graphene and SiO
2 with respect to 1 L graphene and h-BN. This condition should lead to the increased mobility of the Au adatoms on 1 L graphene supported on h-BN.


