1. Introduction
The Antarctic and Southern Ocean influence the climate of the entire world. For instance, the sea level of the oceans is dependent on Antarctic ice sheet shifts caused by climate change [
1,
2]. The West Antarctic Peninsula is especially vulnerable to the impact of rising temperatures, as it is one of the most rapidly warming regions in the world [
3,
4]. However, it should be noted that a cooling effect was recently observed in this region [
5,
6]. Marine-terminating glaciers are unique areas of the Antarctic Peninsula region sensitive to changes in the basal water supply as well as sensitive to the thinning of the terminus, with faster flow leading directly to the sea level rise [
7]. According to Vaughan [
8], the velocity of glacier melting in this area doubled from 1950 to 2000, and provided increased meltwater and sediment influx, which changes the functional attributes of marine ecosystems [
4].
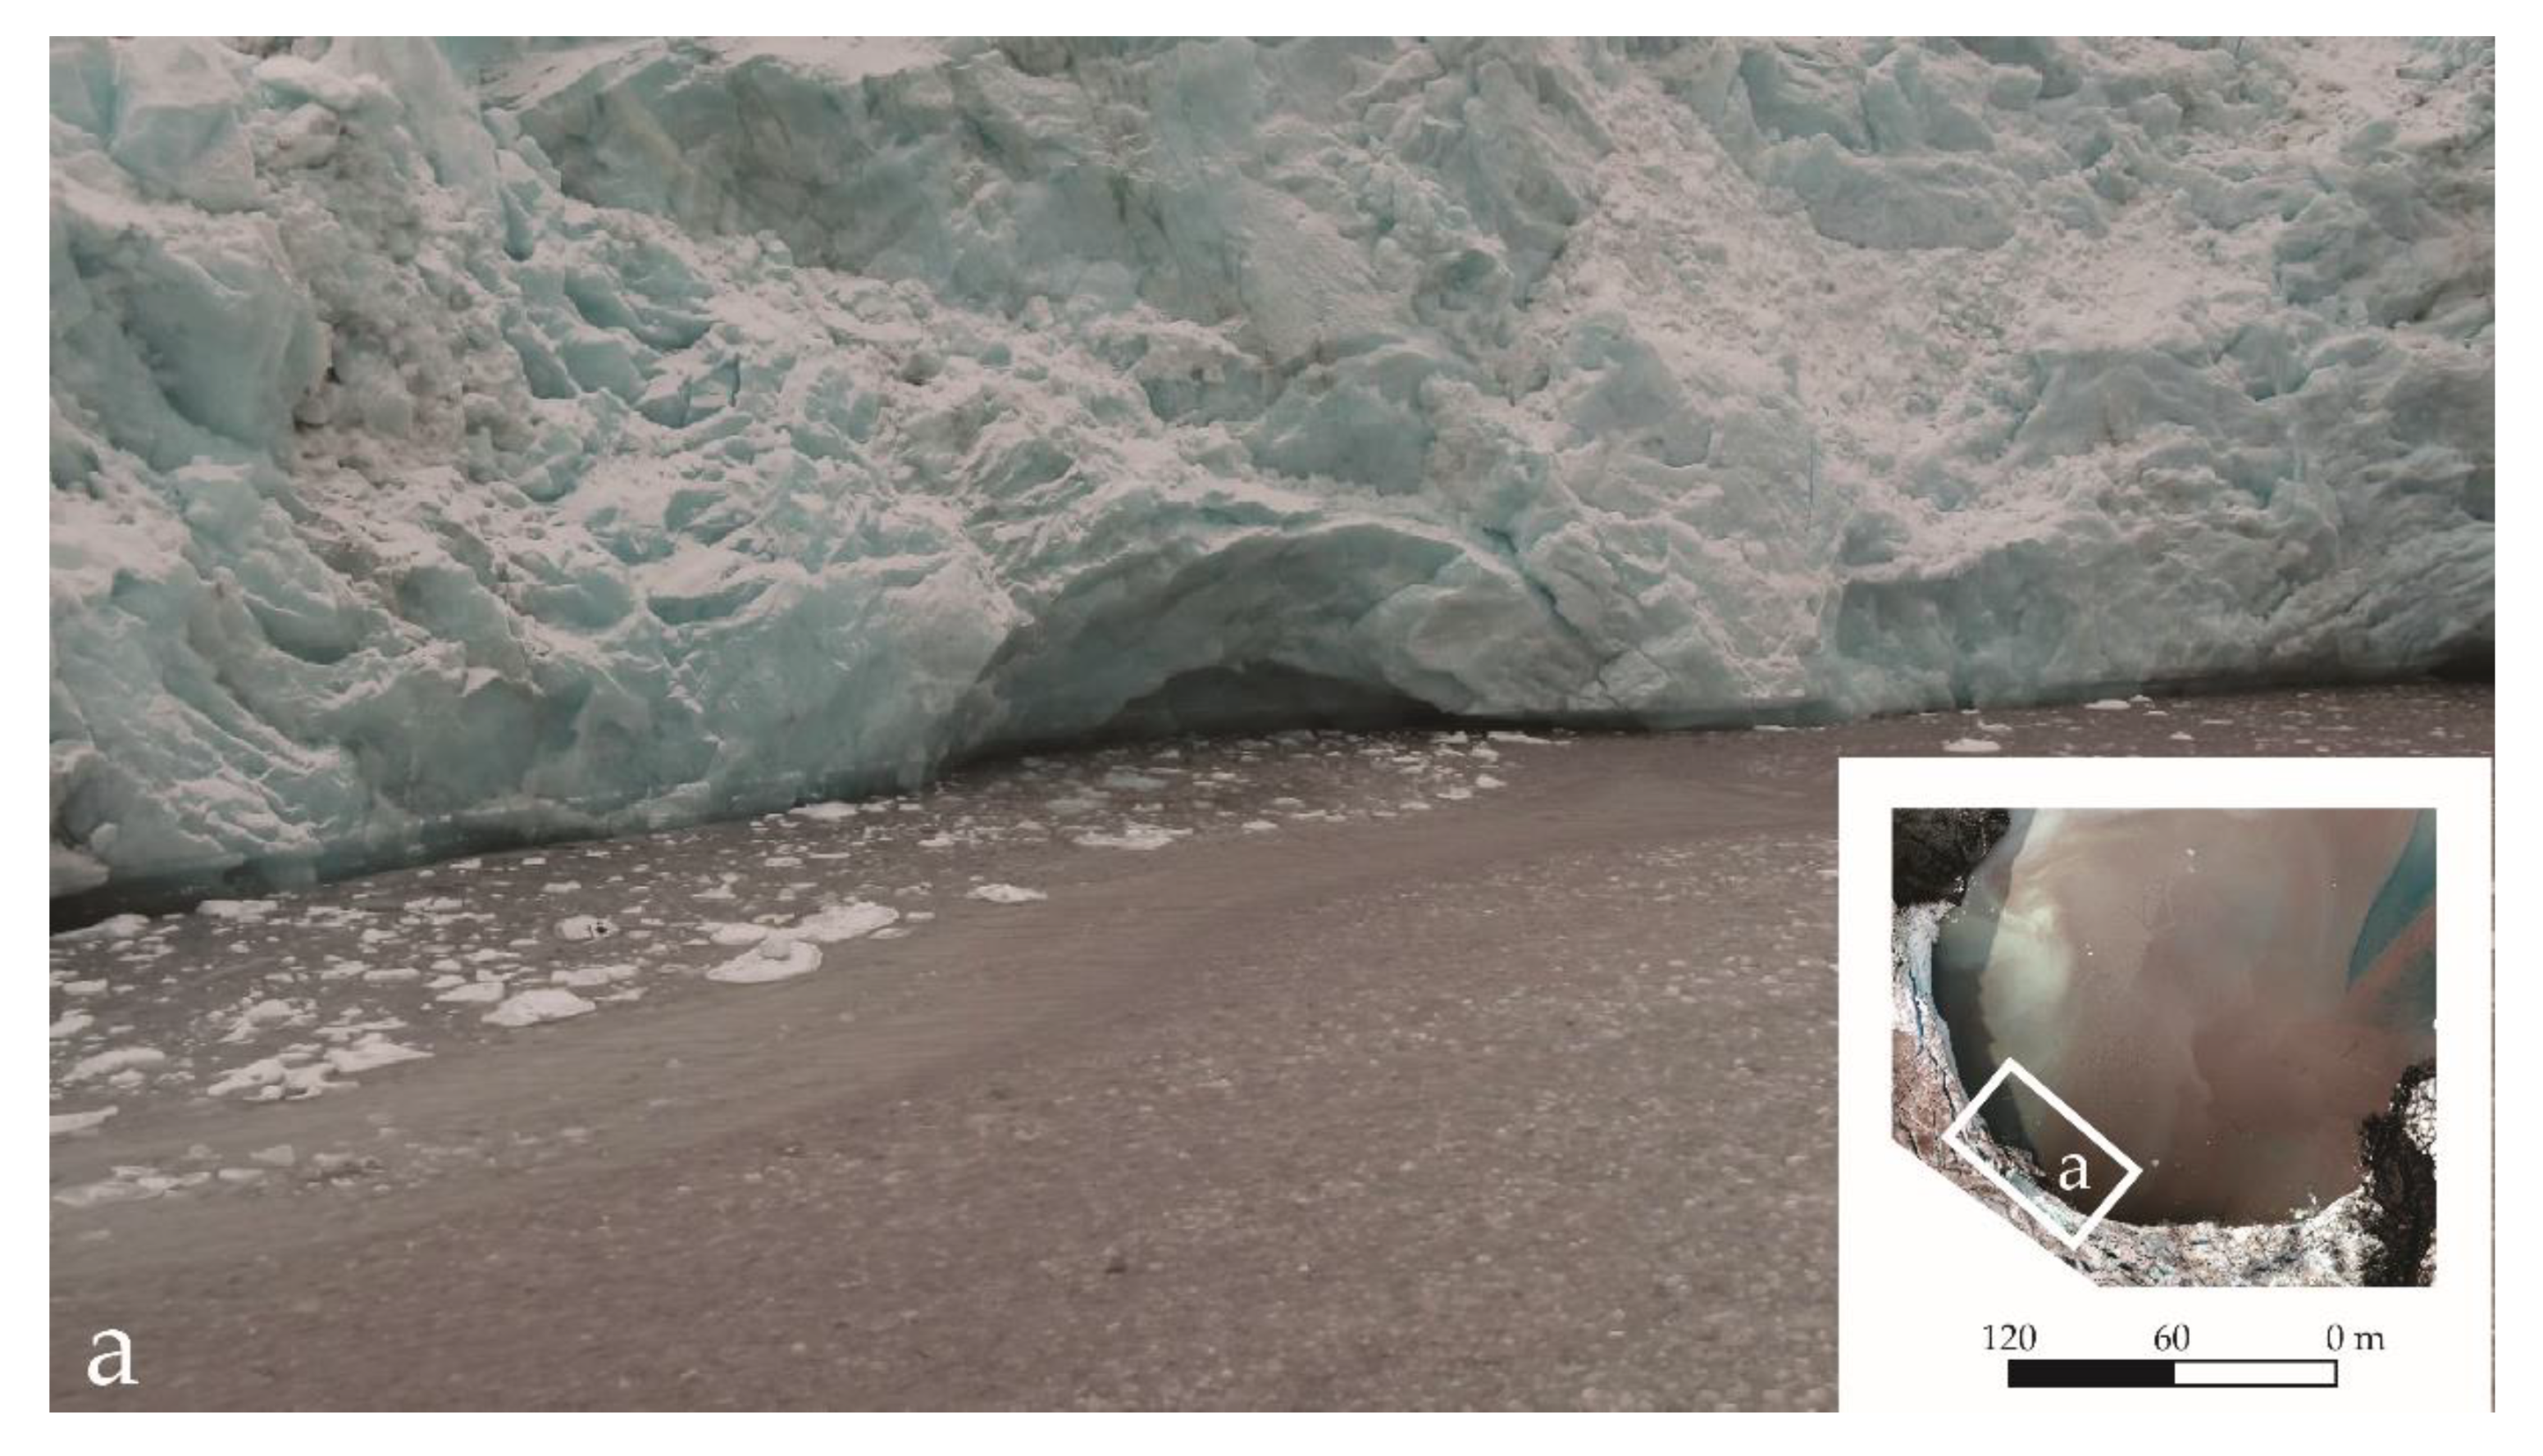
Sediment discharge in glacier meltwater is caused by two distinct mechanisms [
9,
10]. The first mechanism is triggered by subglacial water pressure creating cracks in bedrock that allow residue transport through upper ice levels, and the second mechanism is caused by the abrasion of bedrock by the rocks suspended in the basal ice layer. This sediment is transported with meltwater as subglacial discharge to the inlet or fjords [
11,
12,
13,
14,
15,
16,
17] (
Figure 1). If enough sediment and meltwater is provided, suspended matter will surface and form high-turbidity plumes on the water surface [
18] (
Video S1).
A large glacial sediment discharge has an impact on the salinity and temperature of seawater [
4], biodiversity, the productivity as well aswell-being of marine flora and fauna, and, dependent on the latter, land animals and birds [
19,
20,
21,
22,
23,
24,
25]. Consequently, changes in polar ecosystems require monitoring. However, due to thelimitations created by harsh climates and terrain inaccessibility, there has been a recent shift from an emphasis on field work measurements to remote sensing analysis [
10,
13,
18,
26,
27,
28]. In contrast to West Greenland in the Arctic, where river-fed plume monitoring is relatively common [
28,
29,
30,
31], these kinds of observations in Antarctica remain scarce, while limitingthe identification of plumes and their influences on ecosystems. Moreover, Hodgkins [
29] claimed that “Plume monitoring, therefore, requires validation in a range of environments and in different seasons.”
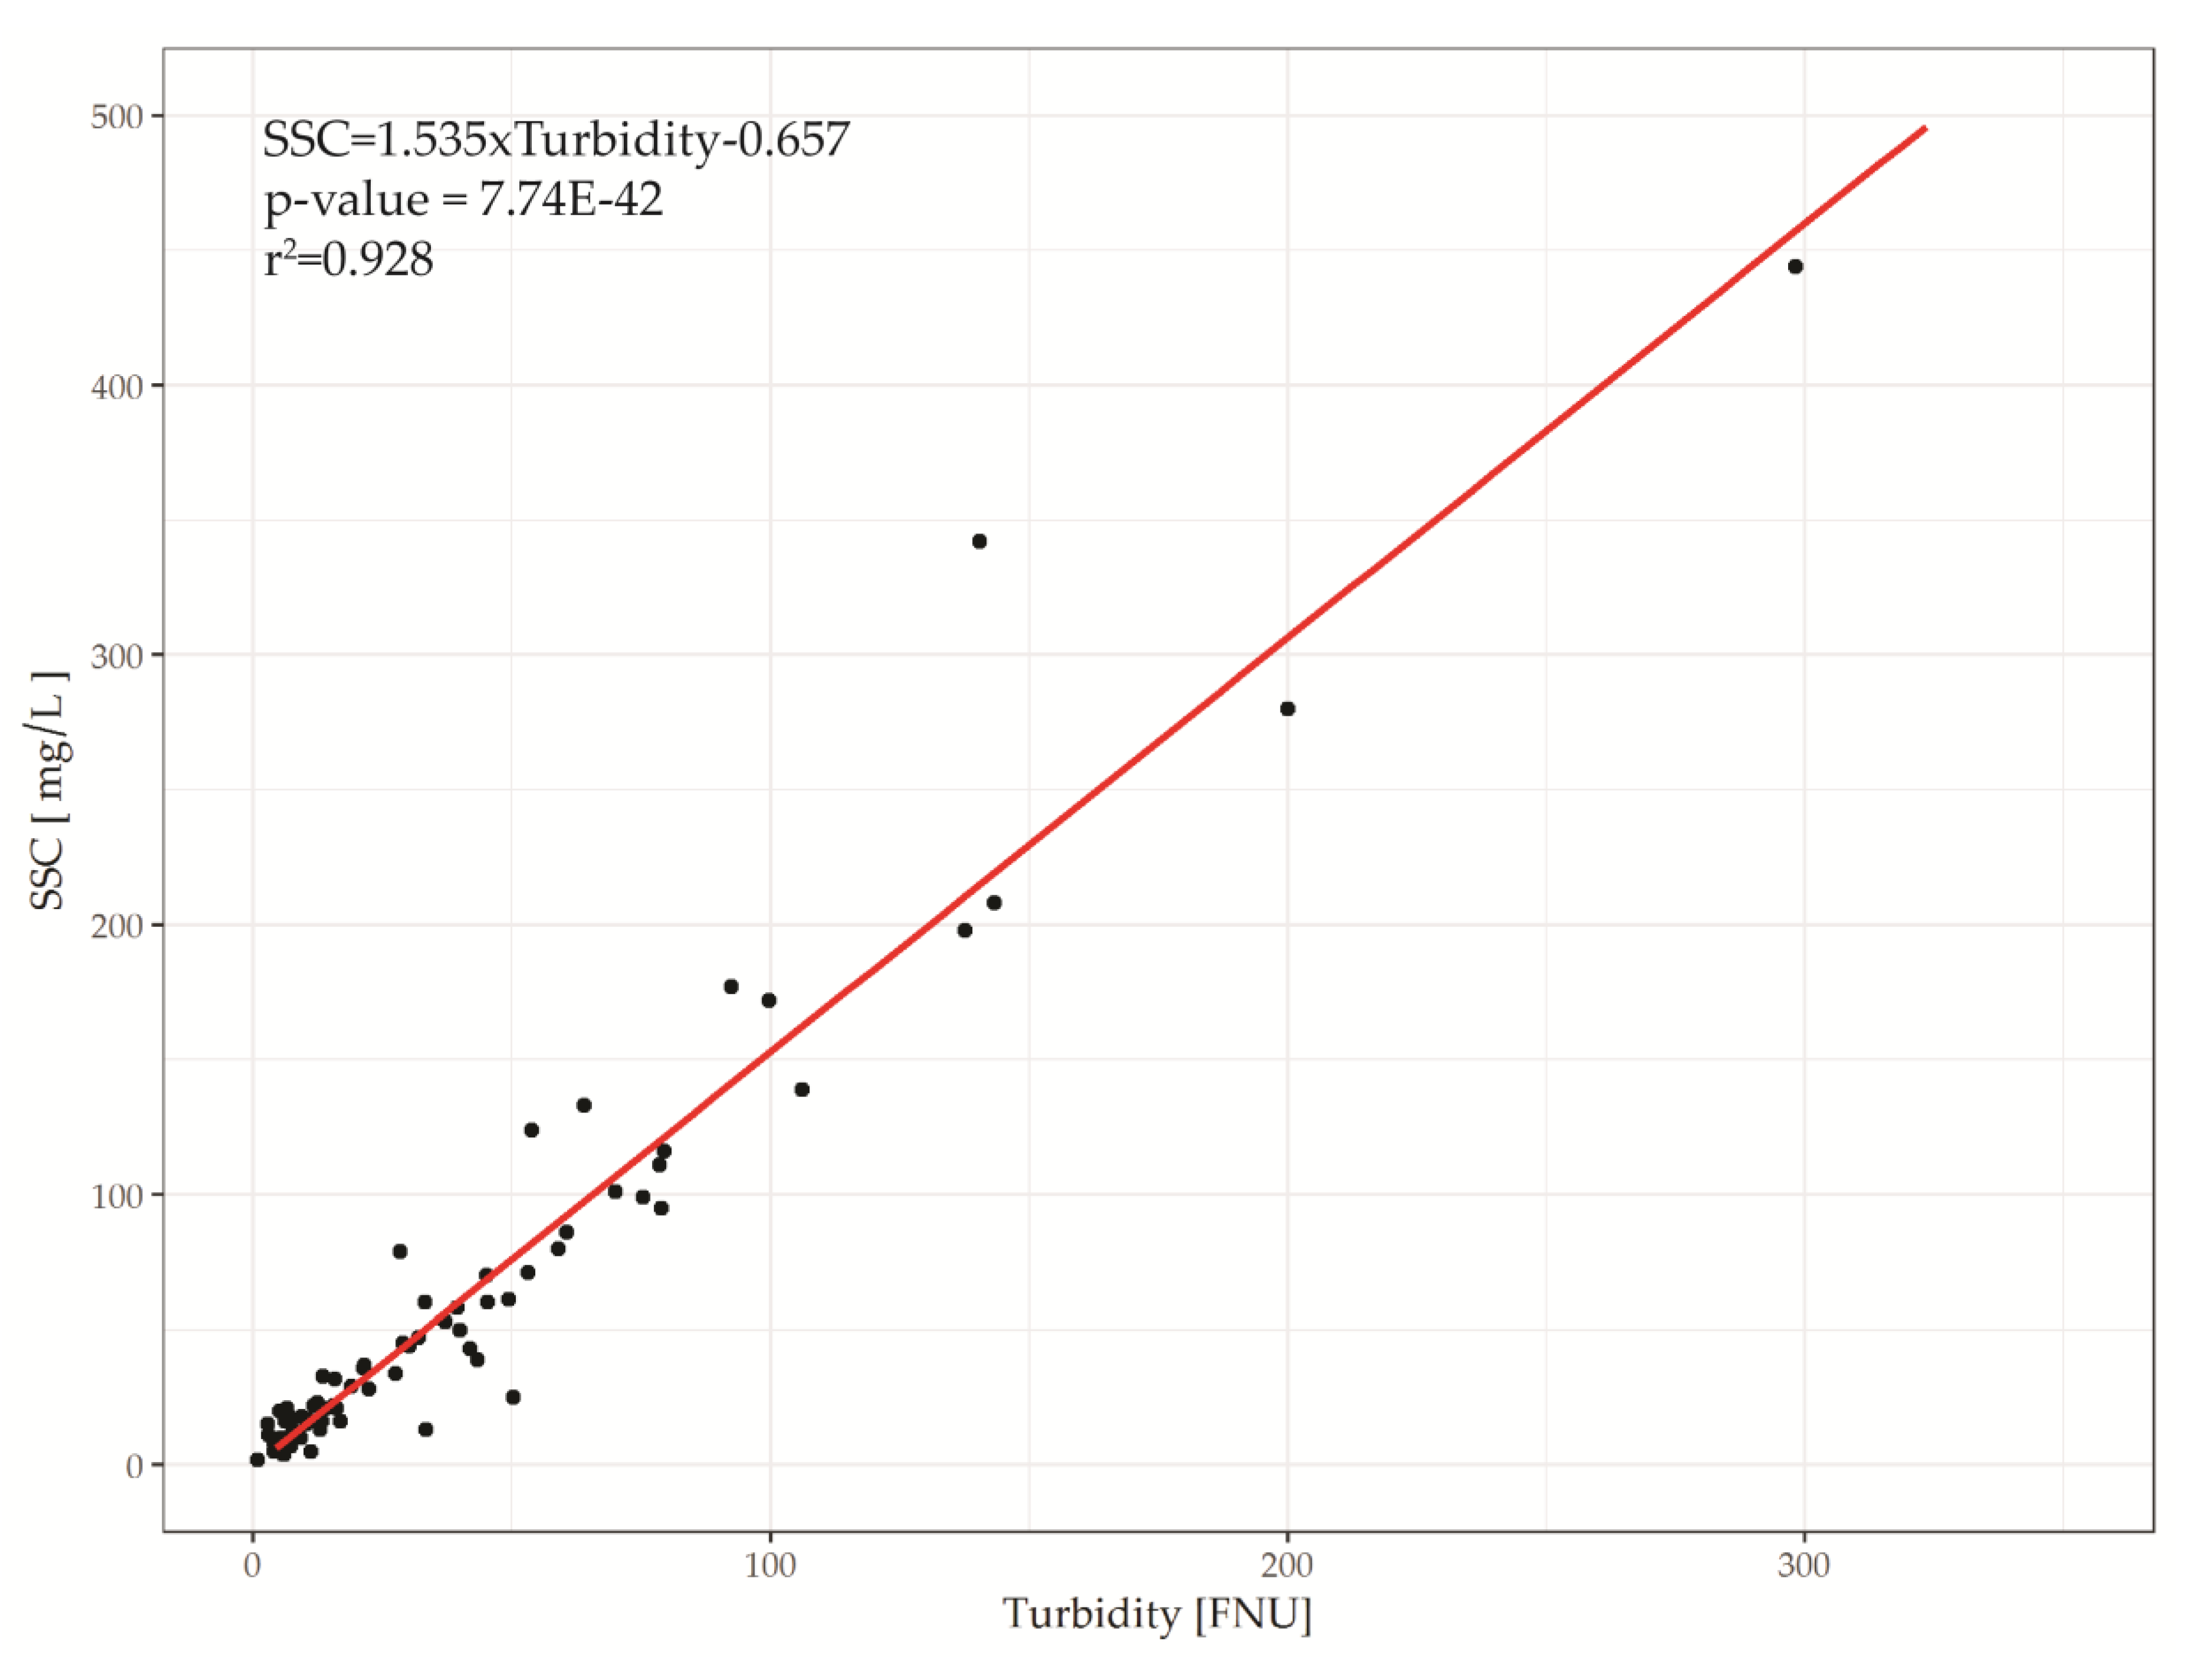
Satellite observation of water turbidity has become an indicator fordetermining the water quality but is also a proxy for the suspended-sediment concentration (SSC) [
32]. Observations of ocean water optical properties, specifically variations in turbidity, using remote sensing methods, have been intensively conducted worldwide [
32,
33,
34,
35]. However, the use of similar methods in coastal monitoring research in the polar regions is still relatively limited [
36]. The main reasons for such limitations are extensive cloud coverage in polar marine region monitoring and the occurrence of polar day and polar night, which reduces the chances of satellite monitoring. Fortunately, unmanned aerial vehicle (UAV) technological advancements now allowobservations of spatial and temporal processes and phenomena that were previously unachievable through conventional remote sensing methods [
37]. The main advantages of using UAV are the high pixel resolution and the possibility of choosing the place and time of the flight, adapted to the needs of the research.
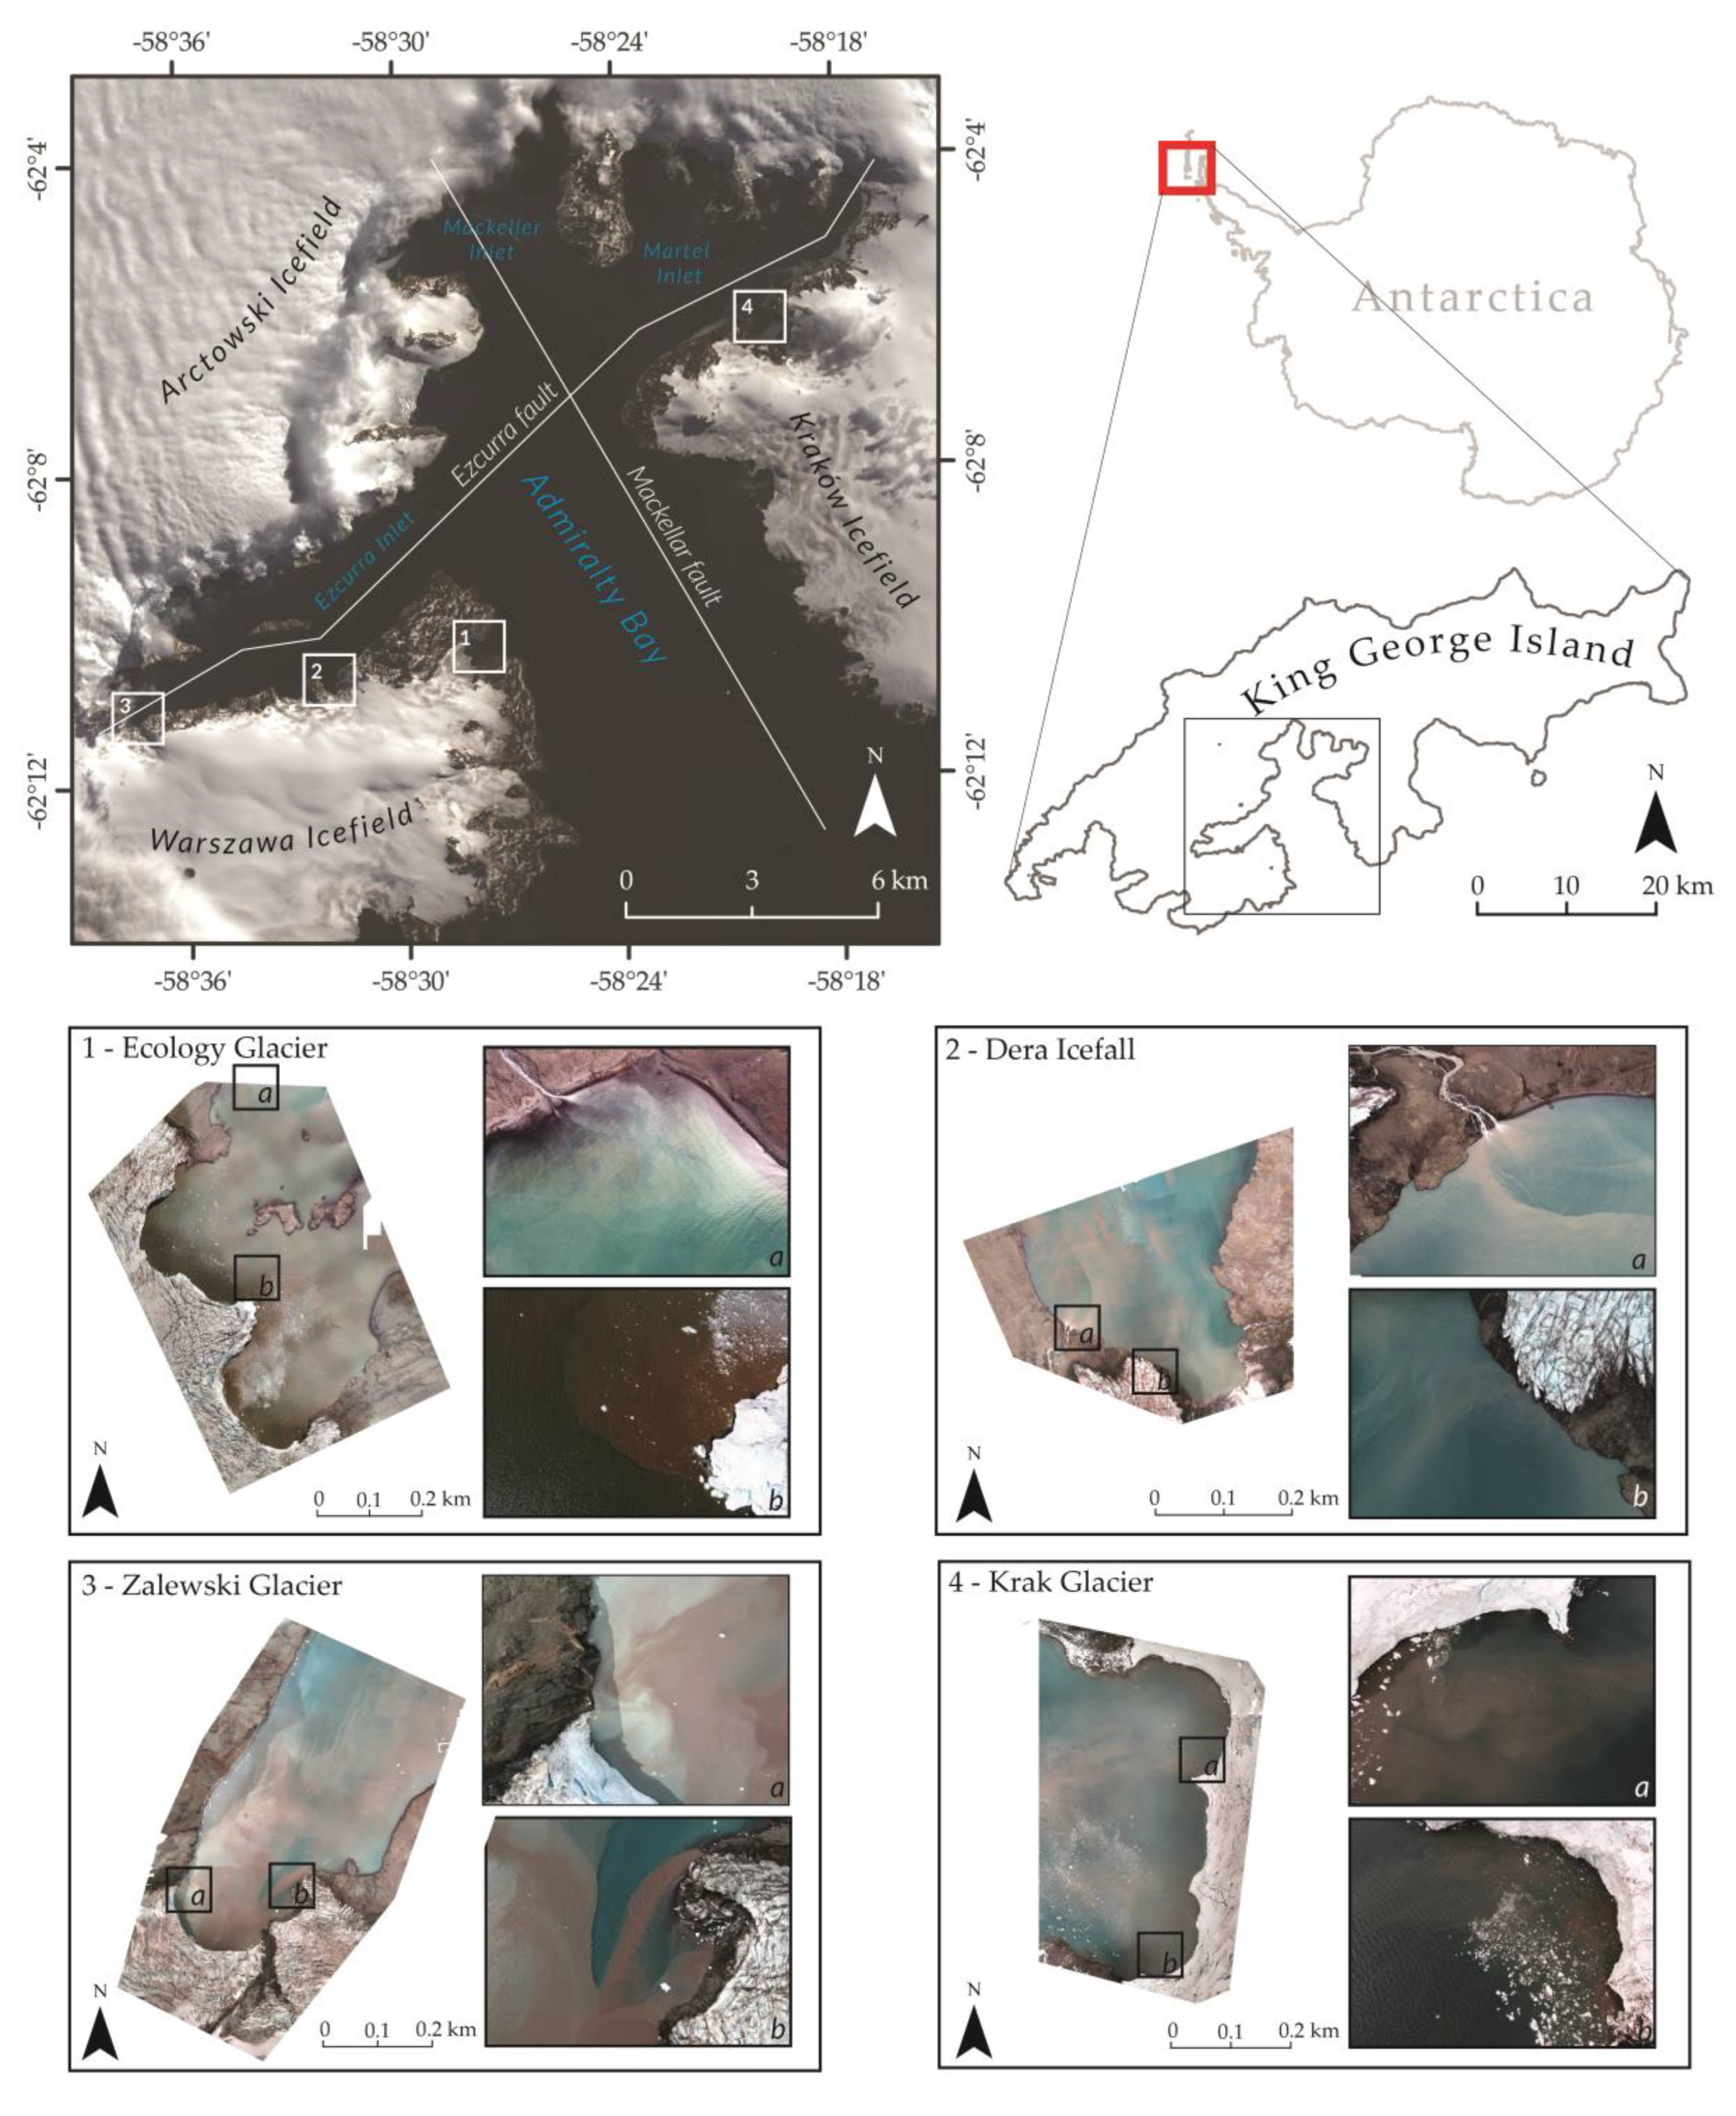
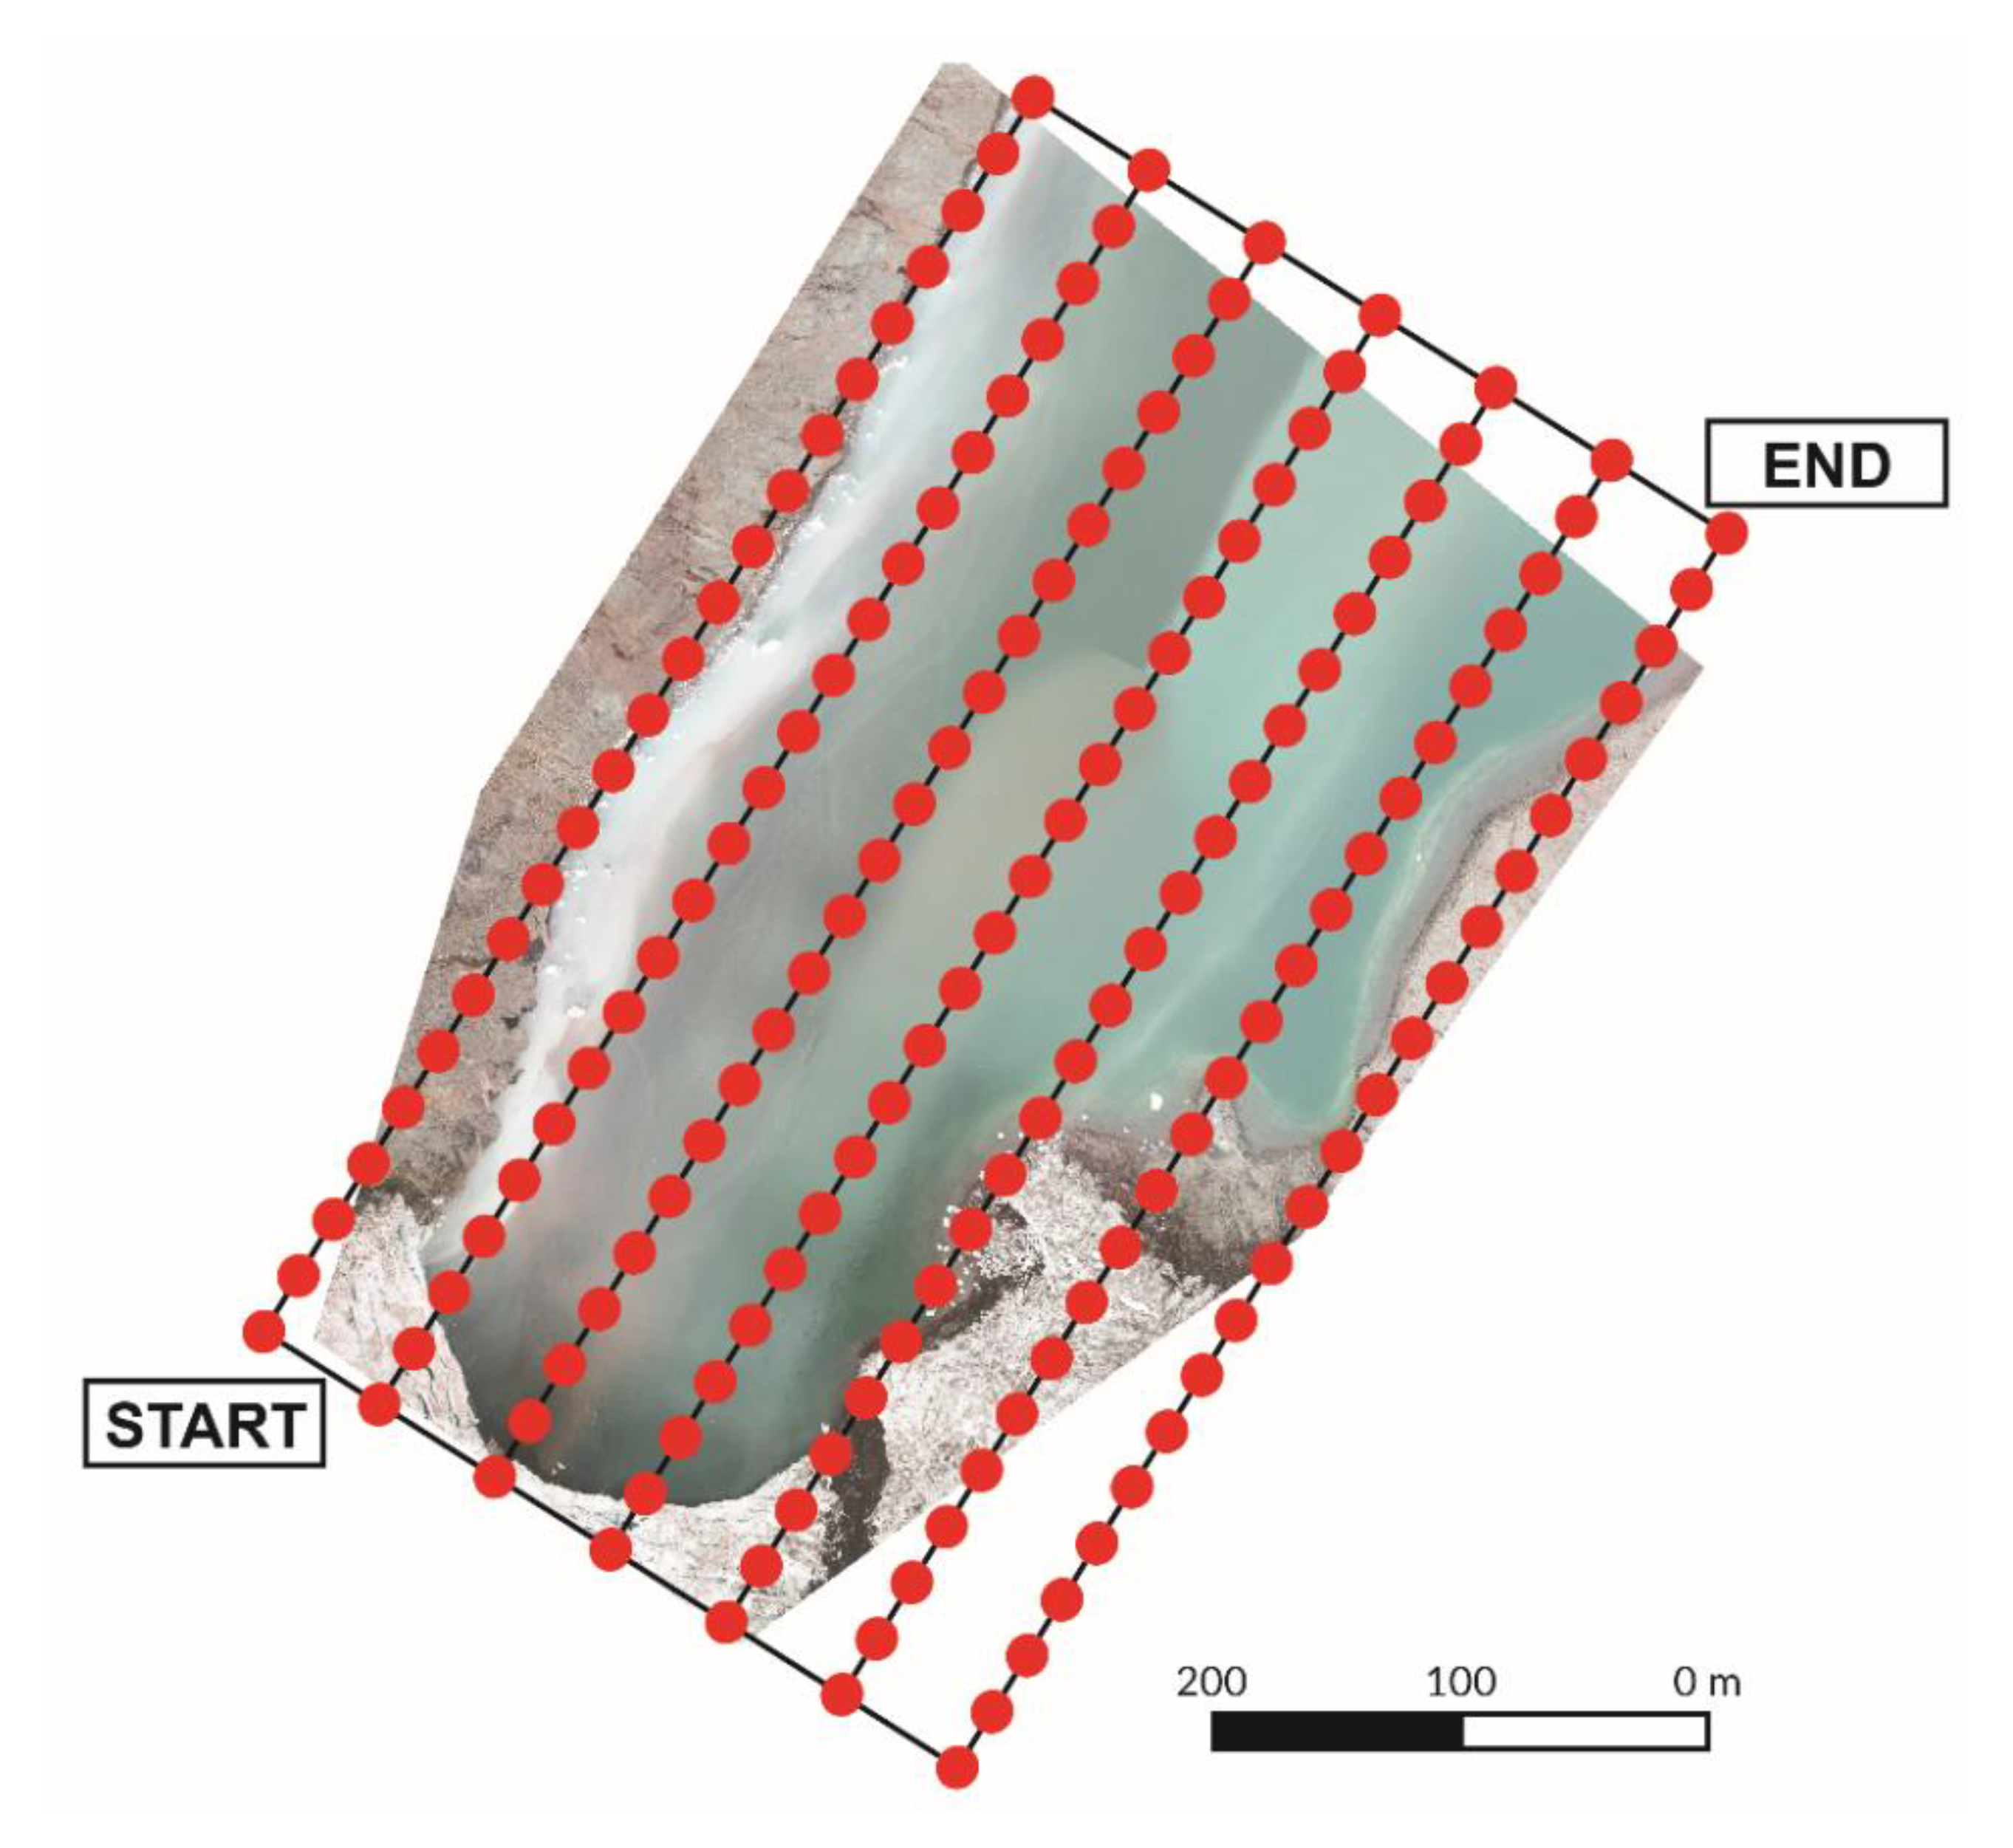
Consequently, the objective of this study is to assess the possibility of using a multispectral sensor, such as Parrot Sequoia+, supported by a Zenmuse X5 camera for (1) identifying glacial outflows and (2) estimating turbidity values of the sediment plumes based on UAV observations. These plumes areidentified by turbidity concentrations. To achieve these goals, during the 2019 austral summer in the Admiralty Bay in West Antarctica, recurrent plumes in front of four glaciers, which differ in shape, dynamics, and geological location, were investigated, and their plume waters were examined.
3. Results
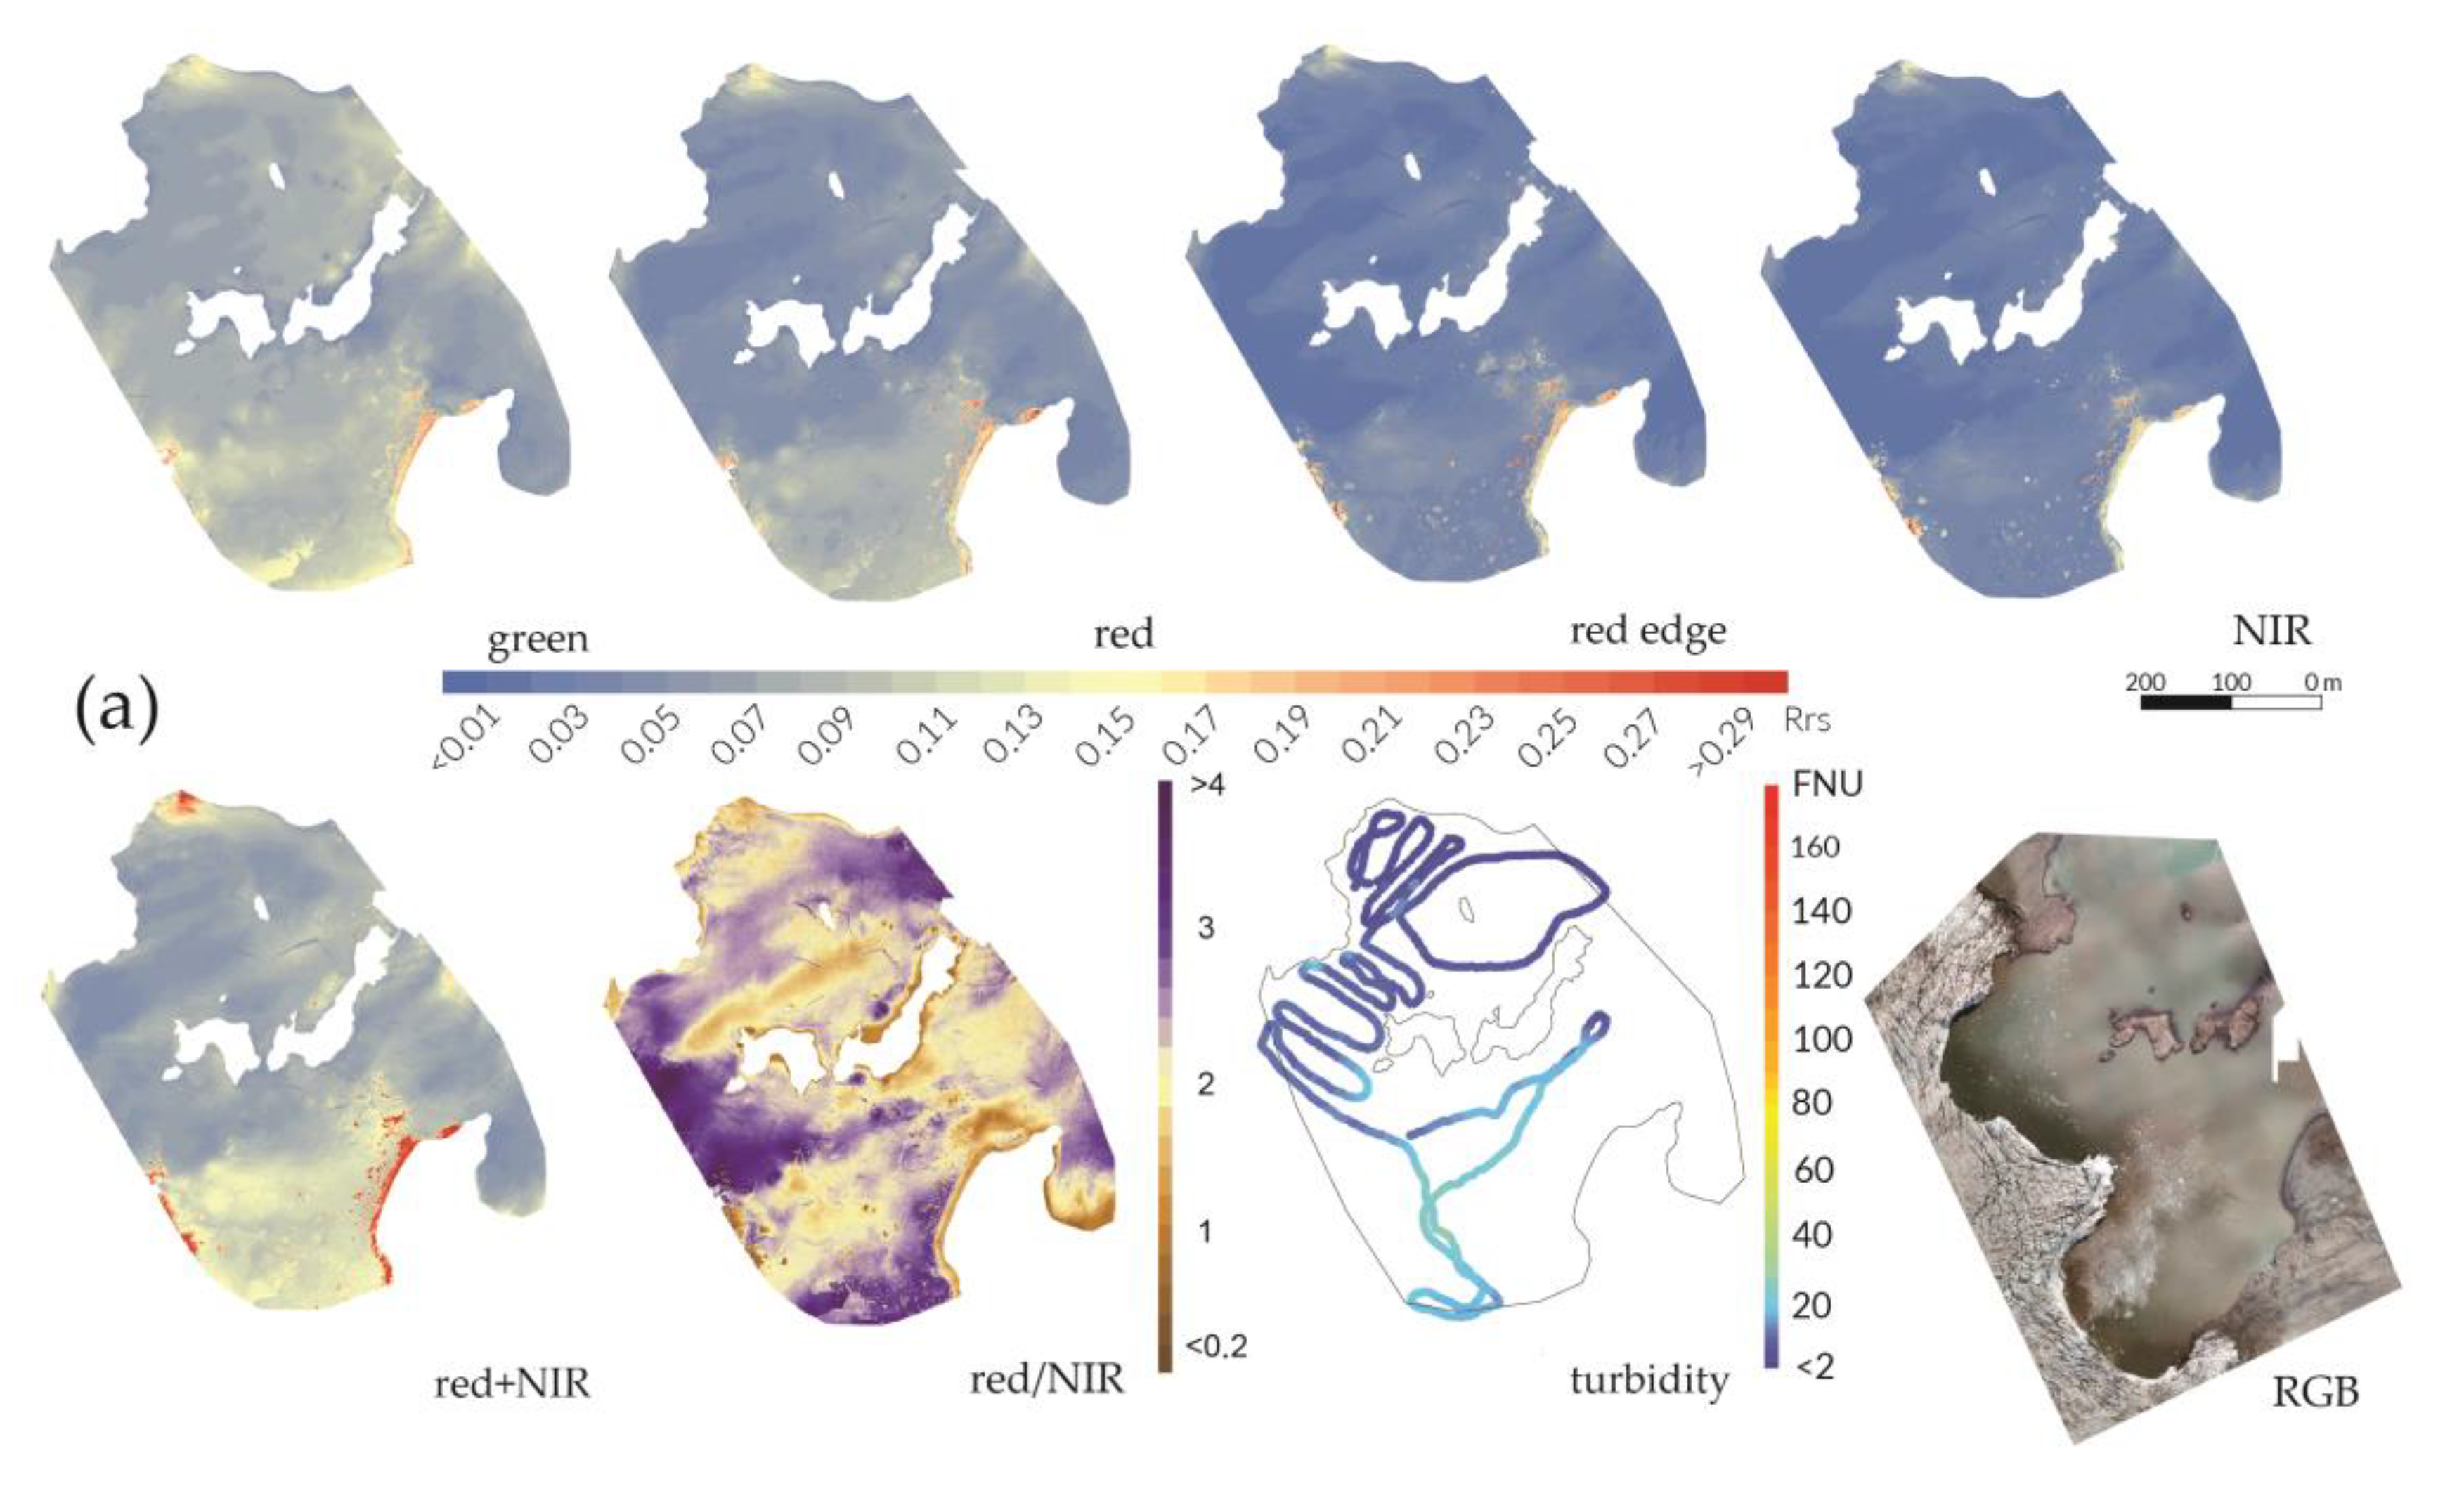
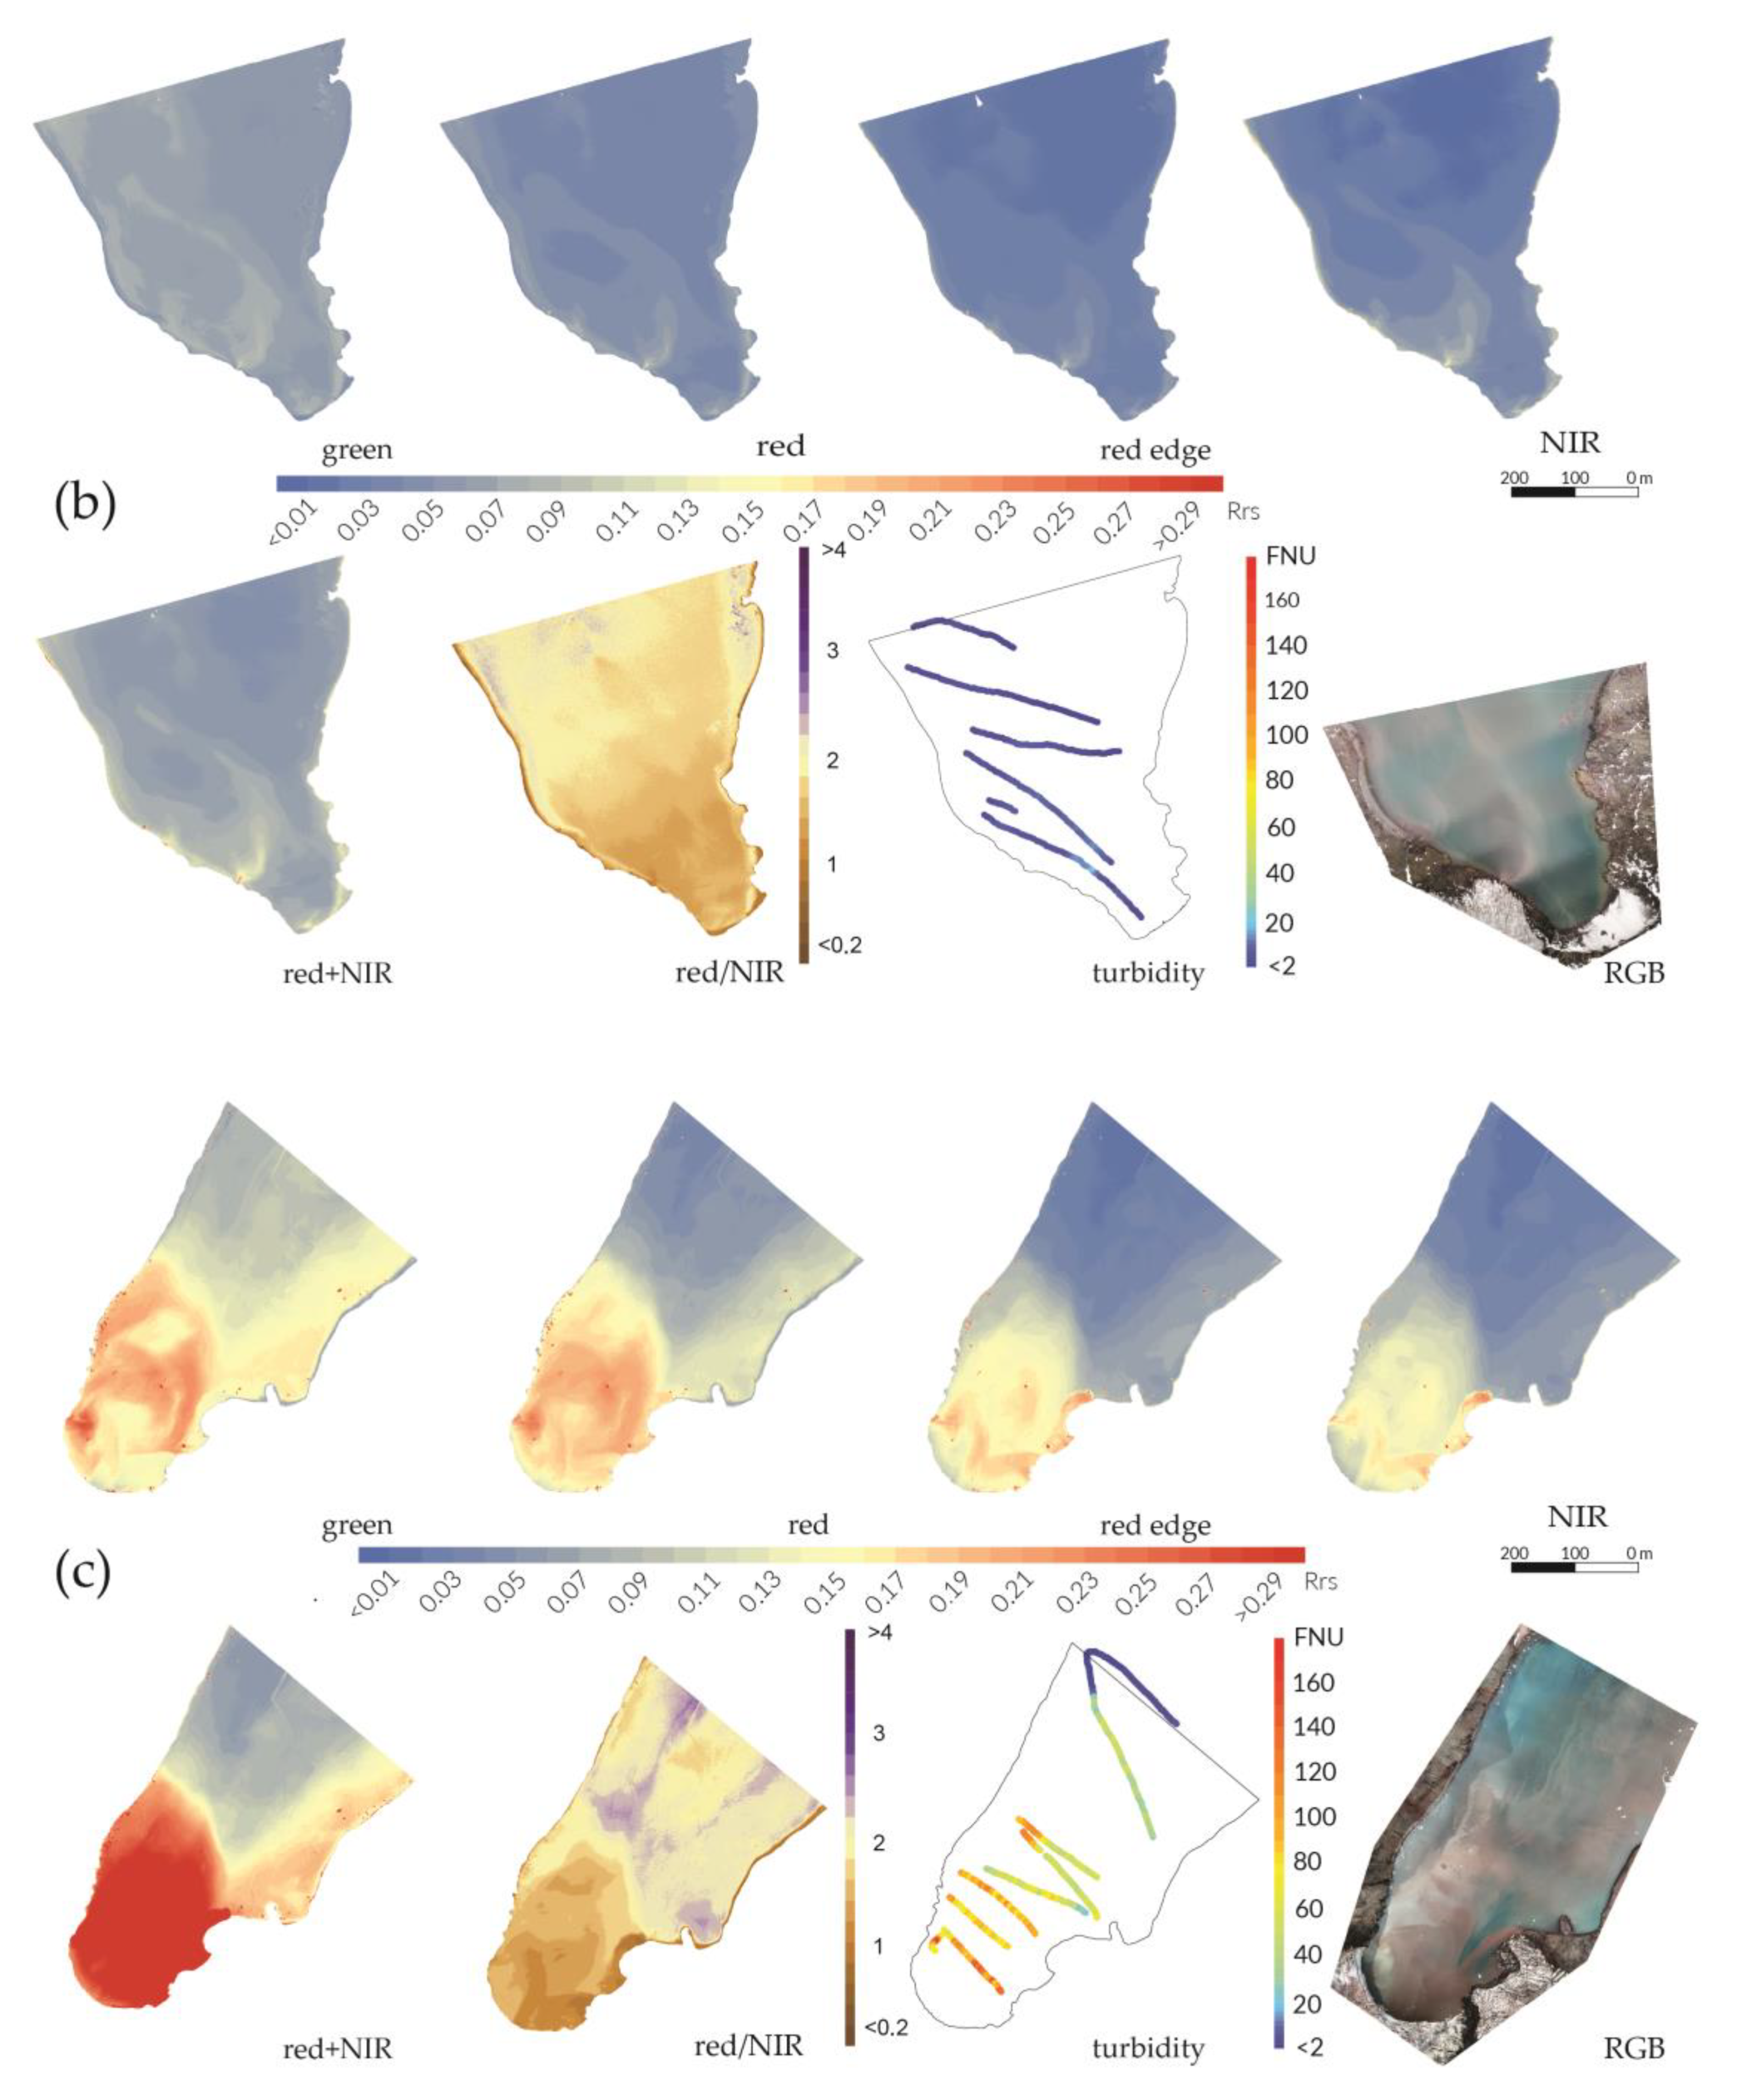
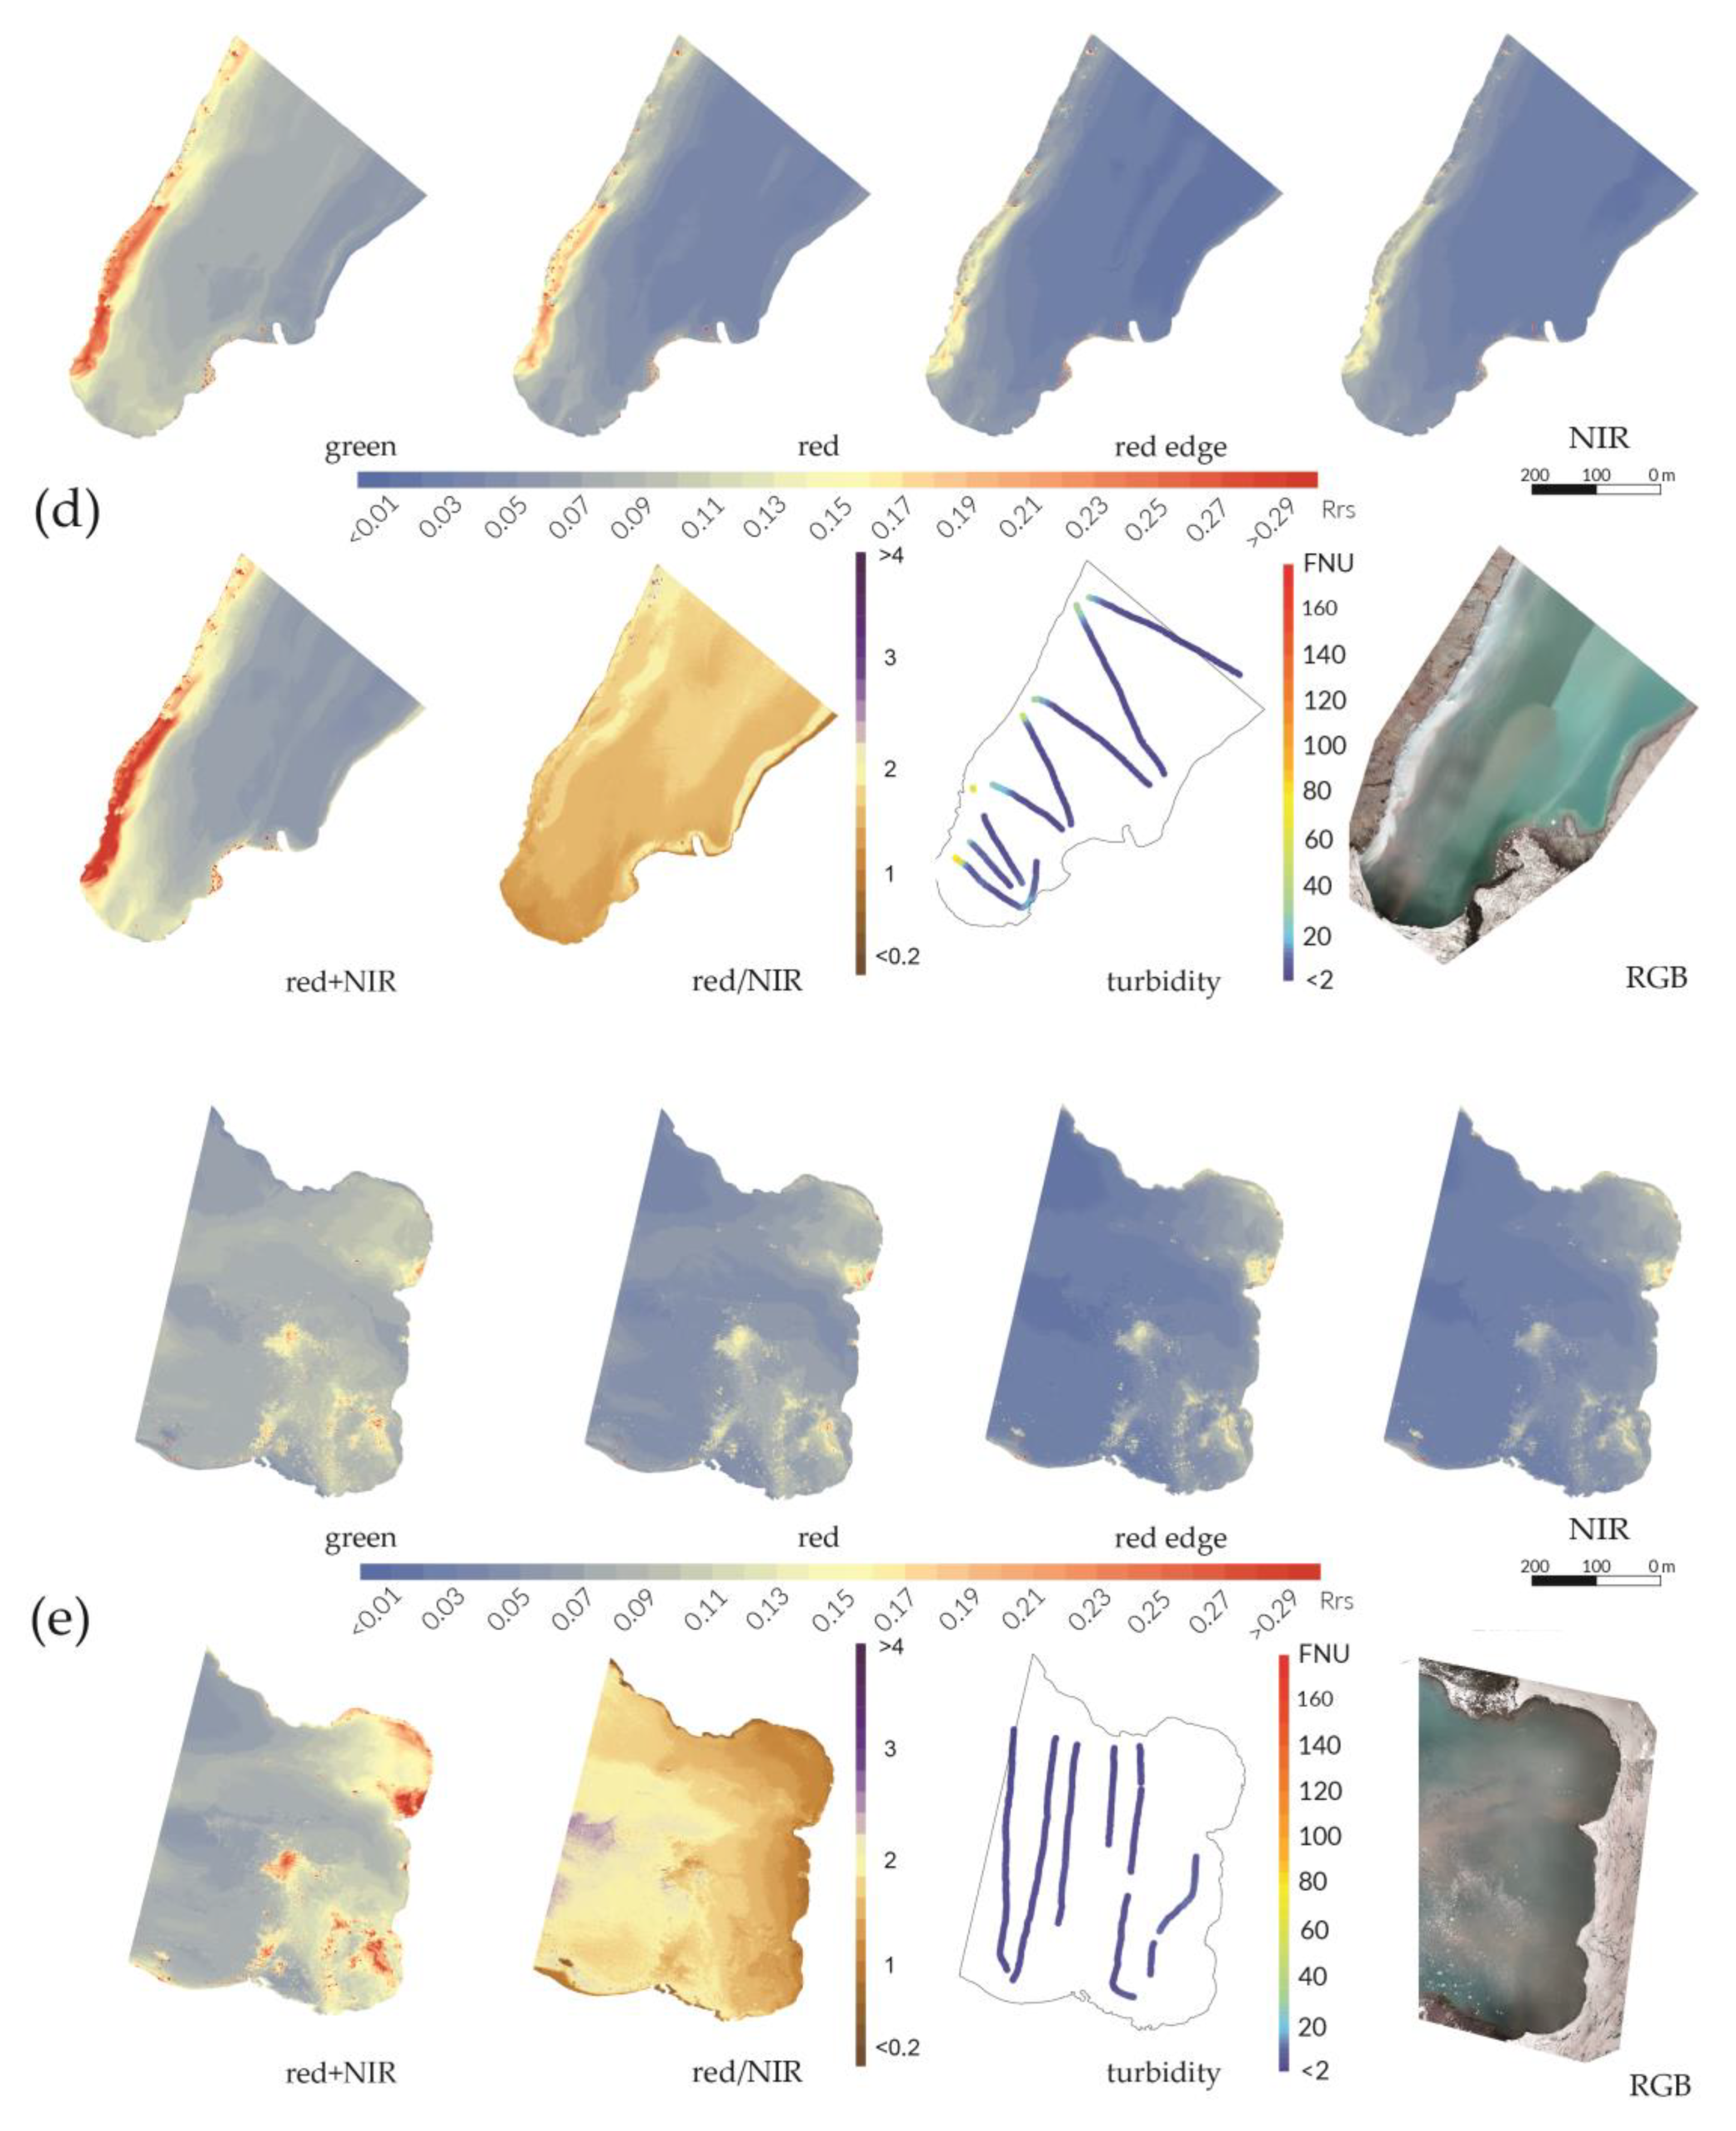
As apparent from the maps in
Figure 7, the water turbidity values, as well as the spectral reflectance registered by the Parrot Sequoia+ cameras, differ significantly between specific coves. Furthermore, the reflectance range, visibility, and plume shapes are notably dependent on the registered electromagnetic wavelength. In all five analysed cases, the highest reflectivity was recorded in the green electromagnetic spectrum. The reflectance in this band was larger than 10%, with water turbidity values <10 FNU. A disproportionately high reflectance was noted at a distance of 500 m from the glacier terminus, and, in some cases, it covered 80% of the cove’s water surface (
Figure 7b,d).
Reflectance in the red spectral band is most effective for lower turbidity (<70 FNU) and is less susceptible to values greater than 140 FNU. Nonetheless, the shapes of the plumes visible in this band most closely imitate the outflows depicted by the Zenmuse X5 camera (
Figure 7c). In the RE and NIR spectral regions, high-turbidity waters are most effectively visualized with a value larger than 60 FNU, but these ranges are not responsive to low-turbidity waters. Increased turbidity, which was caused by water discharge at the glacier front [
52], is visible in the red spectral band (
Figure 7b). In occurrences of high-turbidity water outflows, the distinction can also be made with longer wavelengths rather than visible spectral bands (
Figure 7d).
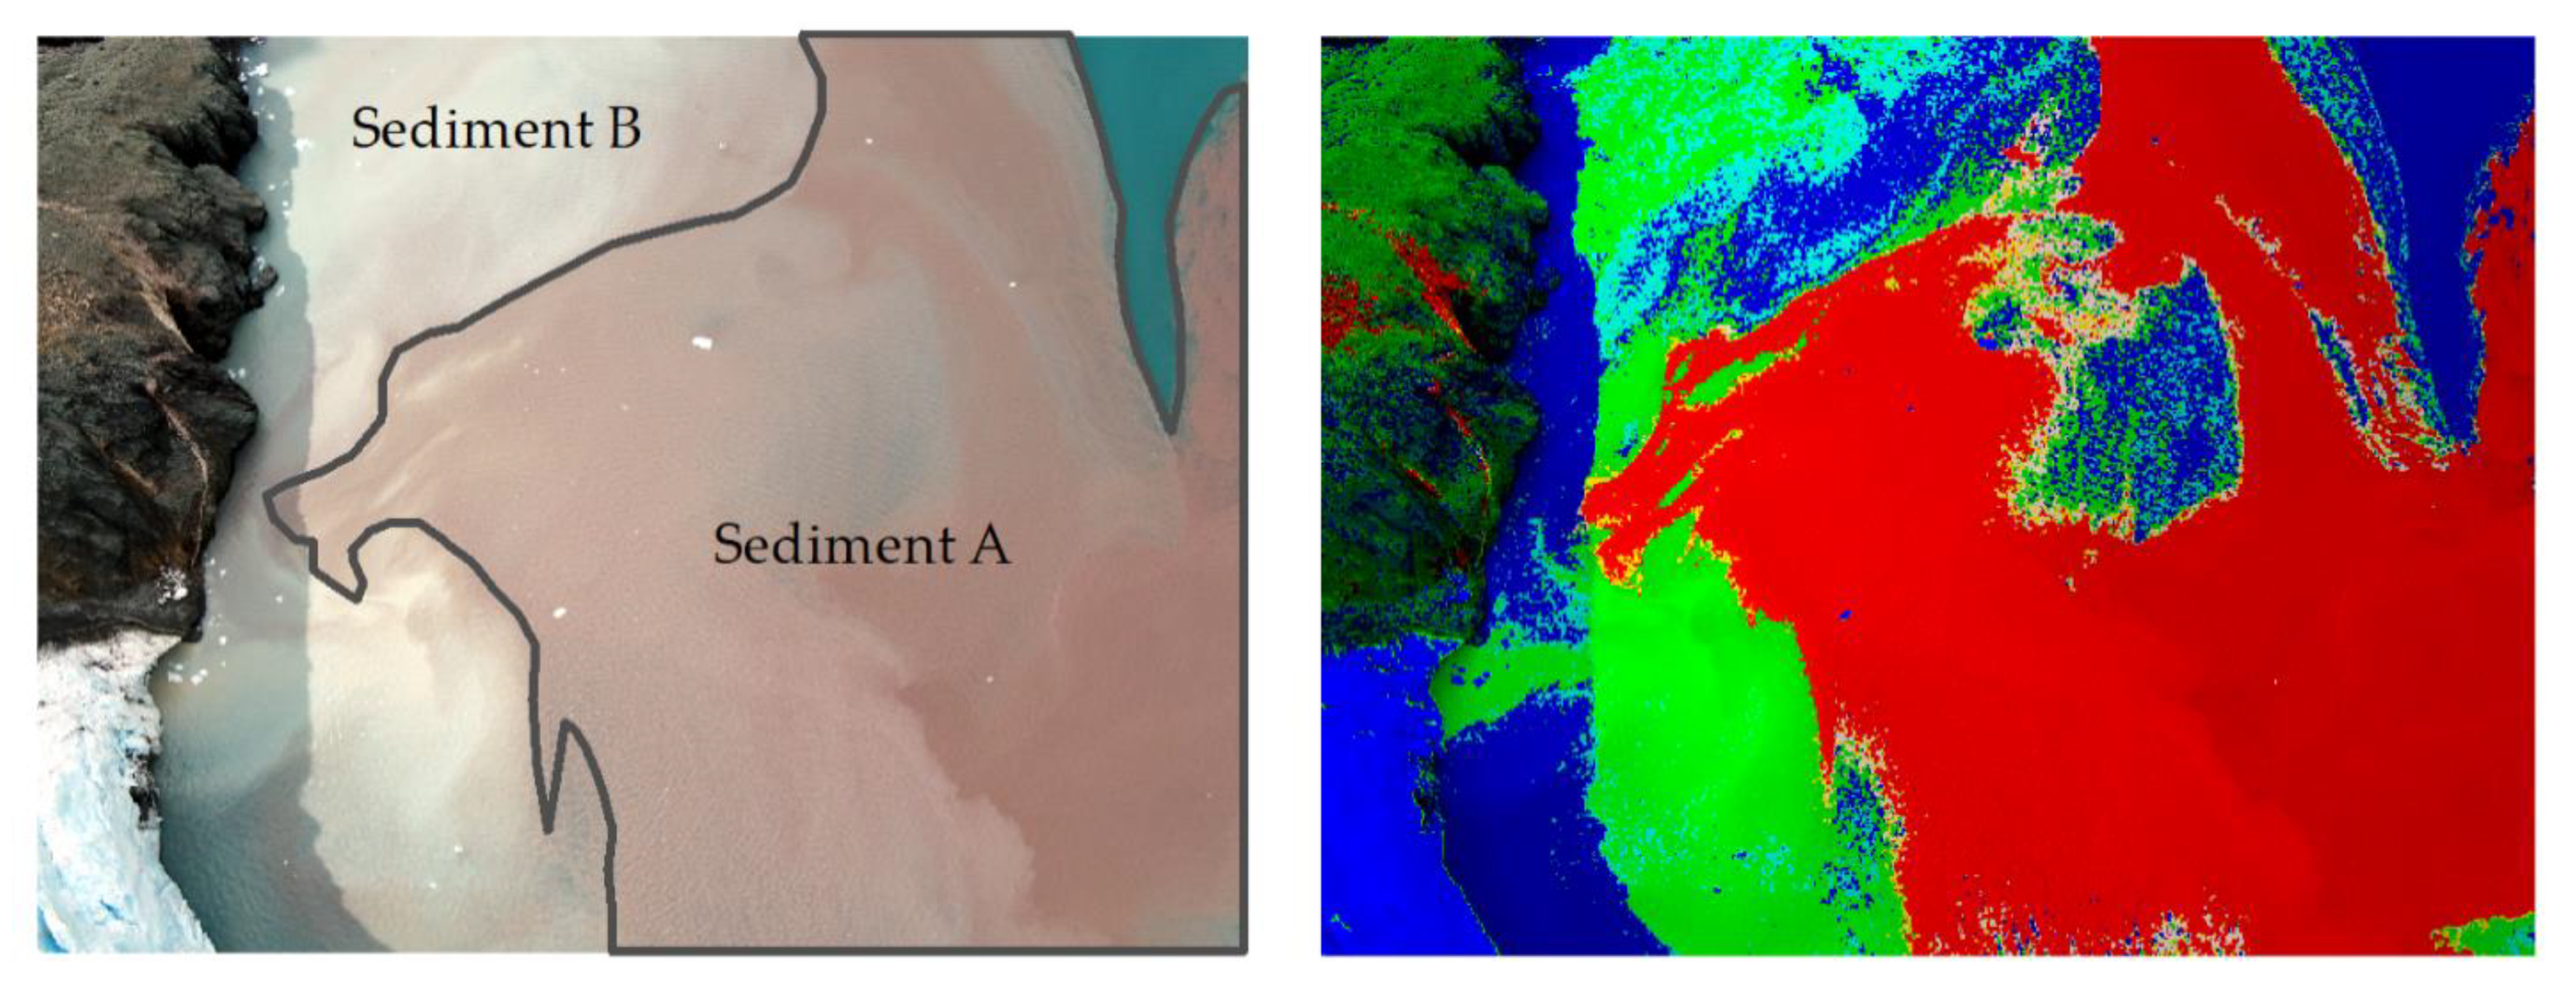
Due to contrasting spectral reflectance maps with orthophotomaps in the natural RGB colour model registered through the Zenmuse X5 camera, it was possible to identify subglacial discharges with a natural sediment colour, depending on the geology of the bedrock. In the area with four coves, two types of sediment were detected: predominantly sediment A with red pigmentation and, to a lesser extent, sediment B with white pigmentation. In the green spectral band, sediment B reflects more intensely than sediment A (
Figure 7c). The reflectance ranges of the red spectral band for sediment A and sediment B are proportionate. Yet the NIR and RE spectral region rates are more driven by sediment B (
Figure 7c).
The occurrence of glacier ice (i.e., mélange, growlers, and ice packs) on the cove water surfaces is frequent (
Figure 7a,e). The green spectral band is the most susceptible to ice (Ecology Glacier and Krak Glacier), which has a disproportionately high reflectivity. Contradictory results are found in the NIR spectral band, where ice is characterized by only a high reflectance, and fine surface plumes are indistinguishable. High reflectance values in the red spectral band lead to the identification of ice. Moreover, in this spectral region, ice does not interfere with the identification of subglacial discharges (i.e., there is no increase in the reflectance coefficient values as in the green spectral band, nor is there a decrease, as in the NIR spectral band).
The combination of red+NIR bands and the relation between red/NIR was also examined. The sum of the reflectance of these channels provides a sharpened image of high-turbidity waters (>70 FNU) (
Figure 7c) and information on the occurrences of ice packs and growlers (
Figure 7a). Using this combination method, the presence of a mélange phenomenon may lead to an incorrect analysis because of its negative impact on plume creation (
Figure 7e). The image obtained by calculating the red/NIR relation presents a contrast between high-turbidity waters (>70 FNU) and lower turbidity waters. Red sediment discharge (sediment A) is more visible than white sediment discharge (sediment B) (
Figure 7c). Additionally, ice occurrences become unidentifiable using this formula (
Figure 7e). However, overlap** both the red+NIR and red/NIR images helps indicate areas with increased glacial sediment, which, simultaneously, allows for the identification of ice packs, growlers, and mélange.
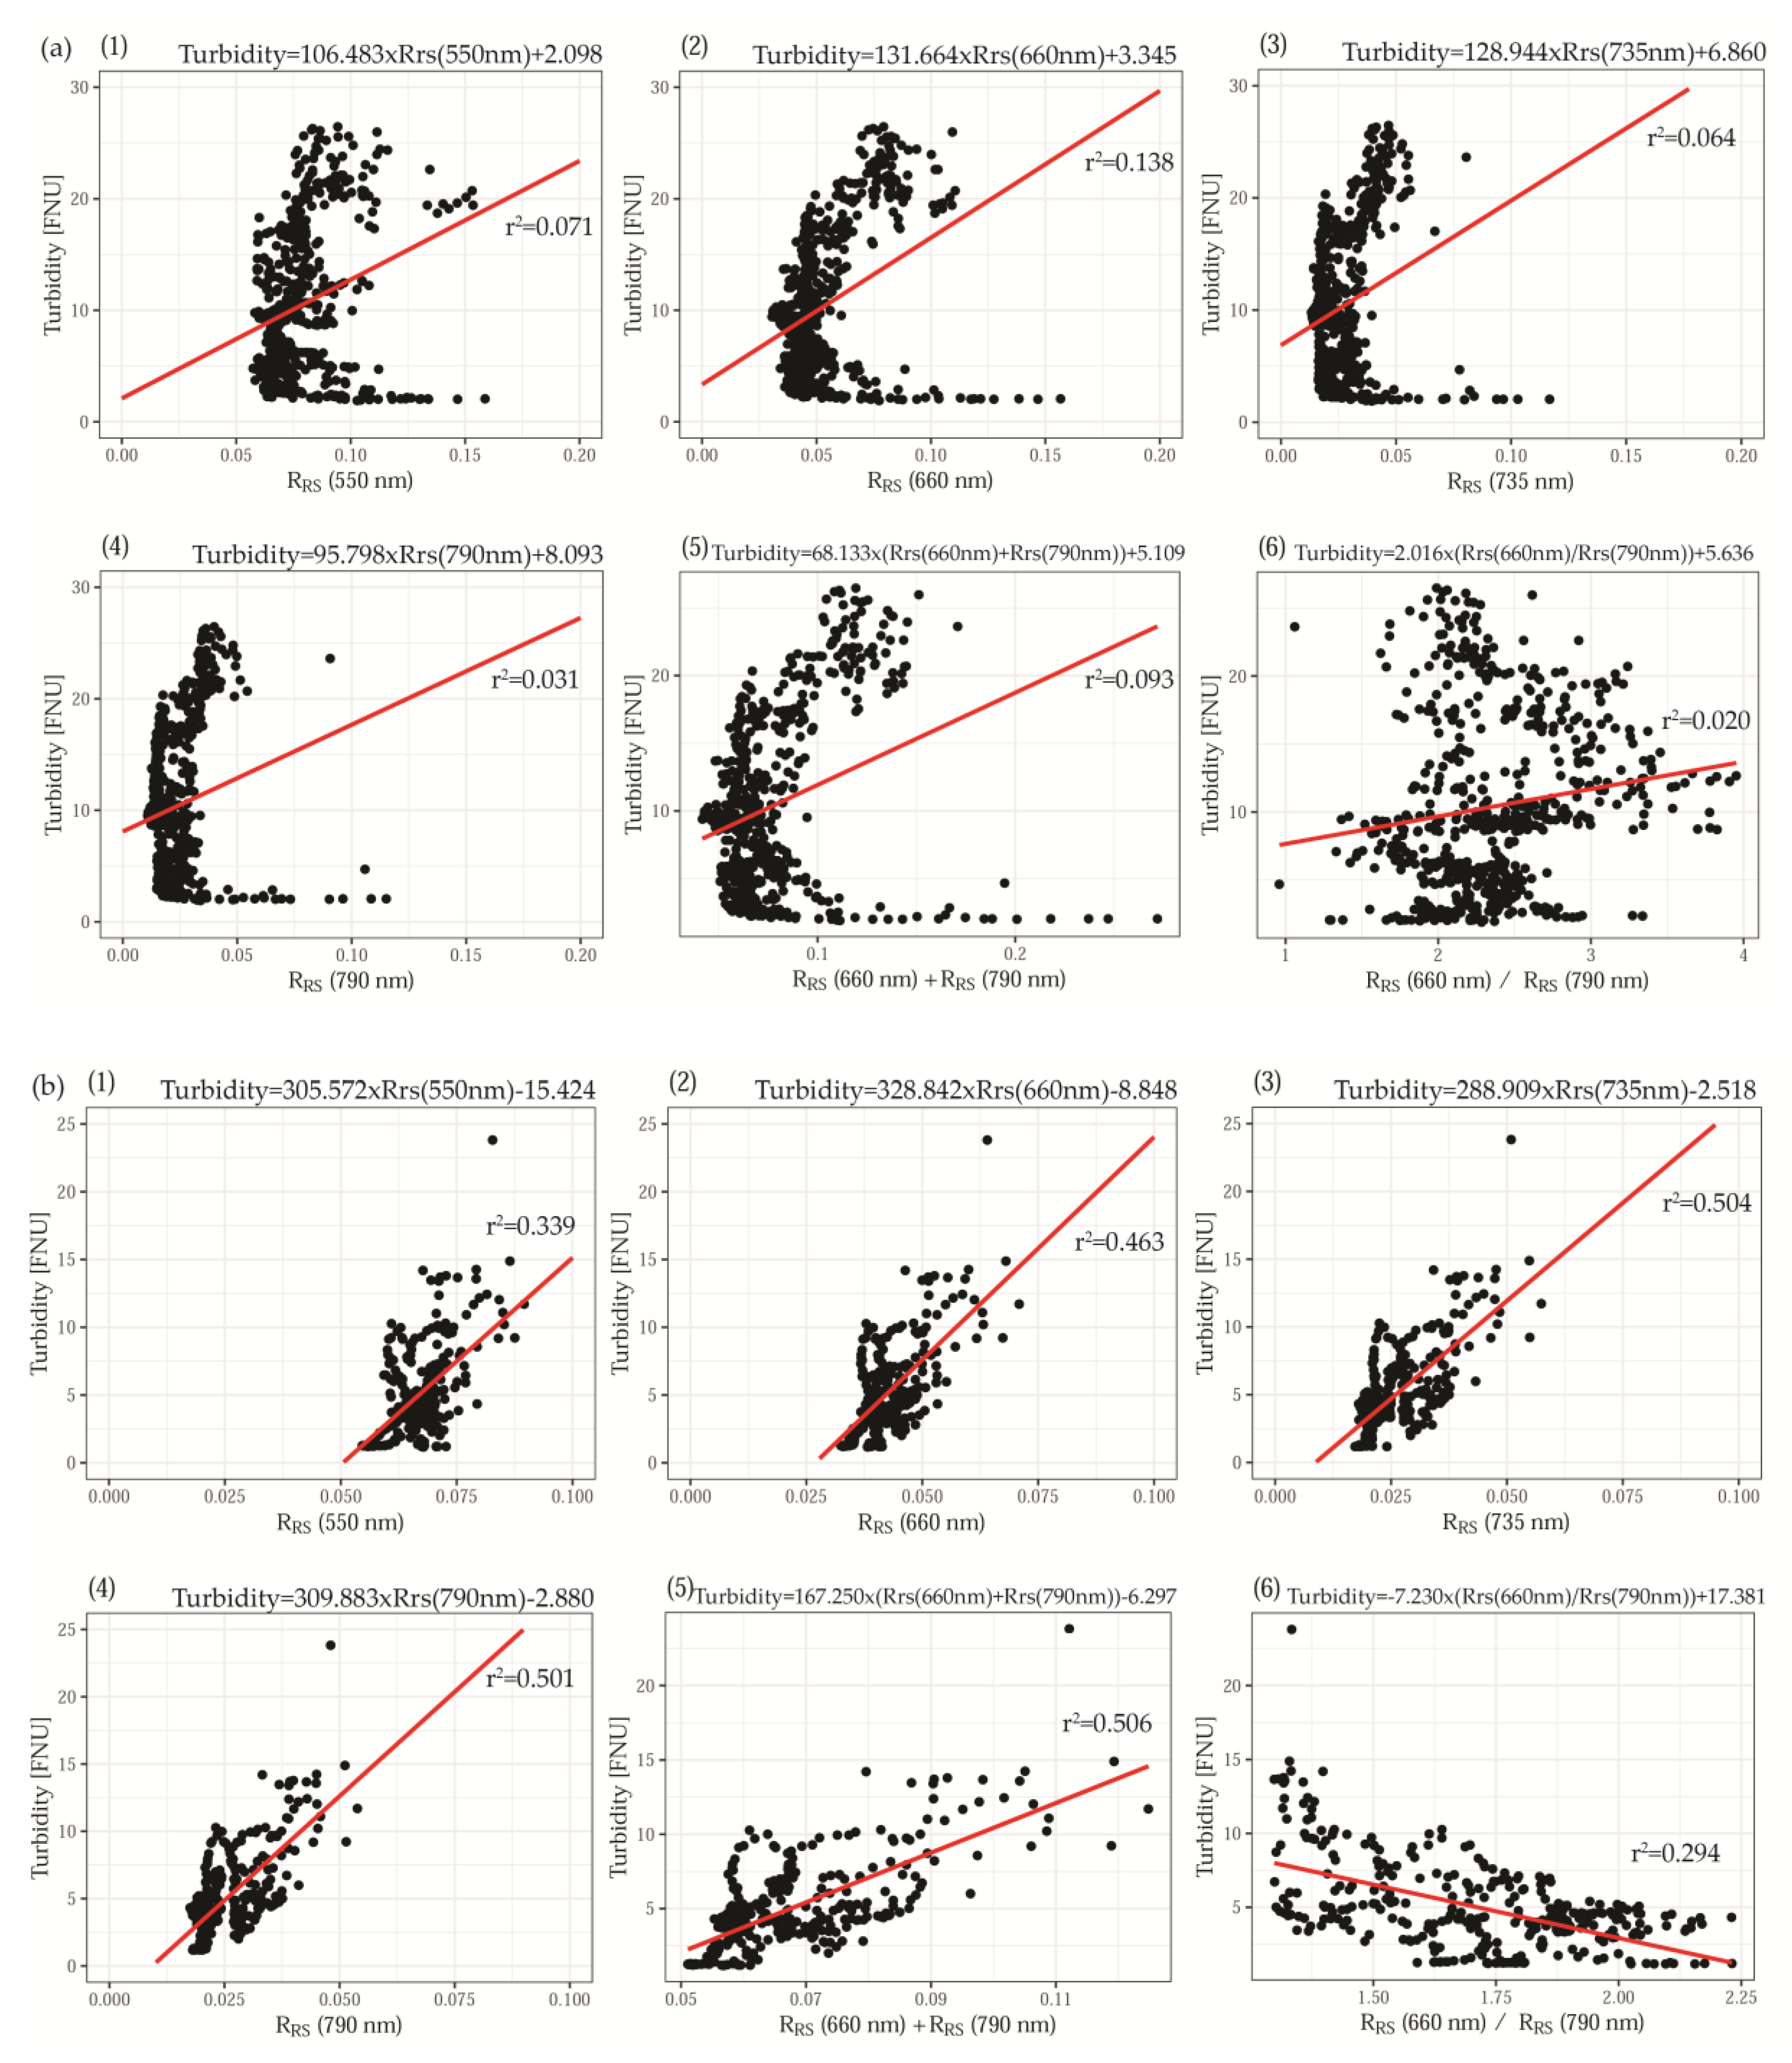
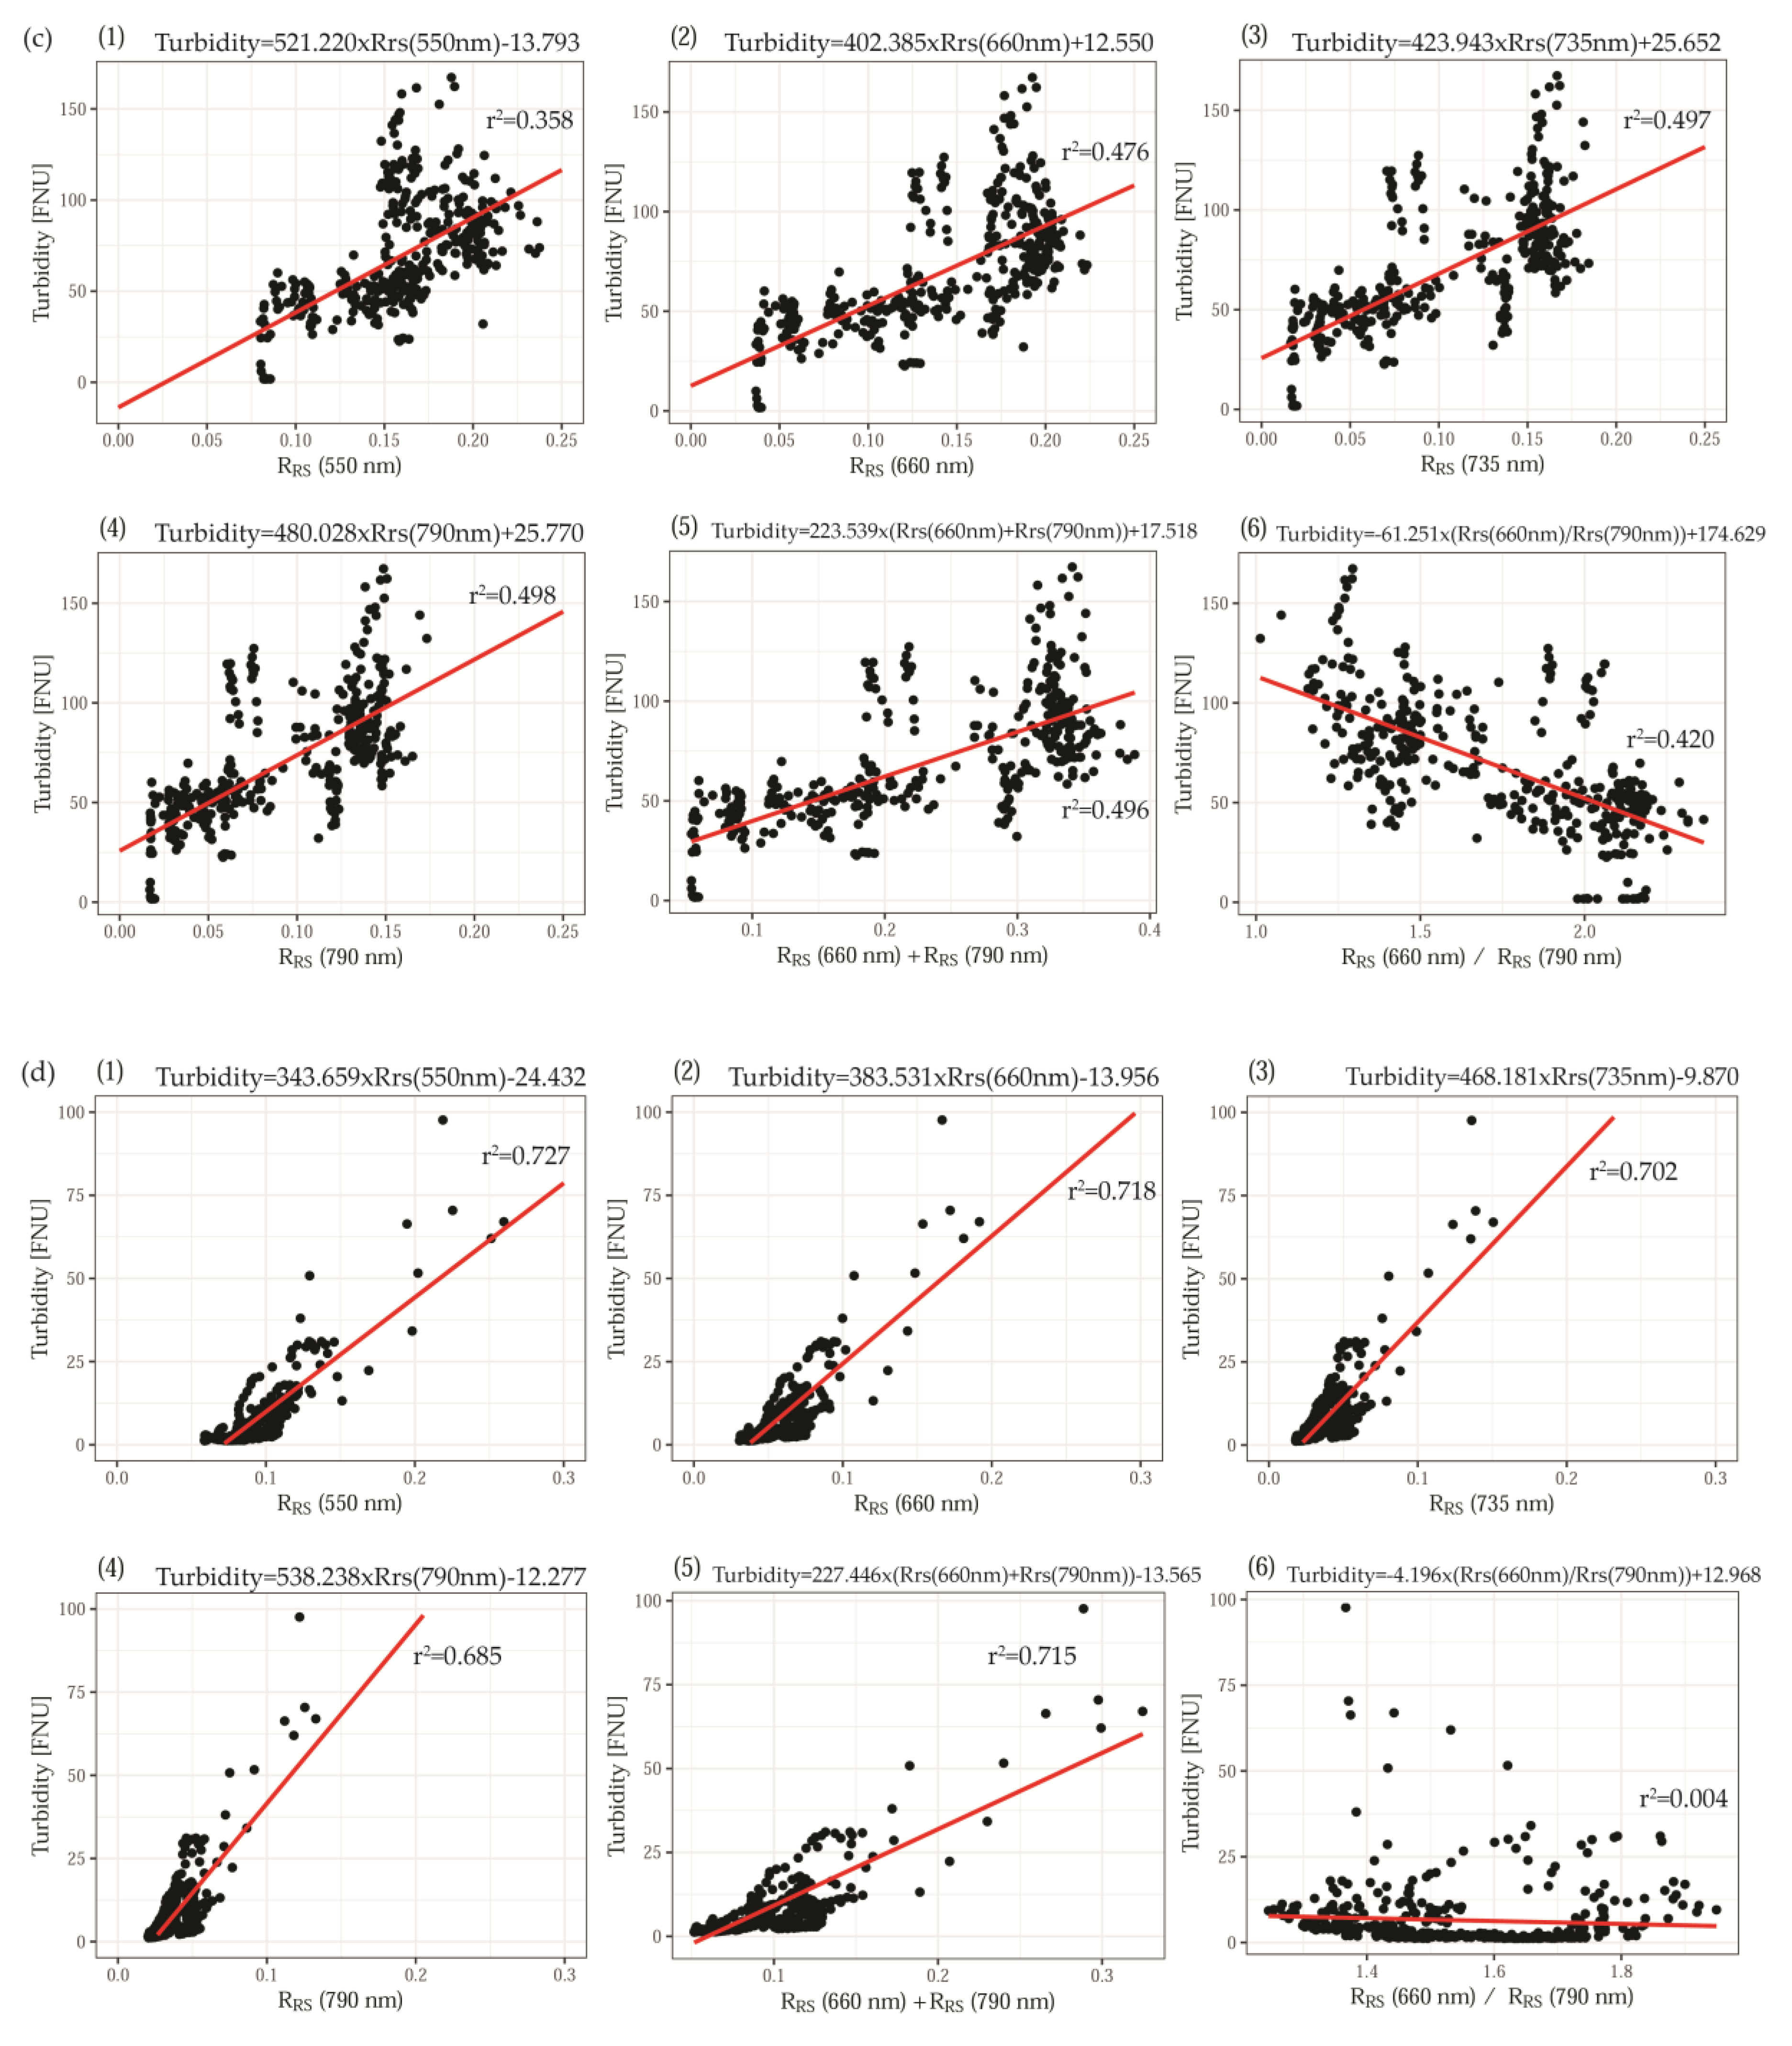
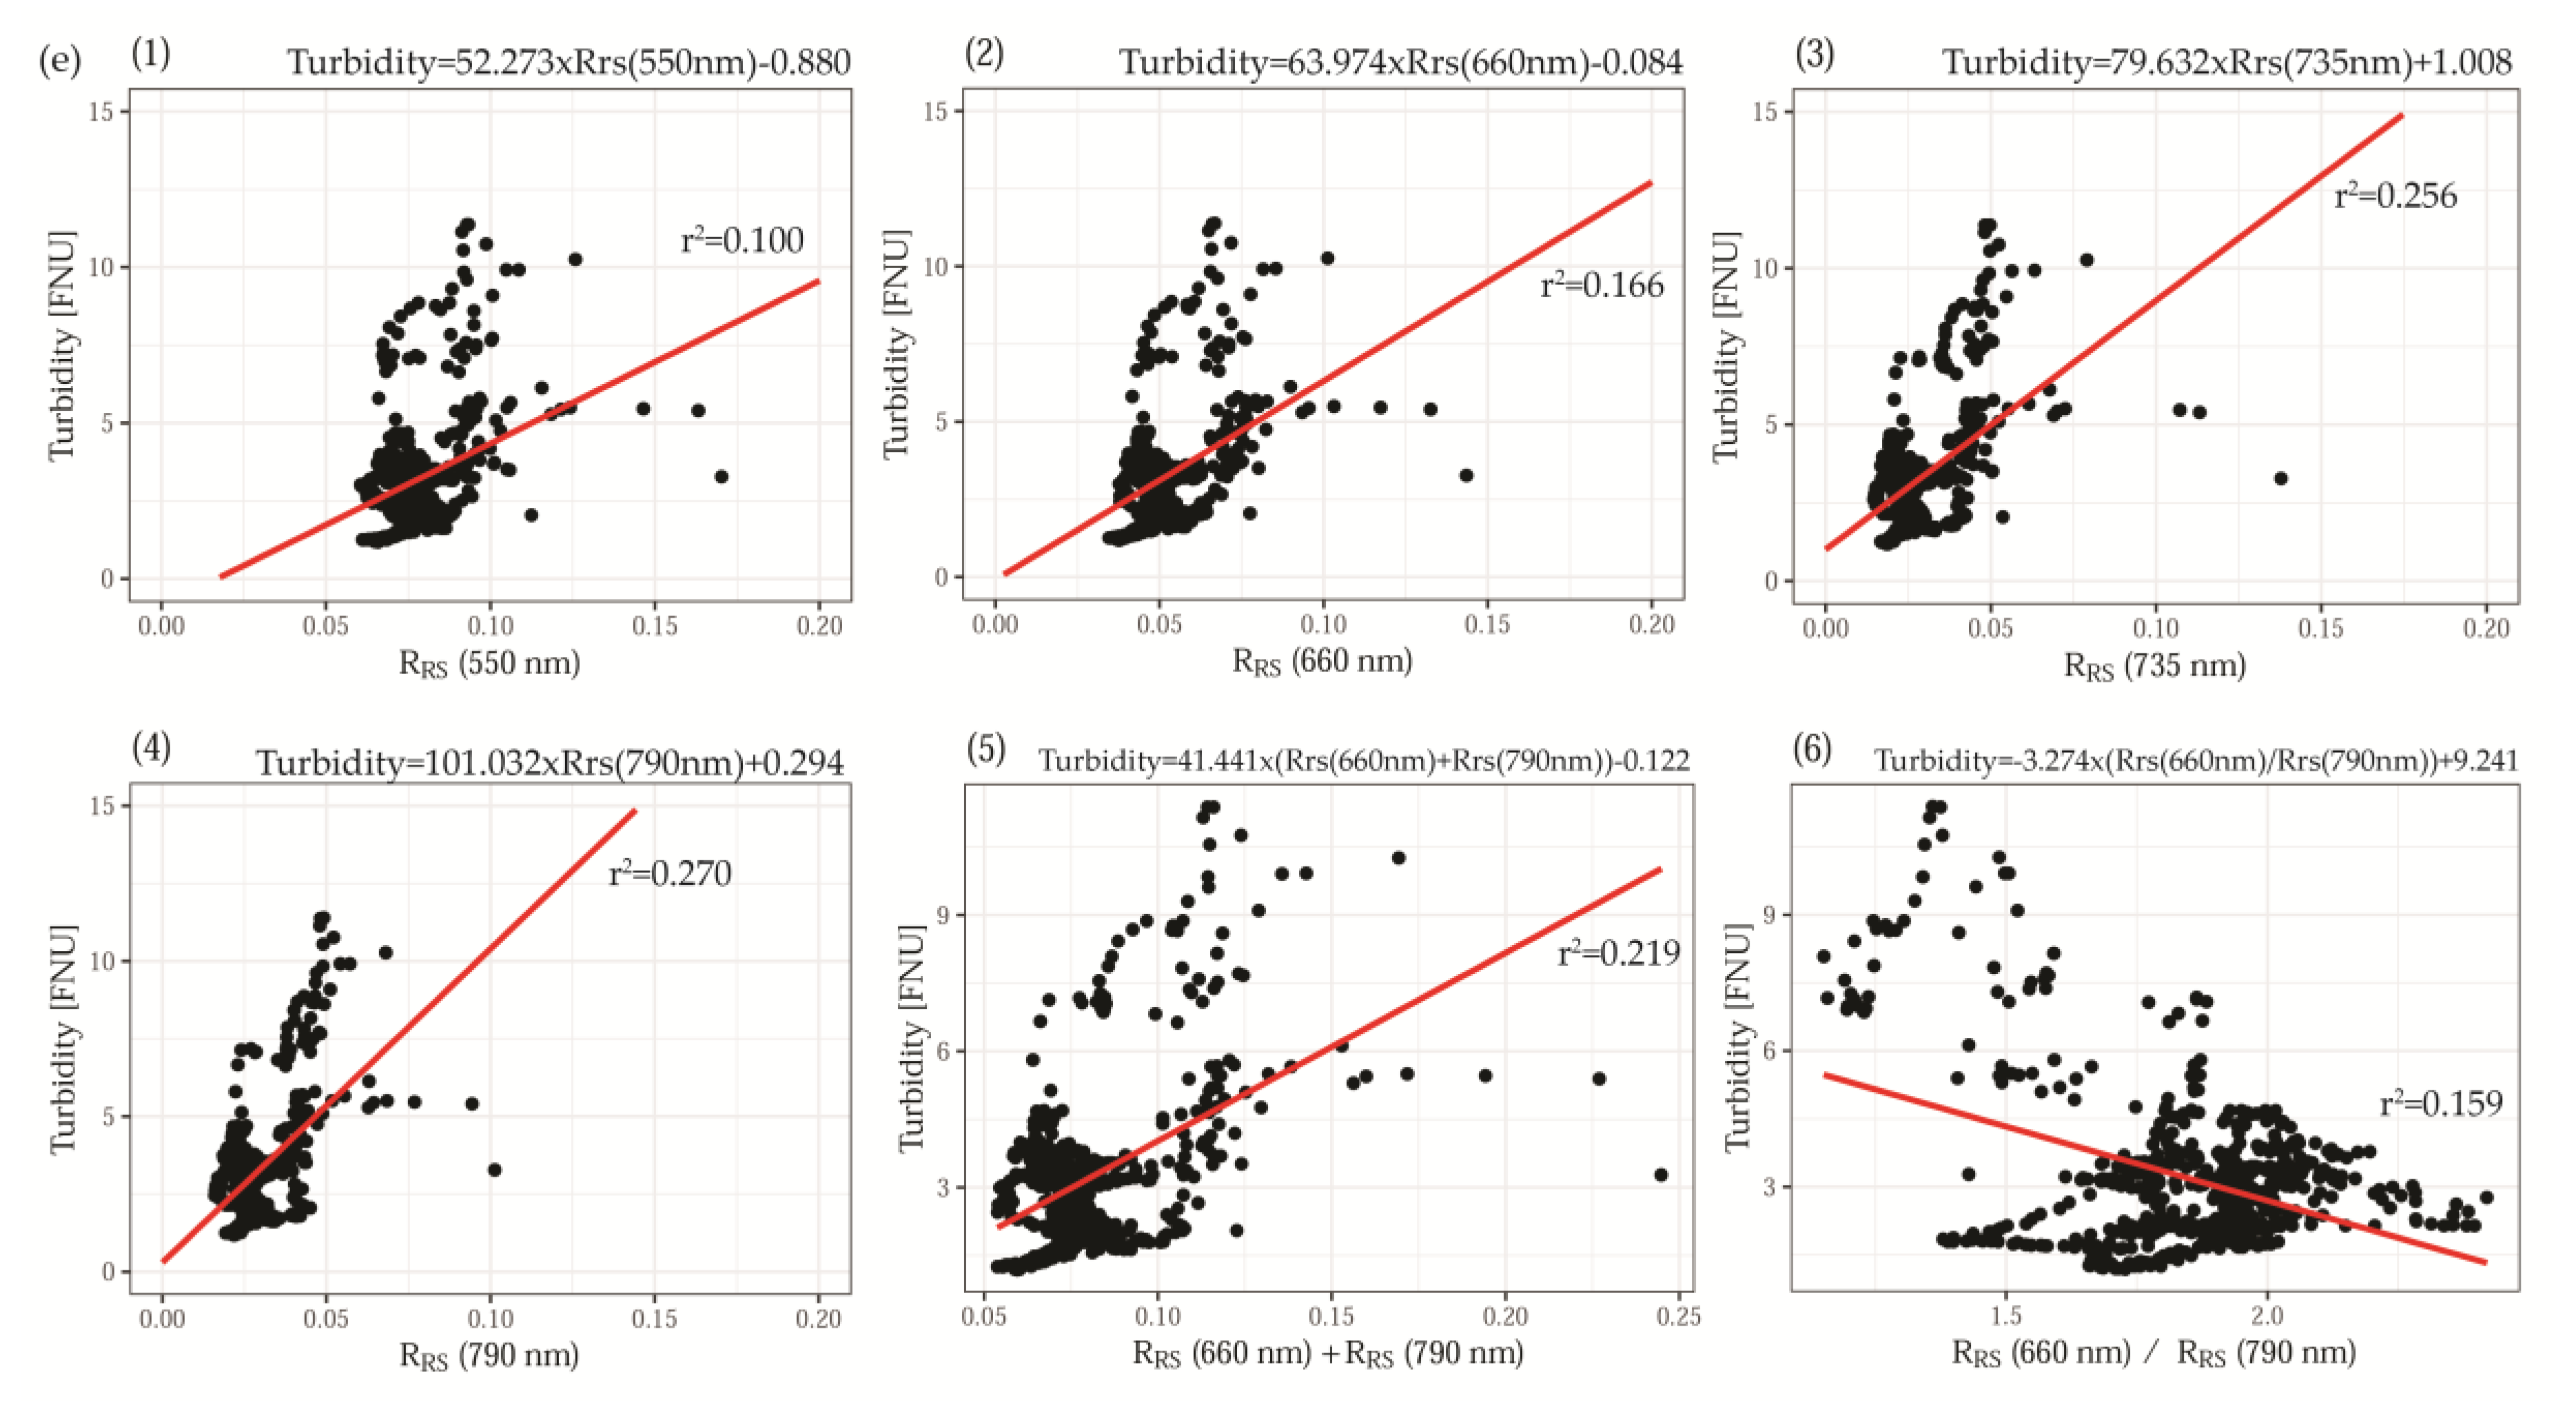
Previous works have shown that the turbidity and spectral response can be linear, log-linear, exponential, or logarithmic. Lower SSCs cause a linear increase in the turbidity. If the amount of particle matter increases, a non-linear increase in the turbidity is observed [
53]. The sensitivity of a single band is decreased with increasing turbidity and becomes less linear [
32].
Due to moderate FNU values measured in the research areas, a linear relationship and correlation between the registered
in situ turbidity and the mean reflectance values of each band from the 1-m-radius buffer area was used (
Figure 8,
Table 4). A good relationship was found between the turbidity and reflectance in the red (r
2 > 0.45), RE (r
2 > 0.5), and NIR (r
2 > 0.5) spectral bands within coves without mélange and where the turbidity oscillated by 100 FNU (
Figure 8b–d,
Table 4). The colour of the sediment also had an impact on the relation between the light reflectance and water turbidity, and the highest r
2 (>0.7) was noted in areas of subglacial discharges with uniform colouring (
Figure 8d). A distinct event was observed near Zalewski Glacier, where two types of sediment were separately discharged. Consequently, the range of the Rrs for equivalent FNU values was mostly dispersed. The lowest r
2 (<0.3) was noted within the coves with ice phenomena, particularly mélange and ice packs. The r
2 value for red+NIR was similar to those noted for single bands. The relationship between the FNU values and the ratio between the red and NIR spectral bands is varied and depends on ice phenomena and sediment type. The r
2 value hovered between 0.004 and 0.420 and is characterized by a high level of uncertainty.
4. Discussion
Our research showed the usefulness of multispectral imagery using a UAV for map** turbidity plumes in Antarctica. With the use of Parrot Bluegrass, images (14 cm) with a pixel range that is 70 times higher than that of Sentinel-2 satellite imagery (10 m) were obtained, which allowed observations of microscale phenomena. Gathering similar resolution imagery from commercial sensors (e.g., WorldView and Pleiades) may generate considerable costs and would be unprofitable. The utilization of drones allowed a more flexible measurement schedule, which is an advantage over satellite information, which is acquired at fixed intervals. An additional benefit of using UAV is its flight altitude, which is low enough to largely eliminate atmospheric impacts. This benefit is especially important with multispectral sensors, for which 90%–99% of cases register signals from atmospheric molecules and aerosols, which requires atmospheric correction tools in satellite imagery [
54].
In the present work, the focus on identifying glacial outflows establishes the best reflectance band to retrieve shapes and types (colours) of sediment plumes and fit the best linear relationship between the turbidity and reflectance. Using high-frequency images produced by a Zenmuse X5 camera identified glacial discharges with sediment colour distinction, and images from the Parrot Sequoia+ sensor produced data on the reflectance of turbid waters.
Due to the use of the maximum RGB algorithm, two types of sediment were distinguished in the RGB images. Sediment A has a predominance of red, and sediment B contains green and blue. Through overlap** multispectral images with the RGB photograph and comparing the shapes of different plumes, it was shown that the reflectance range of particular wavelength bands for sediment A and sediment B differ. The analysis of the shapes of plumes allowed us to state that the red band correlates best with low-turbidity and medium-turbidity waters (<70 FNU) [
48], which is in accordance with previous research carried out in other parts of the world [
32,
36,
55,
56]. However, when the water turbidity exceeds 70 FNU, it correlates most strongly with longer wavelengths, as was noticed by Yafei [
57]. Unfortunately, in instances of cove waters covered with ice, an analysis is not possible due to immense light reflection, especially in the green spectral band, which makes green wavelengths poor indicators for spectral analyses of water turbidity levels in polar regions. Based on the two most reliable spectra, two band formulas have been tested. Red+NIR and red/NIR maps have been created, which have the advantage of reducing noise influencing multispectral images of water [
58]. They also reduce the influence of the atmosphere and sun glints on the water surface [
59,
60]. Overlap** the images of both combinations allows the identification of low-turbidity and medium-turbidity areas and eliminates the influence of ice packs and mélange.
The best linear relationship (r
2 > 0.7) between the turbidity and reflectance was found in the case of no ice phenomena on the water surface with homogeneous sediment-rich plumes and in high turbid waters (<70 FNU). The highest correlation coefficient values (>0.8) between the water turbidity and the Rrs were noted for the red, RE, and NIR wavelengths. The simultaneous occurrence of two types of sediment and lower turbidity caused an attenuation of the correlation between the two variables. Due to ice phenomena on the water surface, linear regression is inappropriate. These results are similar to data from previous research in the Arctic, where red light reflectance provided by satellite imagery was affected by the water turbidity values. From these studies, the determination coefficients were r
2 = 0.70 for Landsat 8 [
61] and r
2 = 0.90 [
62] and r
2 = 0.89 [
13] for the Moderate Resolution Imaging Spectroradiometer (MODIS).
It should be noted, however, that this method has its limitations. First, it is applicable for only small bodies of water. The georeferencing of particular images cannot be performed for uniform water areas if each photograph does not involve software to combine consecutive shots [
58], which can lead to artefacts and generate errors in the X,Y surface (
Table 3). Multispectral images of shallow water areas can also be affected by additional reflectance from the water bottom, which may strengthen the signal [
54], especially in shorter wavelengths (i.e., the green spectral band). The identification of glacial discharge can be affected through a number of phenomena: ice packs affect the imagery and release sediment particles into the water during melting and glacial calving, which, in cases of shallow fjords, can cause resuspension sediment particles from the sea floor [
63]. Errors can also be introduced through water movement and plume rearrangement within the time between the flyover and the
in situ measurements. Errors can also be produced by data aggregation, both in the overlap** of images from Parrot Sequoia+ (14-cm pixel resolution) and Zenmuse X5 (2-cm pixel resolution) and in joining the
in situ measurement data.
The analysis of turbidity or similar measures for the identification of glacial discharges was previously described in studies in both the Arctic and Antarctic regions [
19,
64,
65]. However, combining it with remote sensing methods is less common in the Antarctic [
66]. There has been no previous work concerning the utilization of drones with multispectral cameras for monitoring glacial sediment plumes. The Parrot Sequoia+ multispectral camera is mainly used in precision agriculture, and there are very few publications concerning its utilization for hydrological investigations. Previous studies referred to, among others, SSCs in different water layers in rivers [
58], the precision of digital surface models (DSM) in water pools based on multispectral camera pictures [
67], or assessments of the ecological integrity of wetlands through multispectral map** [
68]. Nonetheless, there are no findings confirming the applicability of using multispectral UAVs for research on polar marine areas. This innovative study suggests the vast potential for using multispectral drone-borne sensors in analysing water surfaces, even in the hostile topographic and meteorological conditions that are found in the lagoons and coves of tidewater glacier termini. This study presents the possibility of using drones in places in which traditional remote sensing methods are not applicable. These places include areas with high cloud coverage such as the Southern Shetlands [
69,
70] and where microscale processes such as the transport of sediment by runoff and sediment plume dispersion affect the water bodies. This study can be groundwork for further research into marine and lake environments in polar regions, which, in times of climate change, are the subject of intensive transformation [
71].
5. Conclusions
In this study, the utilization of the Parrot Sequoia+ multispectral sensor installed on the Parrot Bluegrass UAV was tested. The results provide support for the use of multispectral sensors given by the Zenmuse X5 camera on an Inspire 2 quadcopter drone, which, due to its high-resolution photographs in the natural RGB colour model, identified glacial discharges as well as the recognition of plume shapes and colours.
The research shows that the Parrot Sequoia+ camera can be successfully used for the analysis of water turbidity. Red wavelengths are applicable for identifying values representing low-turbidity and medium-turbidity waters (<70 FNU) and for identifying red (sediment A) and white sediments (sediment B) in water. In cases of high turbidity in water surface layers, the use of longer wavelengths, such as RE and NIR wavelengths, is suggested. UAV technology allowed the observation of ice phenomena (i.e., mélanges, growlers, ice packs) that prevent this type of analysis or interfere with its results. Sediment type also has an impact since it causes disparities in the electromagnetic reflectance values in different spectral ranges. The UAV methodology is more applicable for small-scale observations, such as those described here, than traditional remote sensing techniques. Using low-resolution satellite imagery from MODIS and Landsat 8 does not register such phenomena and generates a high level of uncertainty.
The Parrot Bluegrass and Inspire 2 UAVs can be effectively used in the Antarctic, even in unfavourable meteorological conditions such as low air temperatures. However, the wind speed oscillated by 5 ms−1, and no precipitation was observed. This study presents new opportunities for using multispectral remote sensing with UAVs in such fields as oceanography and geology, which gives an innovative outlook on research in areas that are difficult to reach by both remote and in situ methods.


