
Simulating Diurnal Variations of Water Temperature and Dissolved Oxygen in Shallow Minnesota Lakes


Abstract
:1. Introduction
2. Materials and Methods
2.1. Daily Year-Round Water Temperature Model
2.2. Daily Dissolved Oxygen Model
2.3. Sediment Temperature Simulation
2.4. Modifications to the Daily Model
2.5. Modeled Shallow Lakes
3. Modeling Results
3.1. Model Calibration
3.2. Diurnal Variations
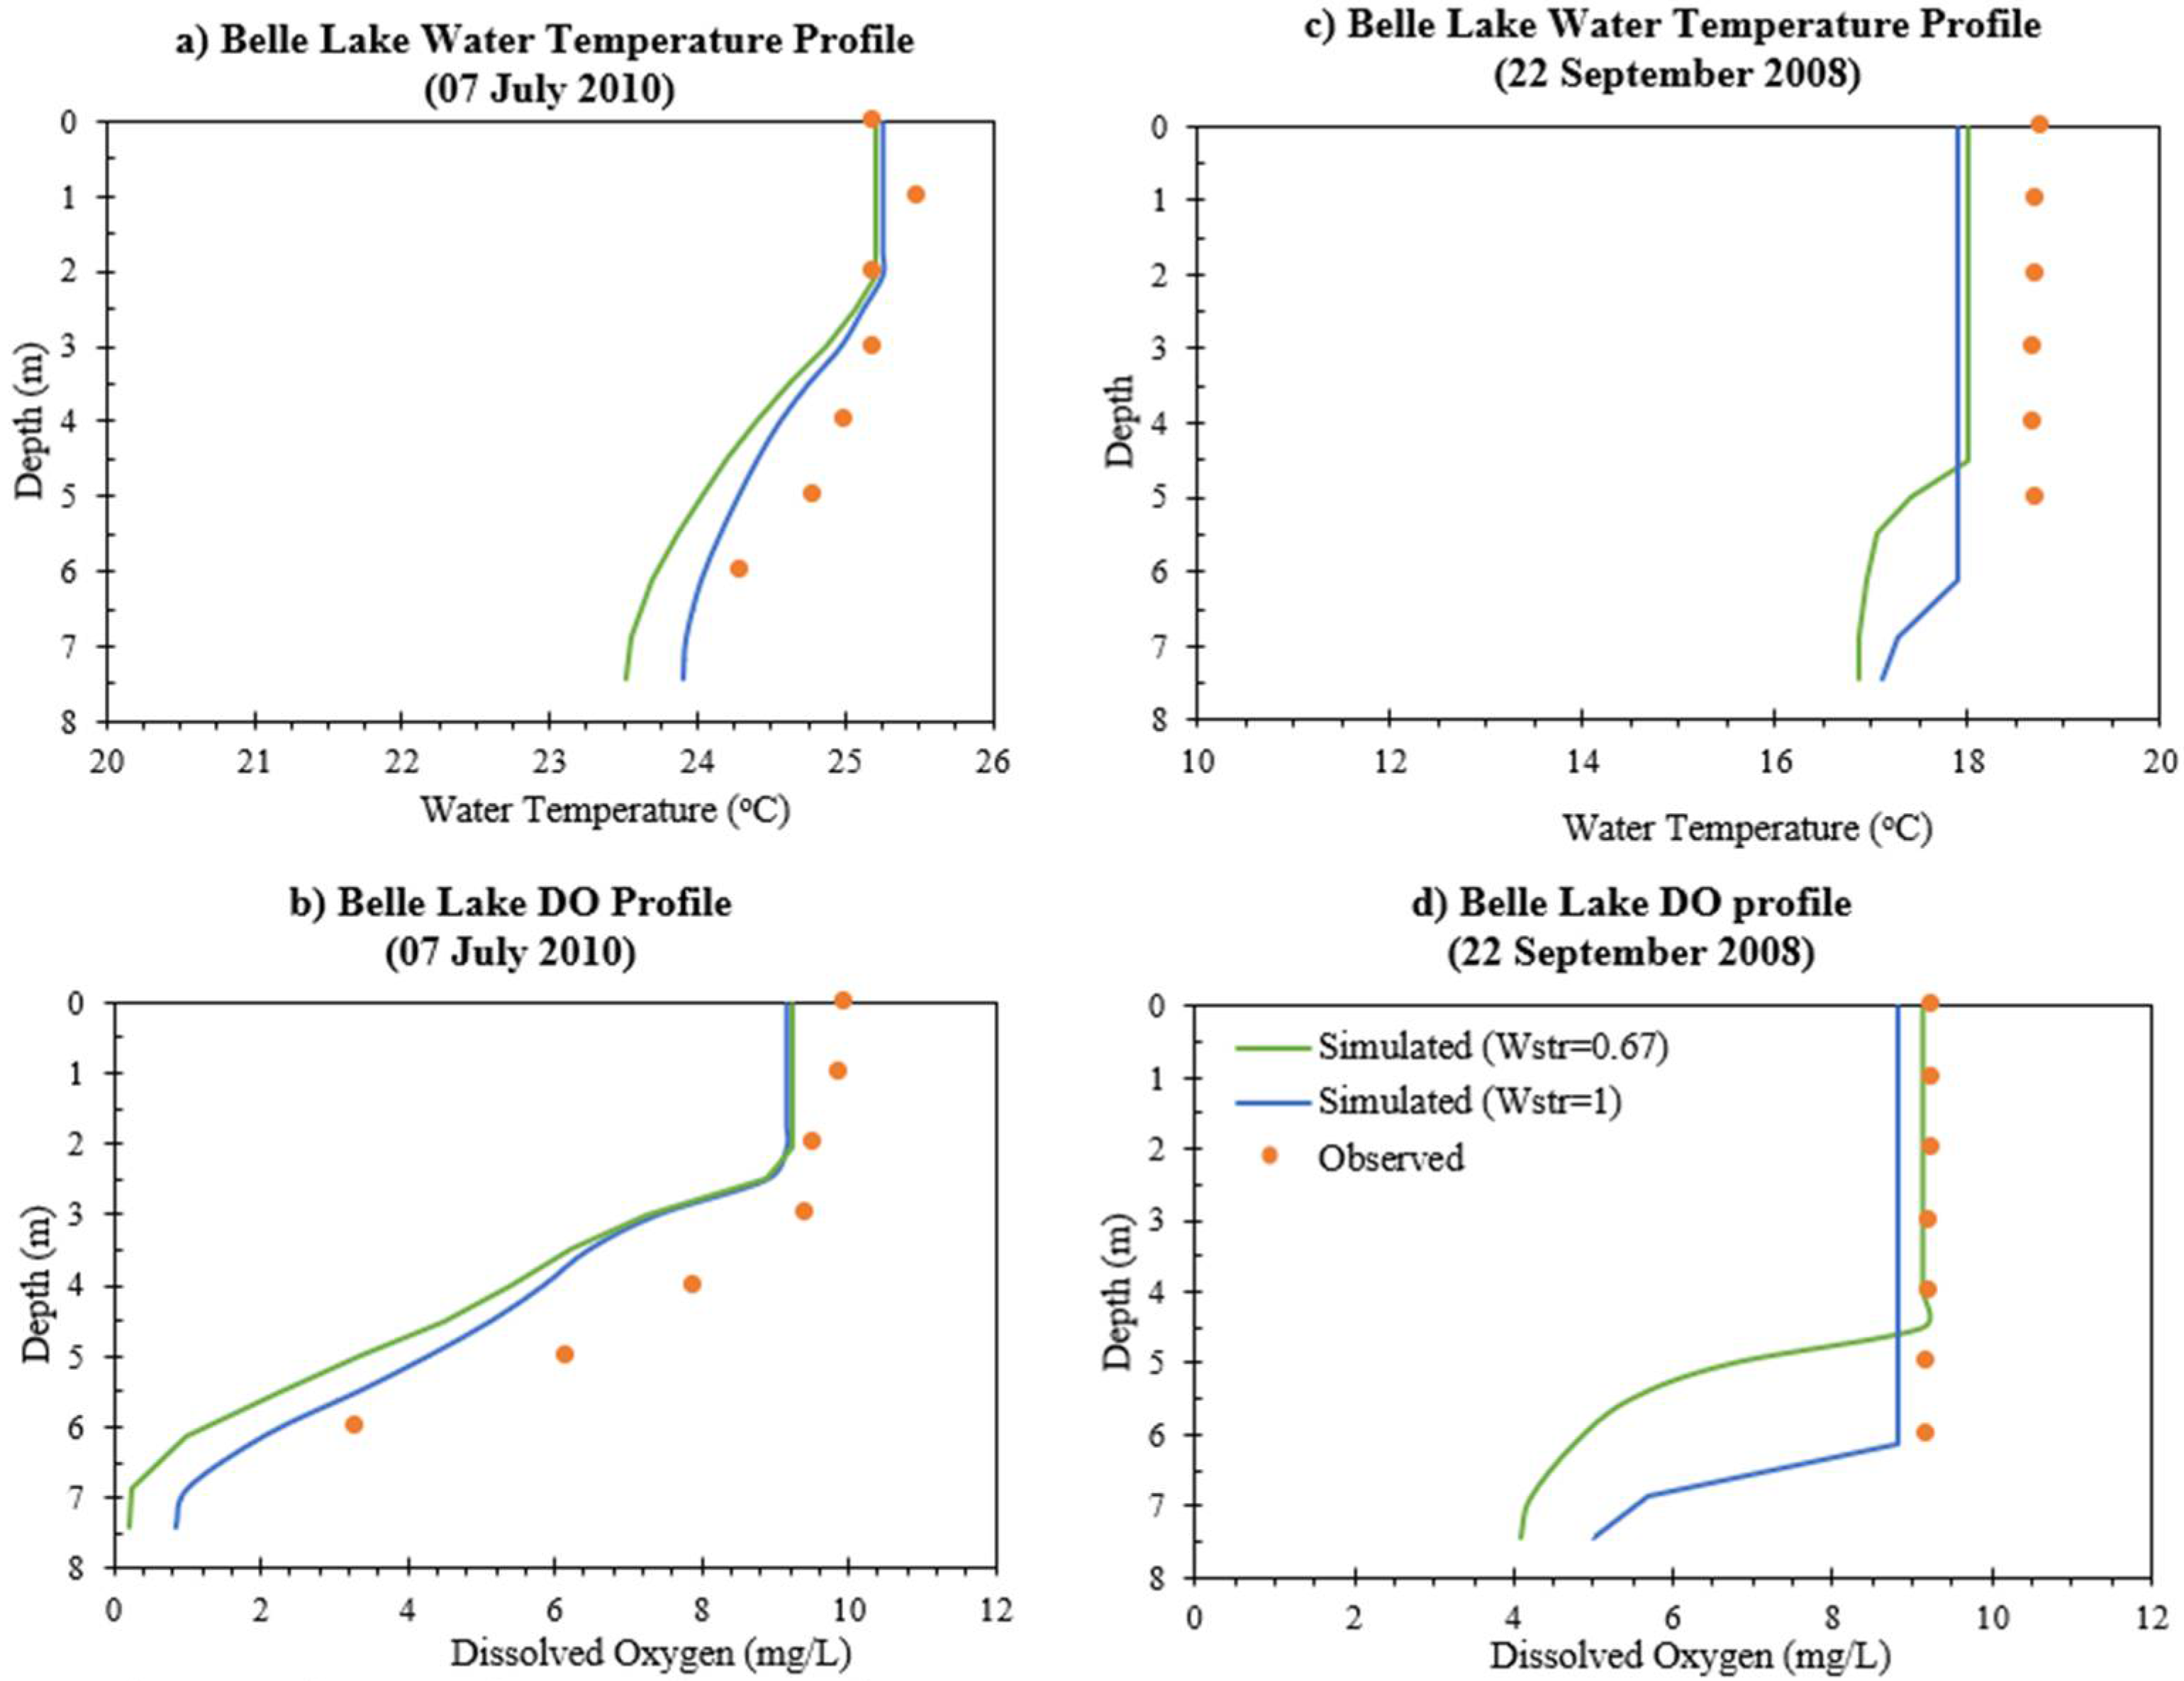
3.3. Profile Comparison
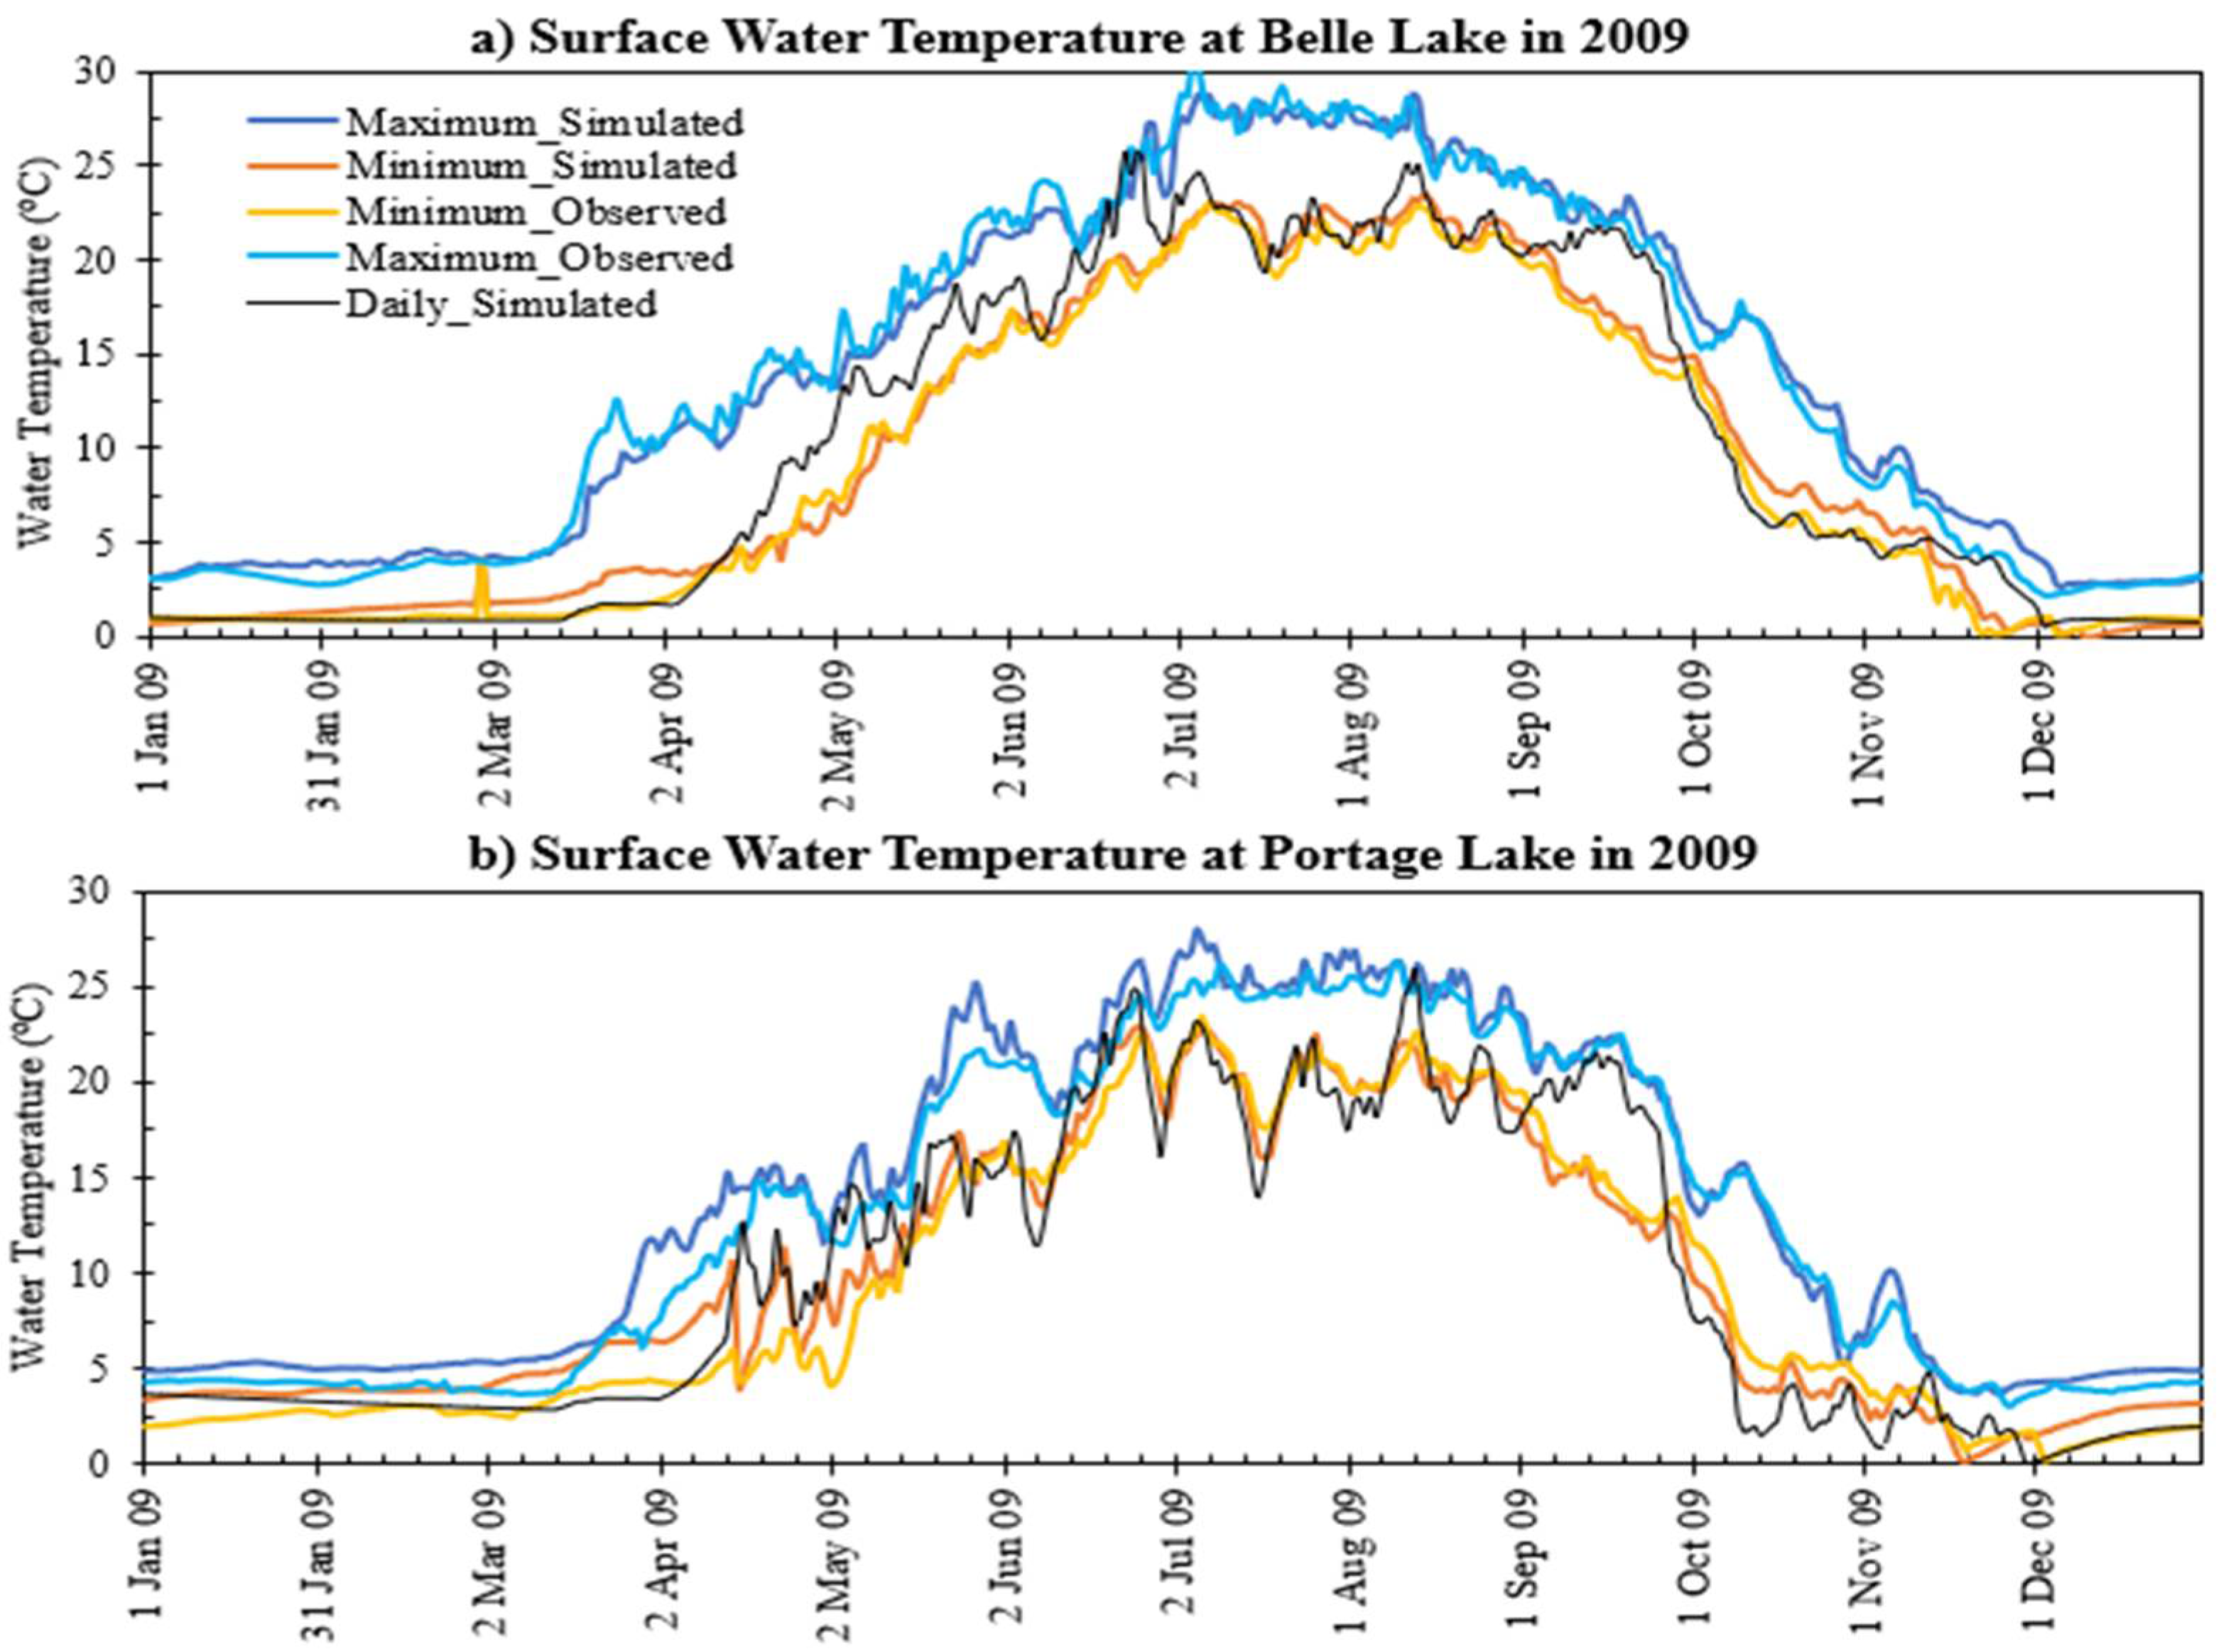
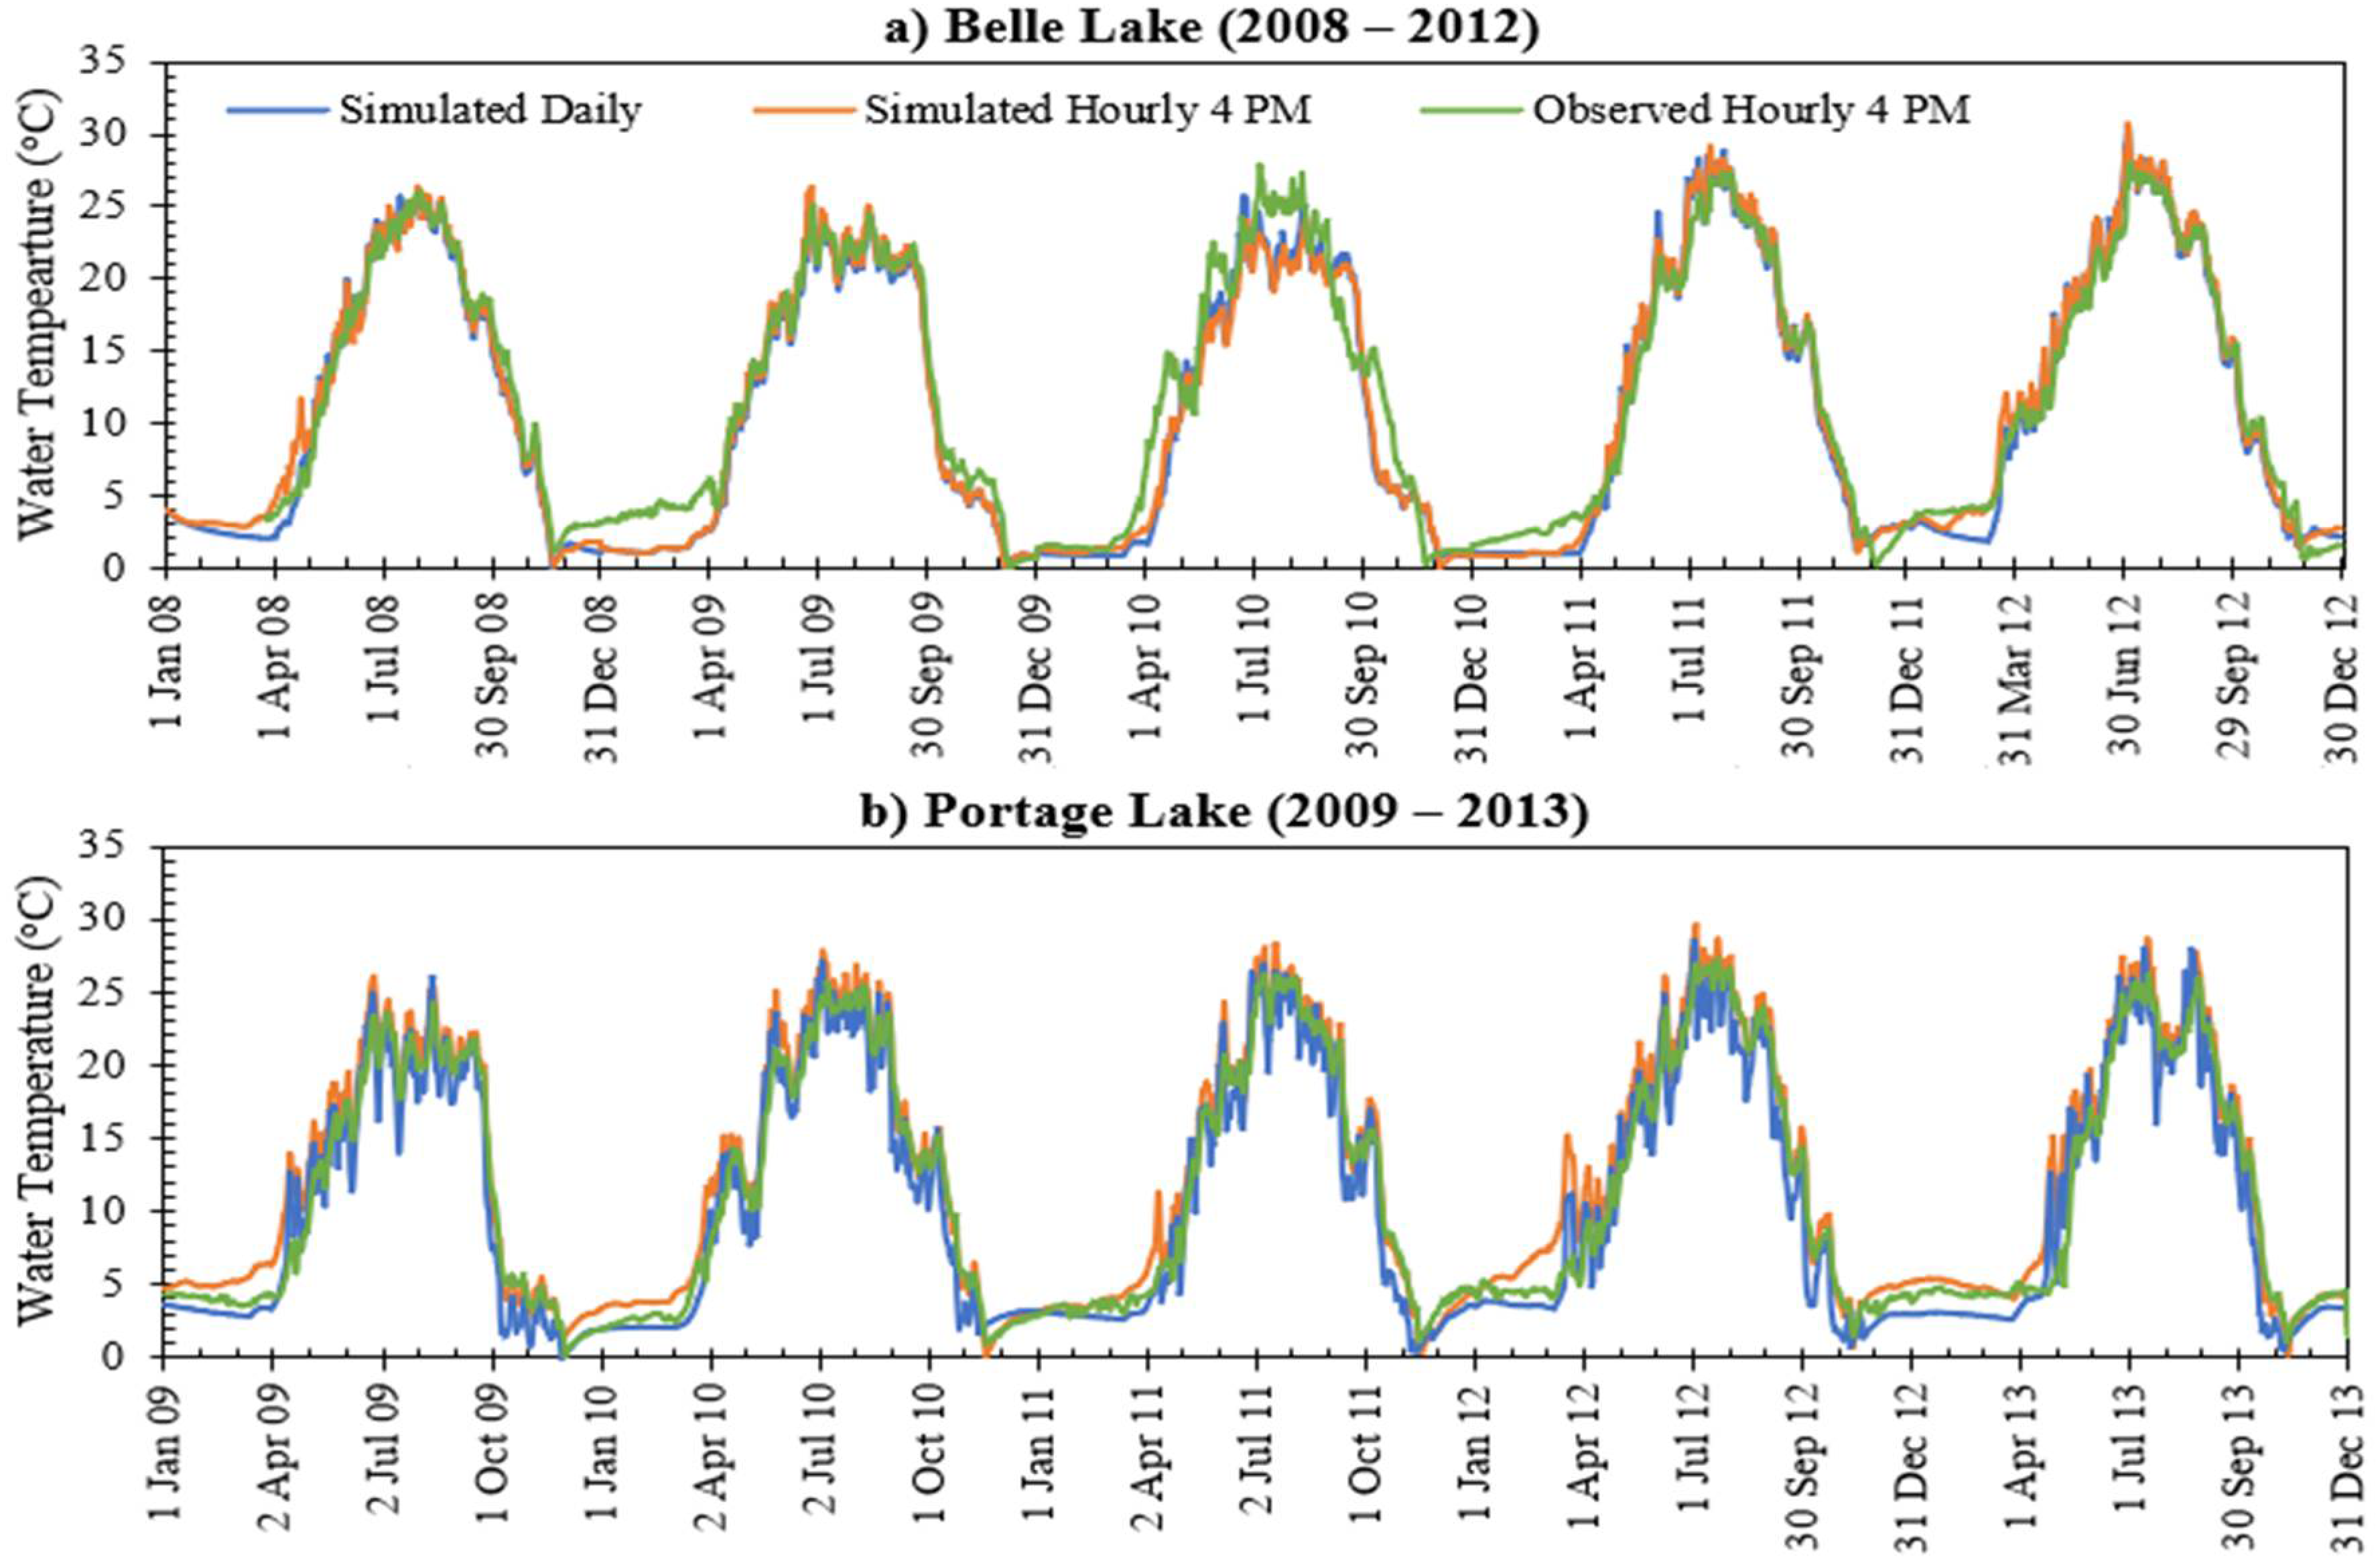
3.4. Comparison of Long-Term Surface Temperature Simulation
3.5. Comparison of Heat Flux, DO Production and Reaeration
3.6. Impact of Direct Solar Radiation Heating on Sediment Bed
4. Discussion
4.1. Short-Term Mixing Prediction
4.2. Stratification Prediction
4.3. Application in Lake Management
4.4. Future Studies
5. Conclusions
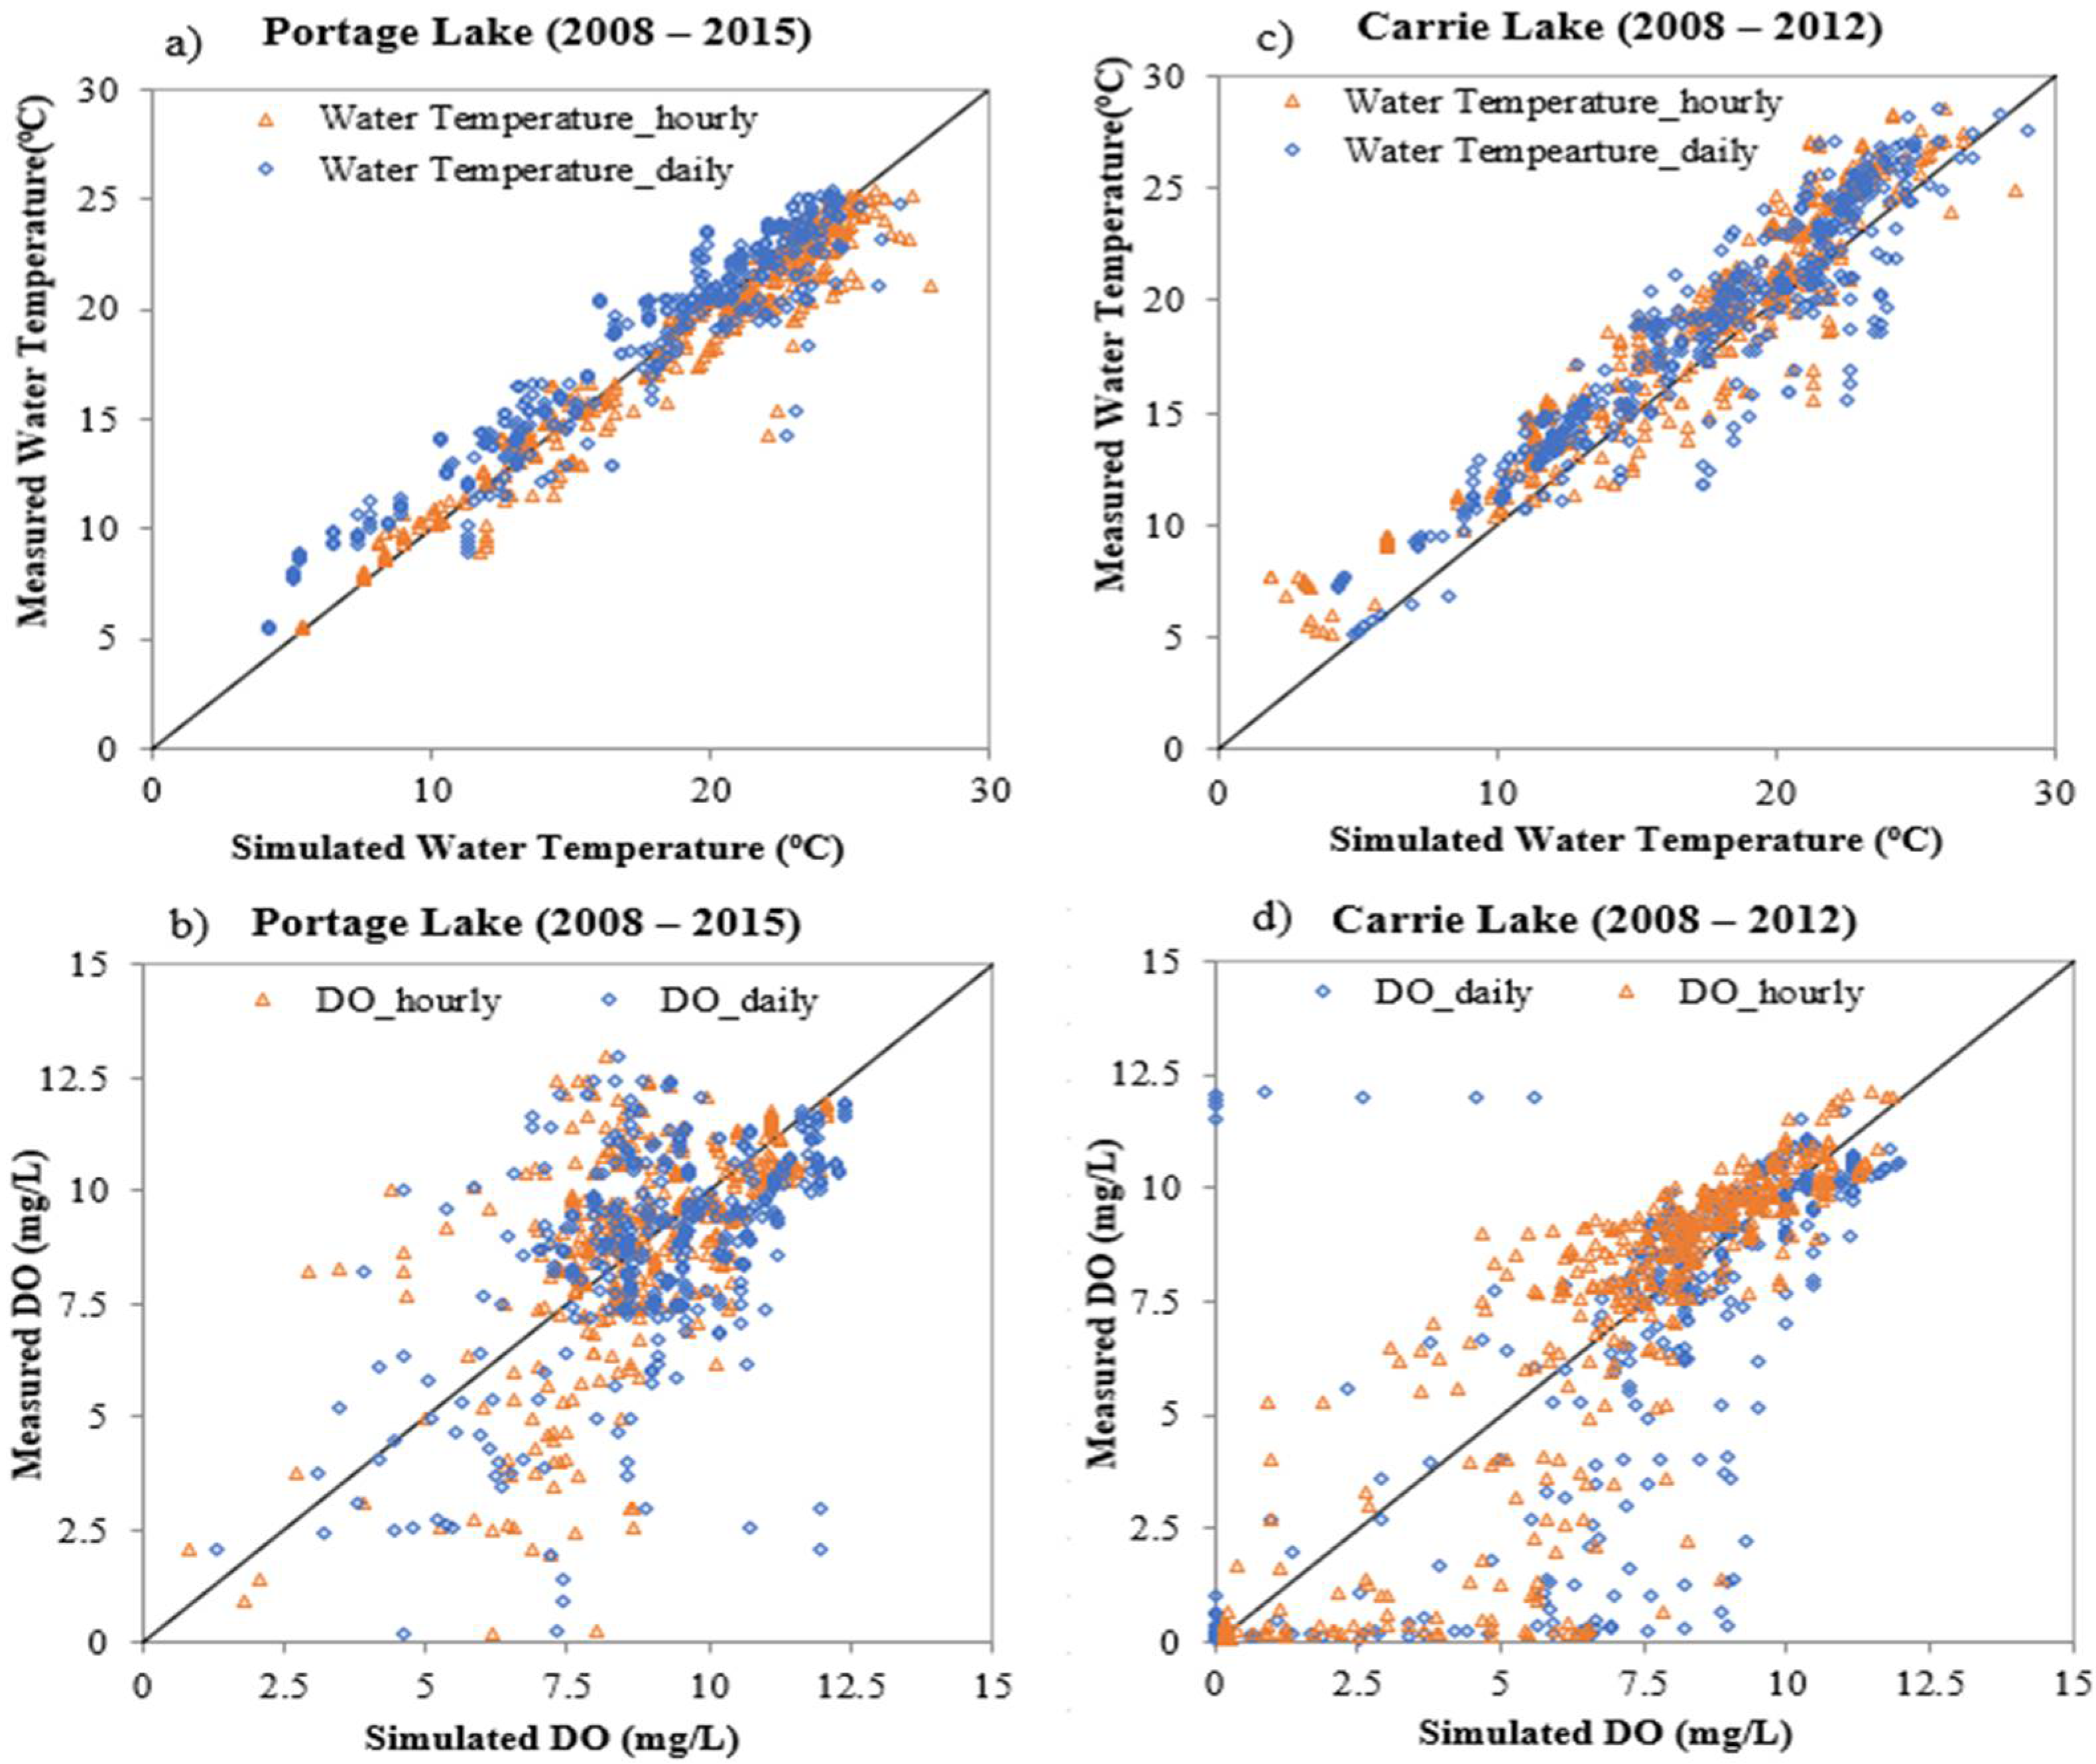
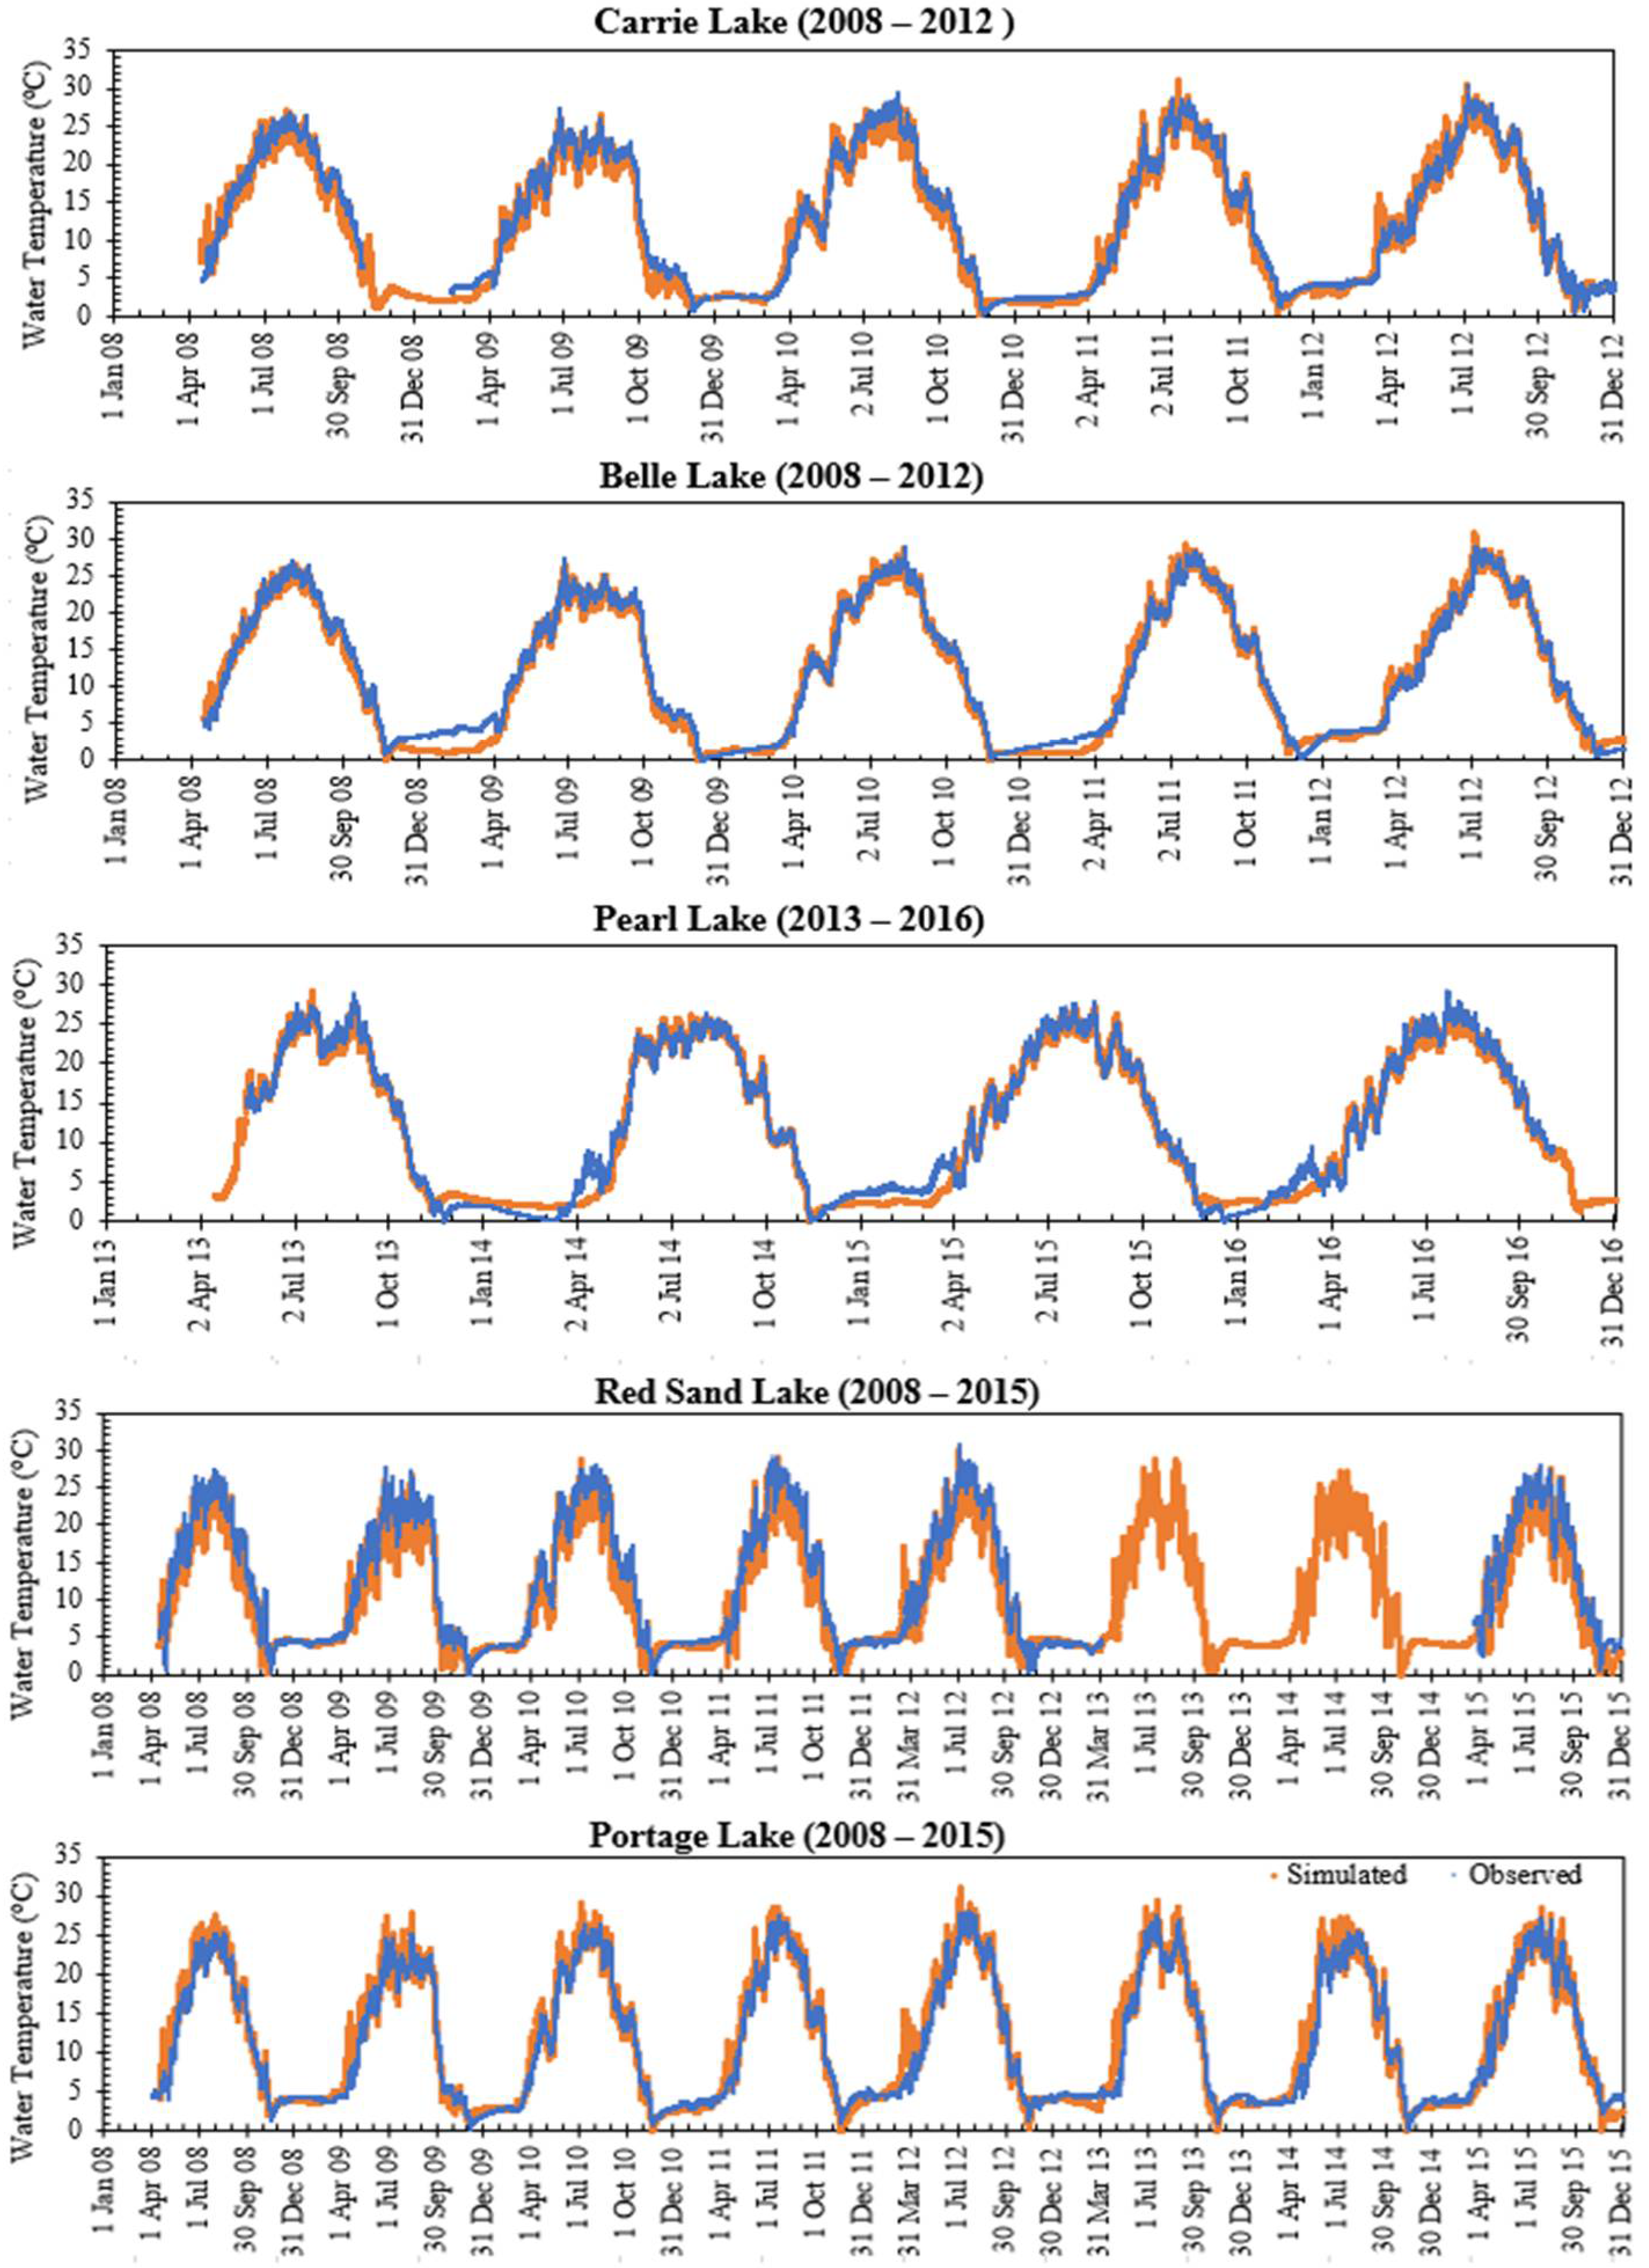
- MINLAKE2018 was calibrated against measured profiles in five shallow Minnesota lakes (Table 4) with an average standard error of 1.48 °C for temperature and 2.02 mg/L for DO. With the help of available surface water temperature hourly data, the average RMSE of long-term water temperature simulation was 1.50 °C with a standard deviation of 0.32 °C. For Pearl Lake, the average RMSE for water temperature simulation at six different depths is 1.30 °C with a standard deviation of 0.15 °C.
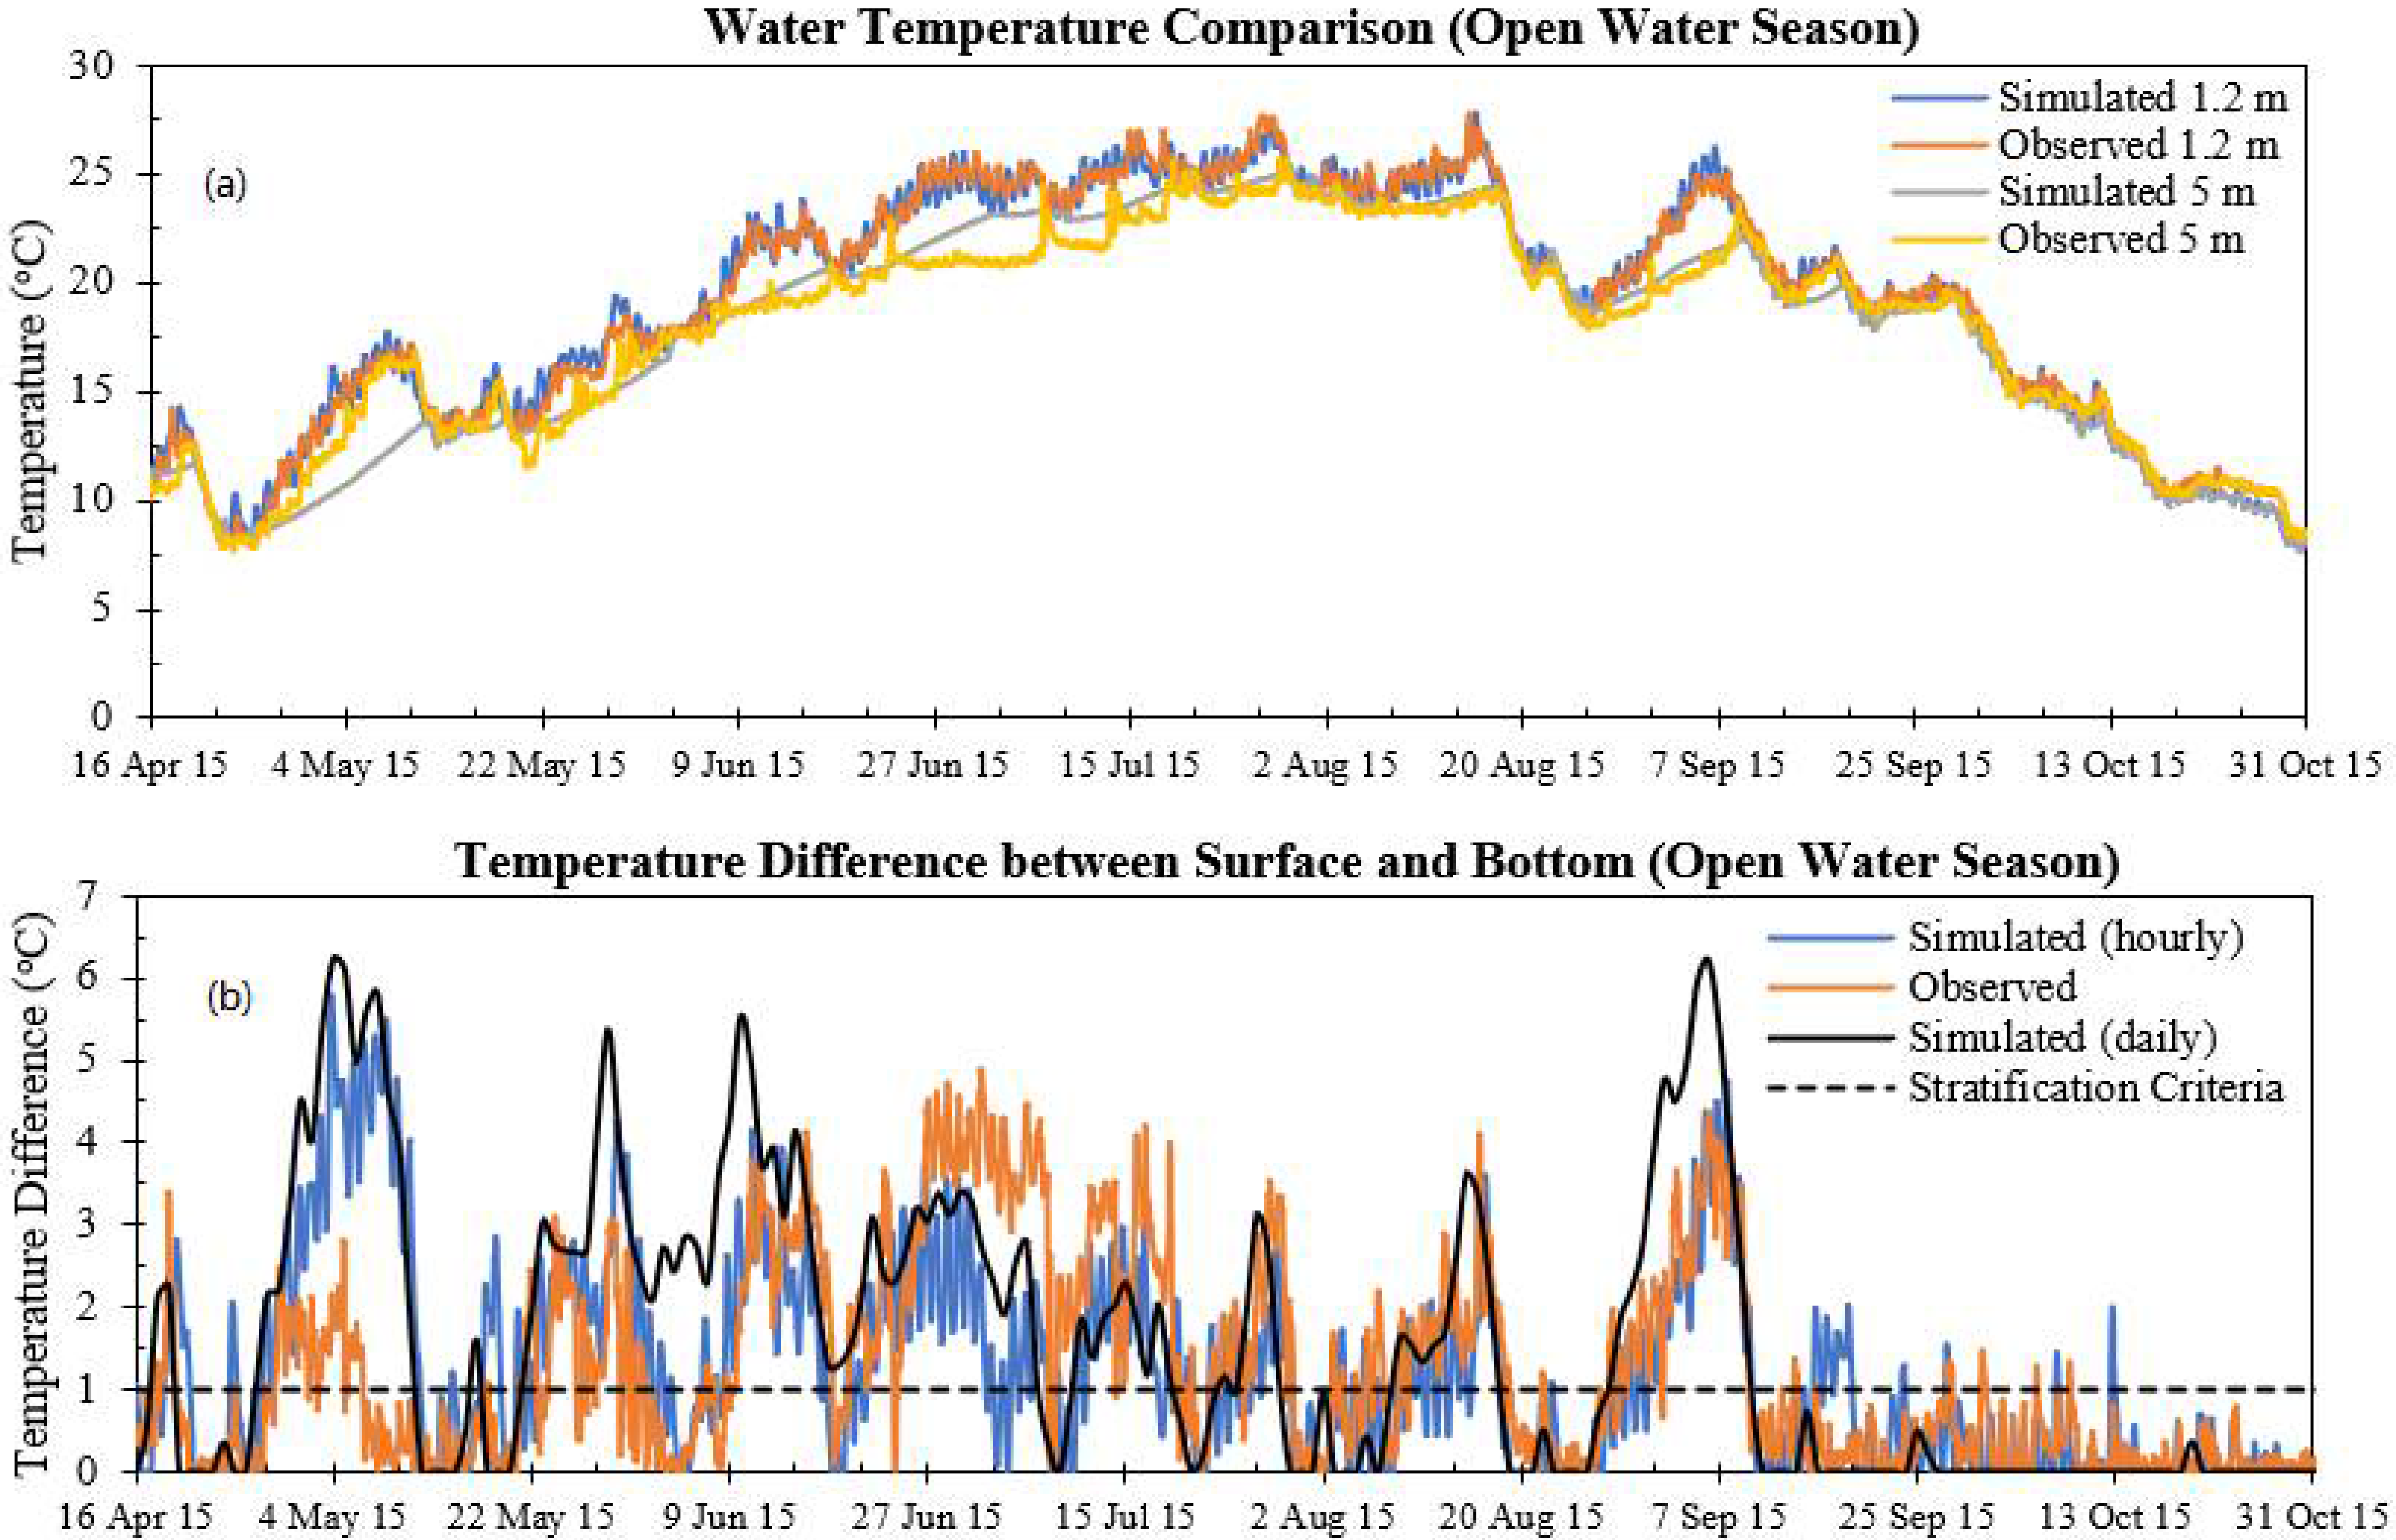
- When compared with the daily MINLAKE2012 model, for Pearl Lake (Hmax = 5.6 m), the hourly model calculated 12% and 13% more temperature stratification for ice cover period and open water season, respectively (Table 6). Similarly, for DO, stratification increases were 14% and 20% for ice cover period and open water season, respectively. For other lakes, hourly model simulation also resulted in increased stratification percentages for water temperature and DO. The hourly model can capture diurnal changes and mixing events that lasted a few hours within a day, which the daily model ignores. Moreover, it was observed that the daily model could not predict most of the weak stratifications of shallow lakes in the fall season (Figure 12). As a result, to ensure desired water quality for aquatic organisms and fish habitat, the hourly model is suitable for shallow lakes all year round.
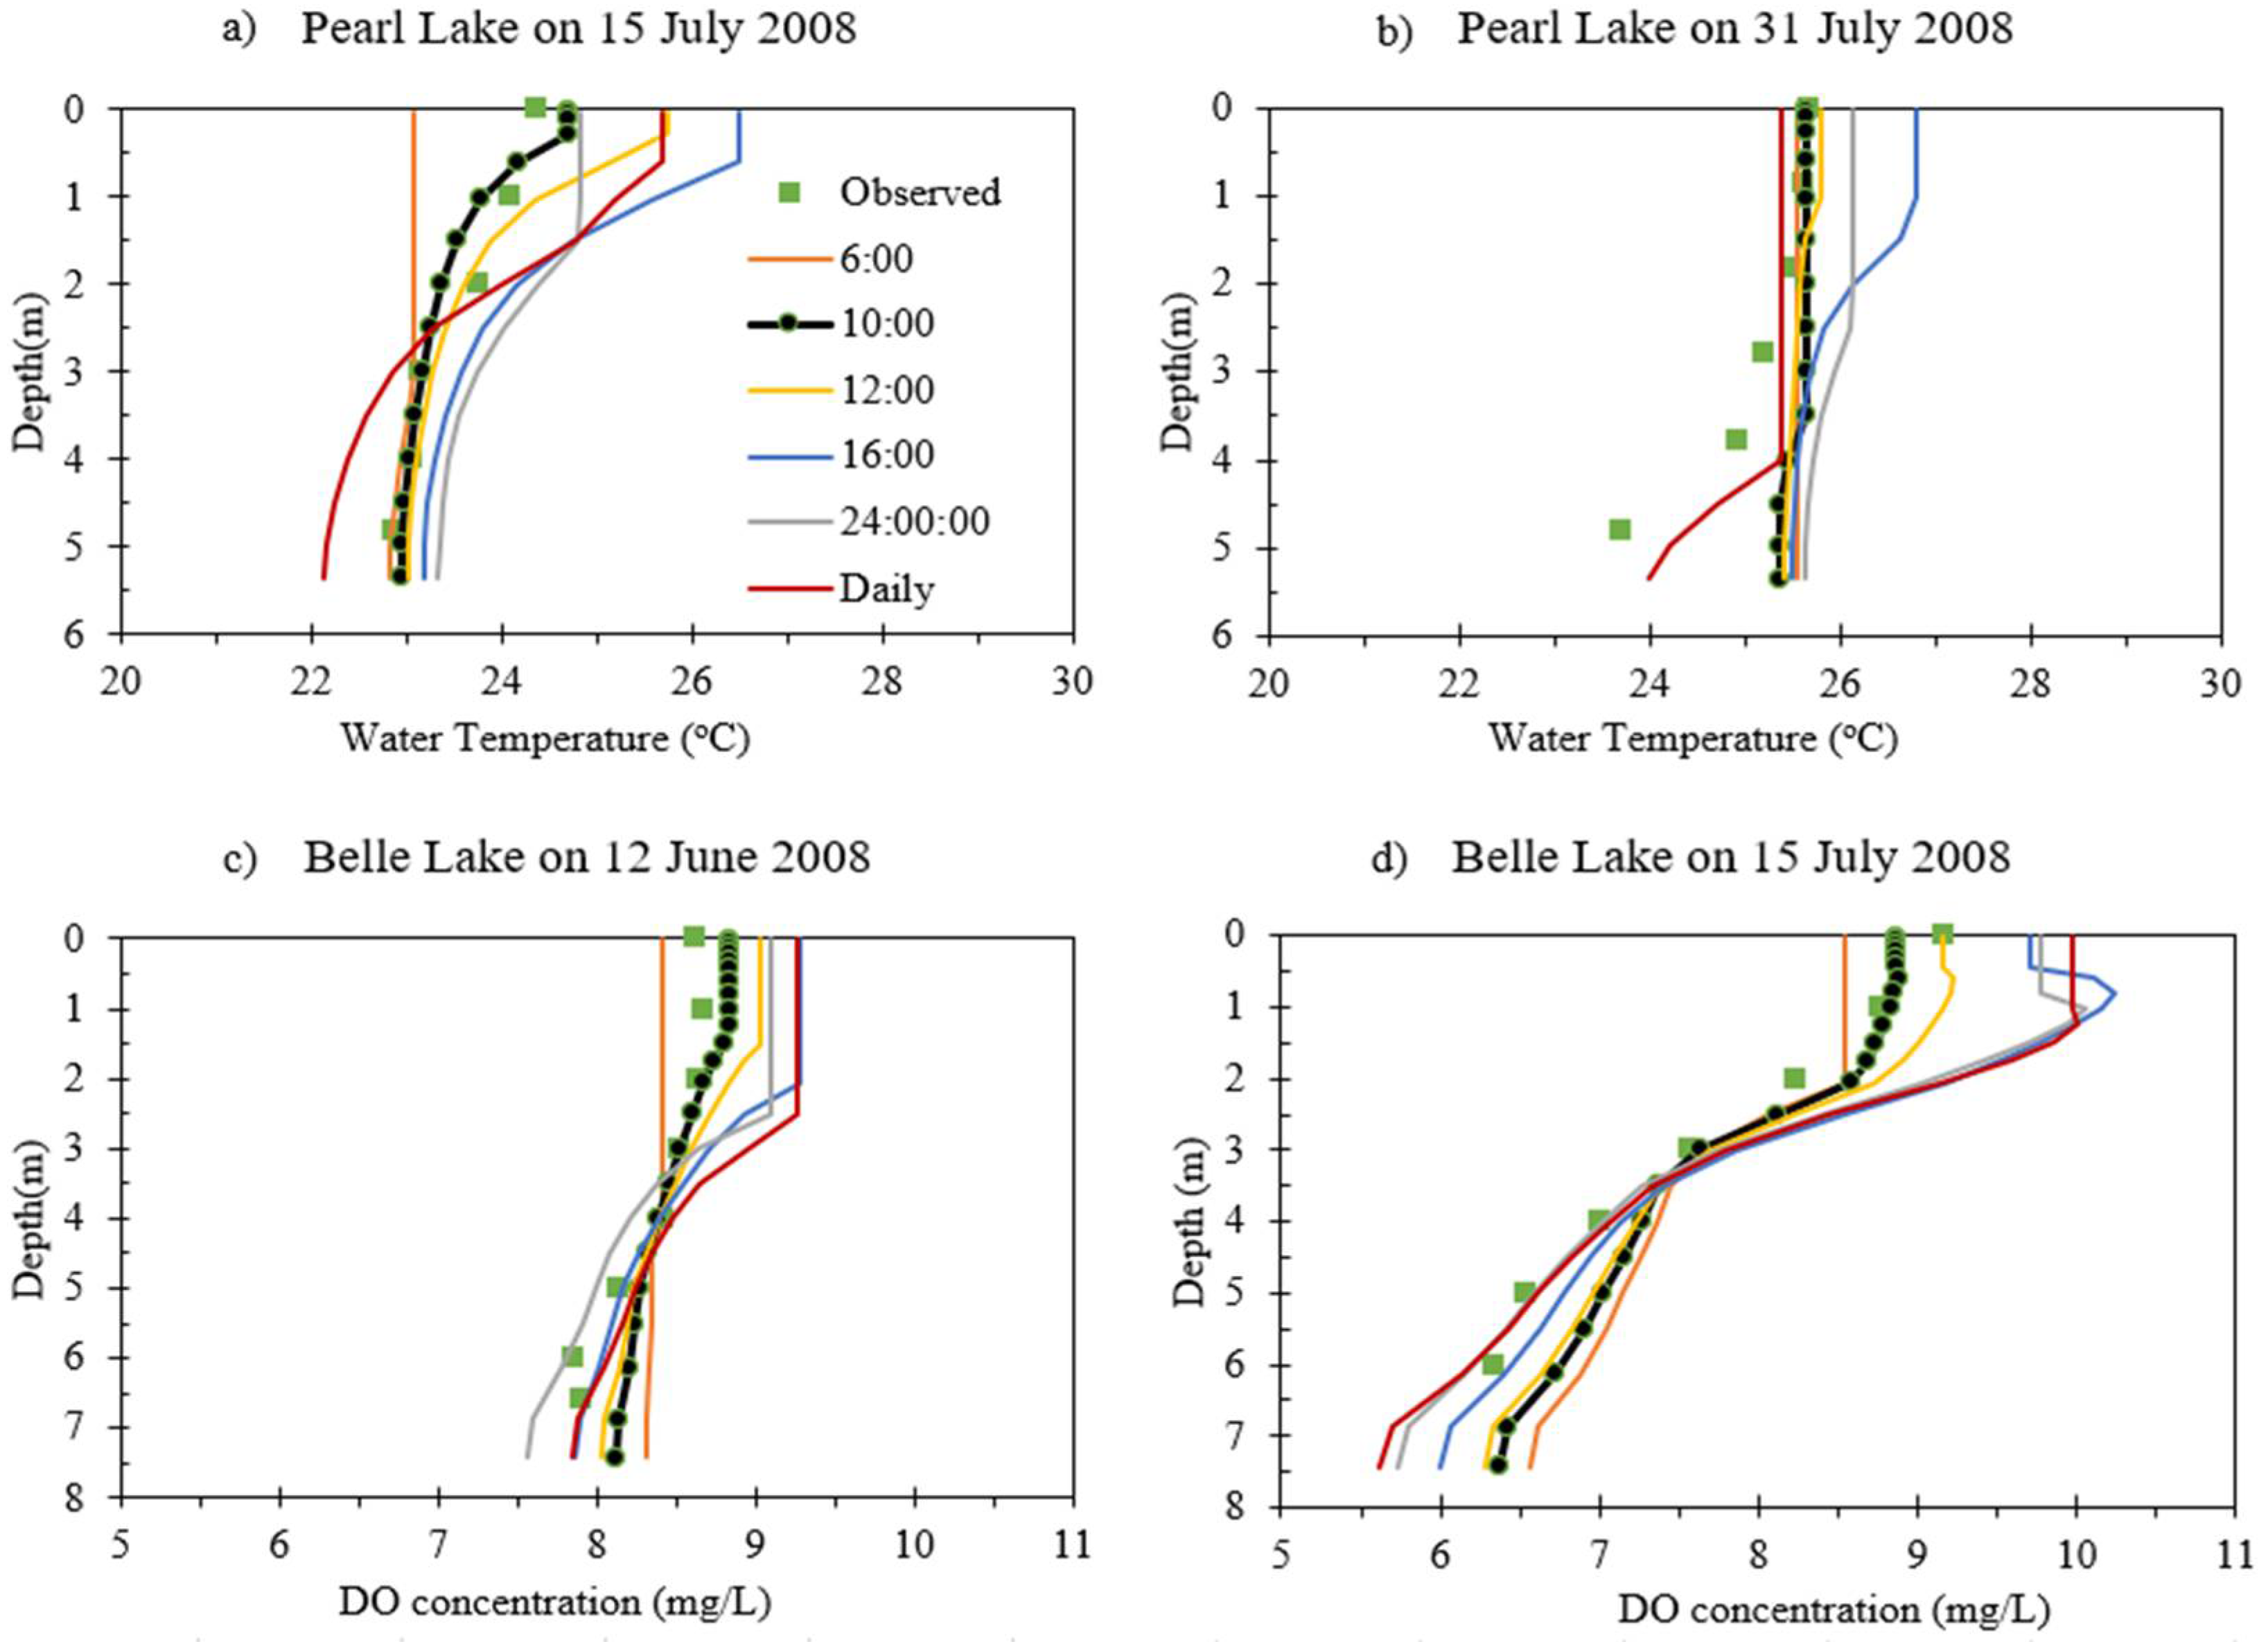
- The hourly model MINLAKE2018 performs better than the daily model MINLAKE2012 in water temperature and DO profile simulation (Figure 2). The RMSEs of temperature and DO from MINLAKE2018 decreased by 17.3% and 18.2%, respectively, and Nash-Sutcliffe efficiency increased by 10.3% and 66.7%, respectively, in comparison to MINLAKE2012.
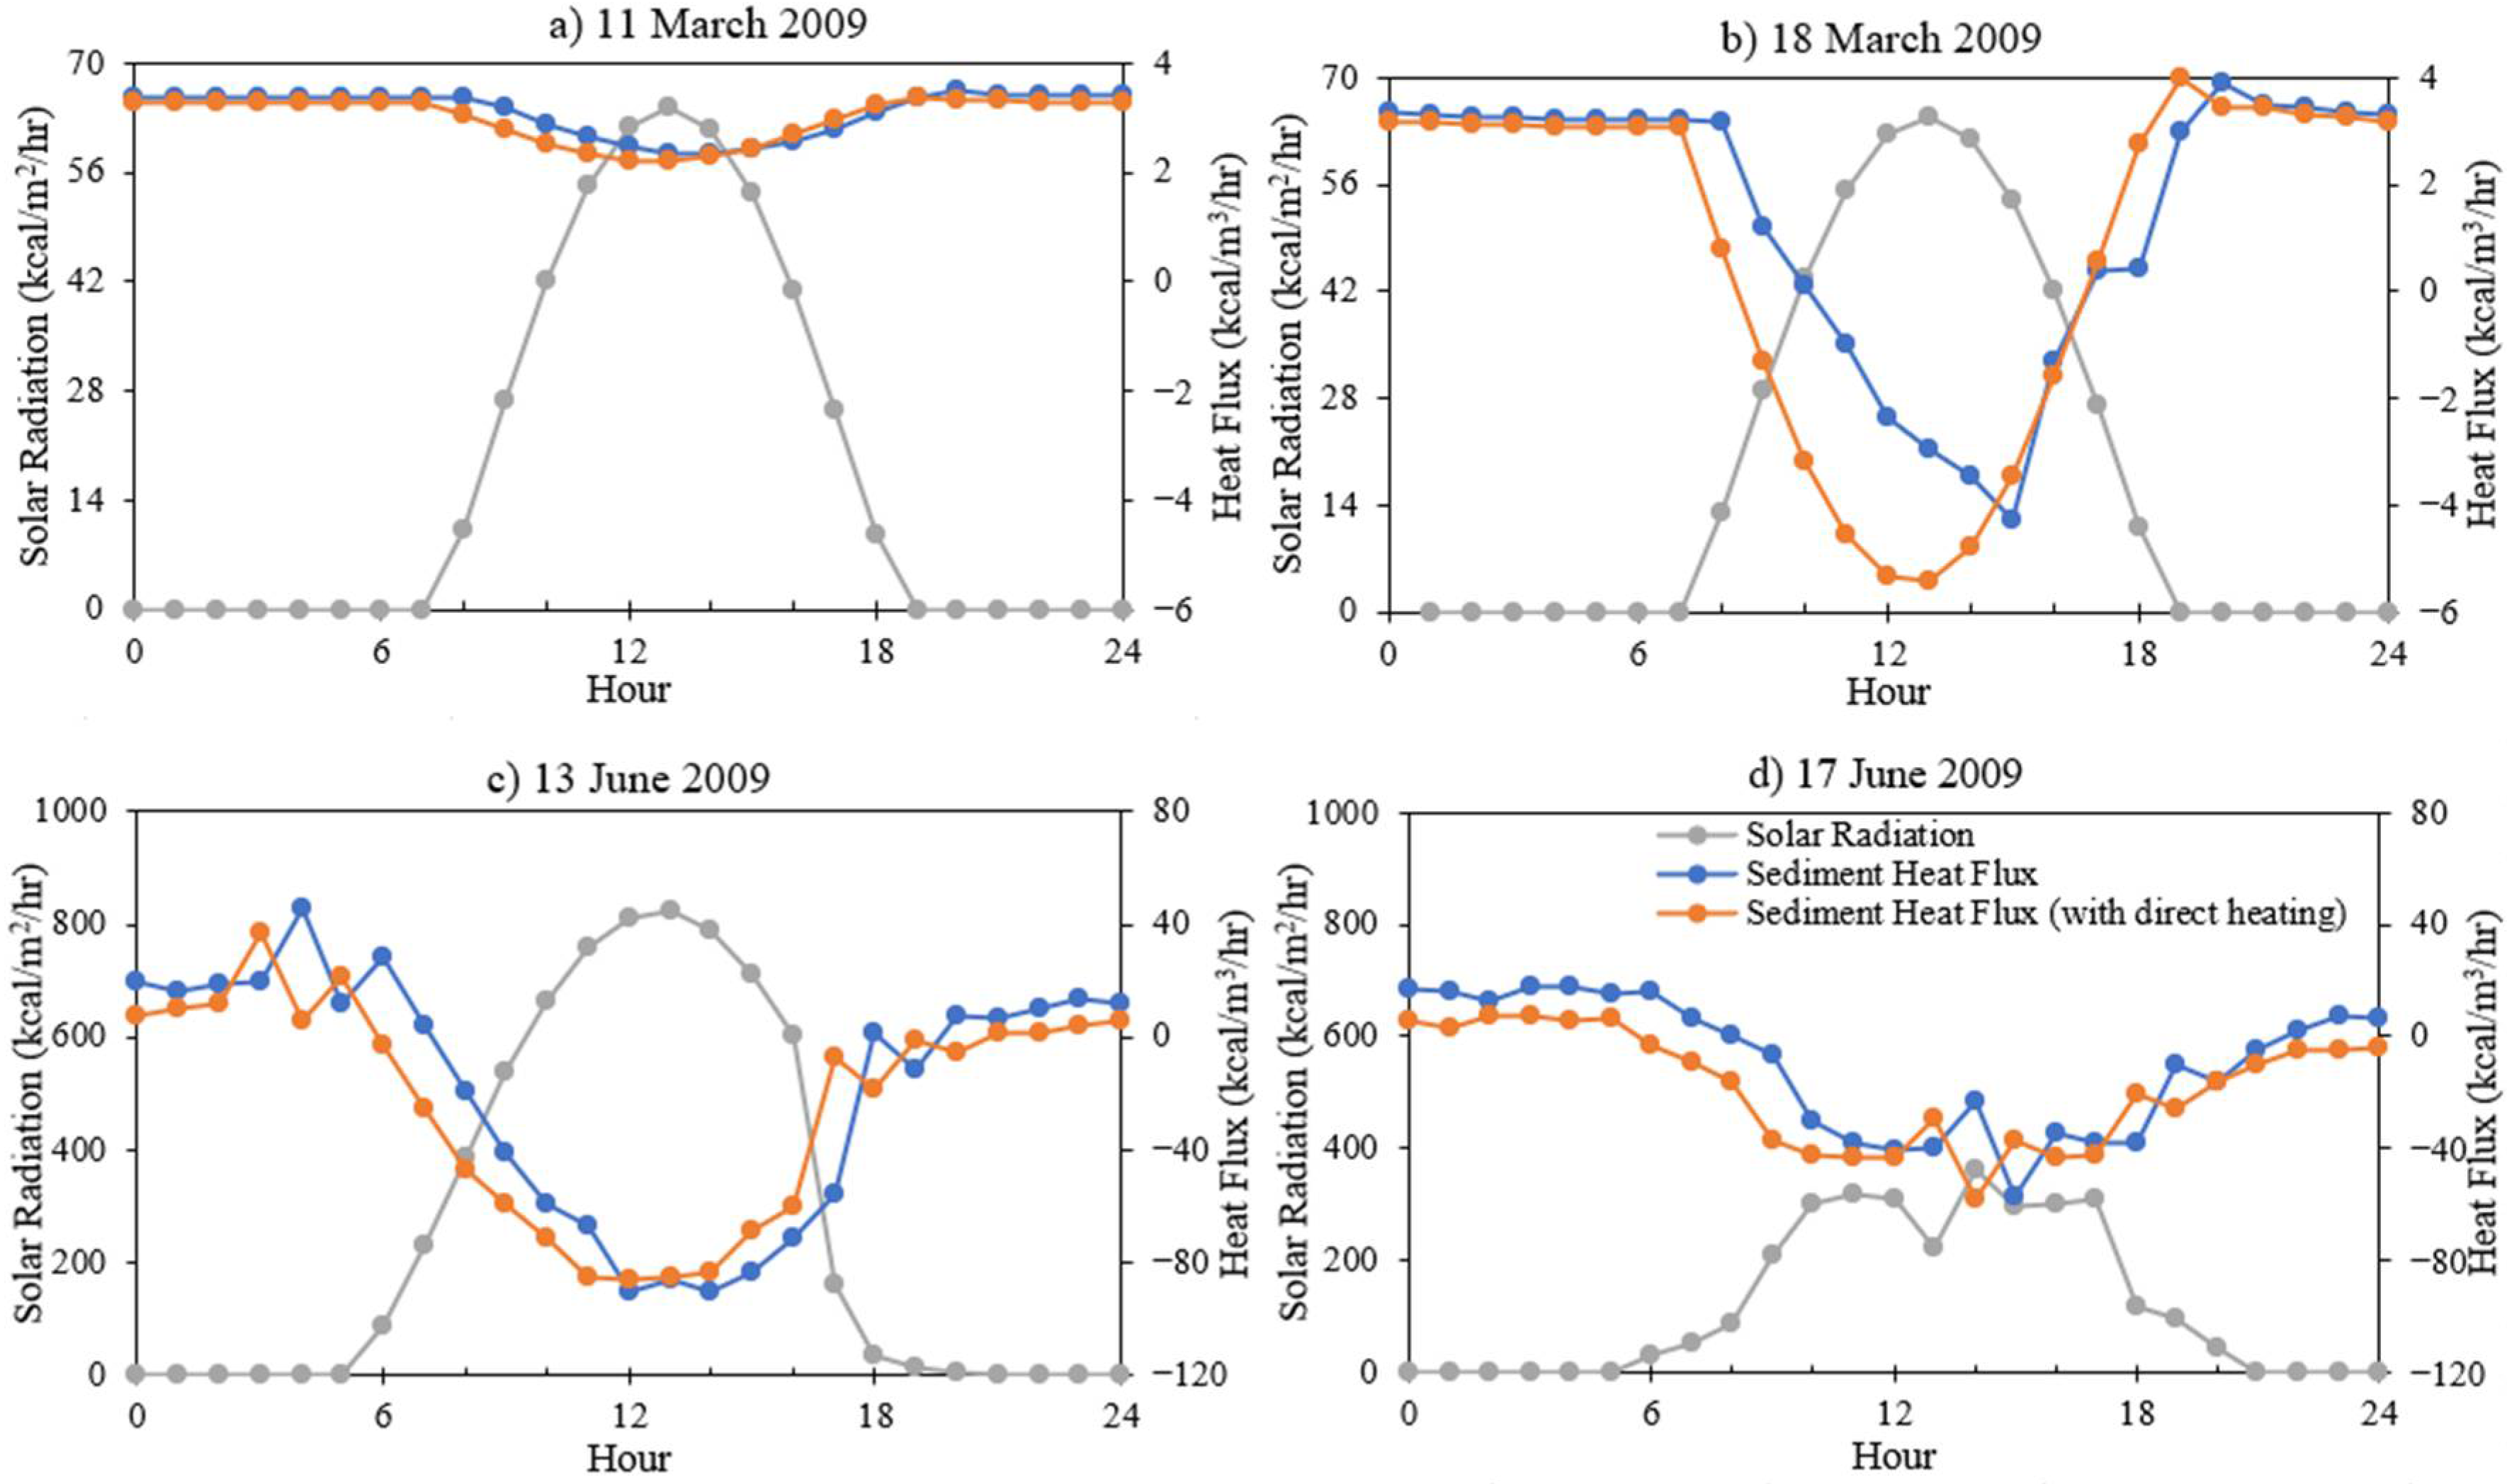
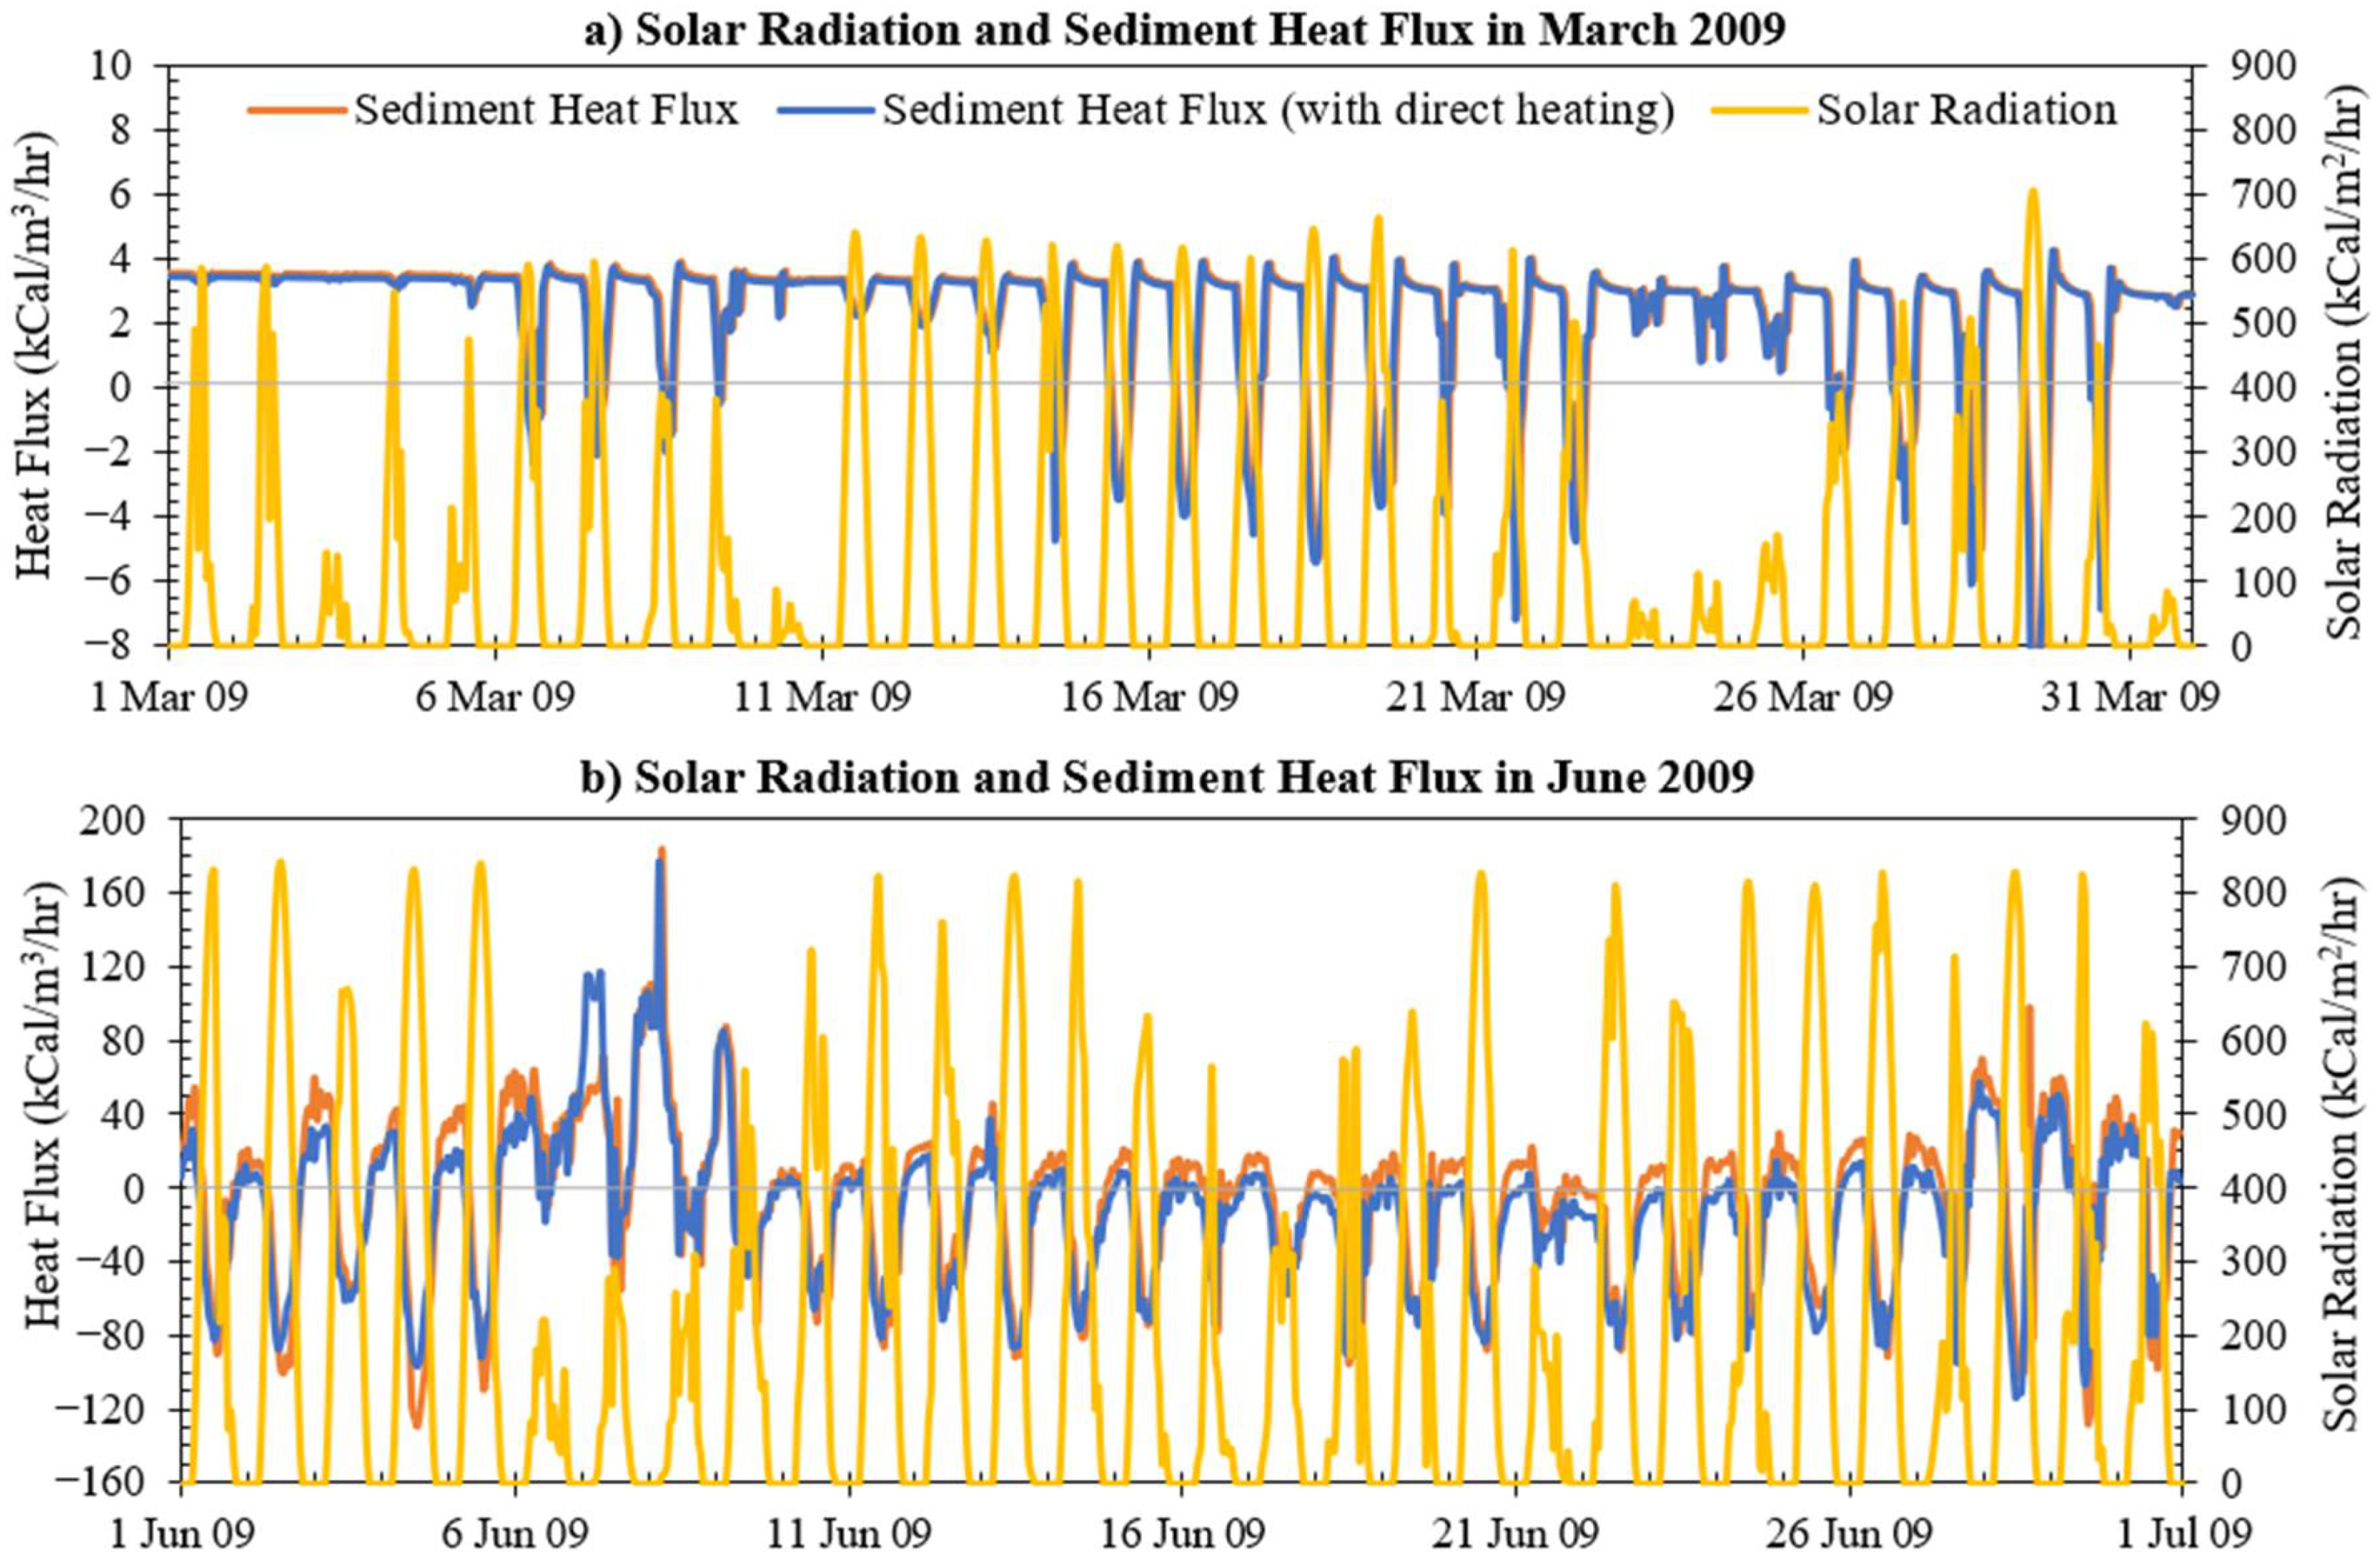
- Sediment heating subroutine was modified to include direct heating of sediment from solar radiation for all sediment layers. After modification, the sediment heat flux pattern became coincident with the solar radiation pattern eliminating the lag time between the change in solar radiation and the change in heat flux to appear. The magnitude of sediment heat flux was reduced for both cases (heat flux going from water to sediment or sediment to water) after the sediment subroutine was modified.
Author Contributions
Funding


| Lake | Surface Area, As, (km2) | Max. Depth Hmax, (m) | Geometry Ratio 1 (m)0.5 | Mean Chl-a (μg/L) | Trophic Status | Simulation Years | Number of Days with Profile Data |
|---|---|---|---|---|---|---|---|
| Carrie | 0.37 | 7.90 | 3.12 | 6.71 | Mesotrophic | 2008–2012 | 50 |
| Belle | 3.71 | 7.60 | 5.77 | 27.10 | Eutrophic | 2008–2012 | 73 |
| Pearl | 3.05 | 5.55 | 7.53 | 16.91 | Eutrophic | 2008–2012 | 36 |
| Portage | 1.54 | 4.57 | 7.71 | 15.98 | Eutrophic | 2008–2015 | 86 |
| Red Sand | 2.11 | 4.57 | 8.34 | 4.43 | Mesotrophic | 2008–2015 | 87 |
| Calibration Parameter | Effect on Model Results | Description of the Parameter |
|---|---|---|
| Wstr | Temperature and DO profiles | Wind sheltering coefficient |
| BOD | DO Profiles | Biochemical oxygen demand depending on lake trophic status |
| Sb20 | DO Profiles | Sediment oxygen demand, lake tropic dependent |
| EMCOE(1) | Temperature and DO Profiles | Multiplier for diffusion coefficient in the metalimnion |
| EMCOE(2) | DO Profiles | Multiplier for SOD below the mixed layer |
| Pmax | DO Profiles | Maximum photosynthesis rate for oxygen production |
| Parameter/Lakes | Red Sand Lake | Portage Lake | Carrie Lake | Pearl Lake | Belle Lake |
|---|---|---|---|---|---|
| Wstr | 0.47 (0.47) | 0.37 (0.37) | 1 (1.0) | 0.6 (0.4) | 0.67 (1.0) |
| BOD | 0.75 (0.75) | 1.5 (1.5) | 1 (0.75) | 0.75 (1.5) | 1.5 (1.0) |
| Sb20 | 0.75 (0.75) | 1.5 (1.5) | 1.5 (0.75) | 0.75 (1.5) | 1.5 (1.8) |
| EMCOE(1) | 1 (7) | 1 (3) | 1 (3) | 1 (0.8) | 1 (4) |
| EMCOE(2) | 1 (3) | 1.1 (1) | 0.82 (1.2) | 1 (0.7) | 1 (0.5) |
| Pmax | 9.6 (16.8) | 9.6 (8.5) | 9.6 (9.6) | 9.6 (8.5) | 9.6 (7.7) |
| Lake Name | Hourly Model (MINLAKE2018) | |||||
|---|---|---|---|---|---|---|
| Water Temperature | Dissolved Oxygen | |||||
| RMSE 1 (°C) | NSE 2 | Slope 3 | RMSE (mg/L) | NSE | Slope | |
| Carrie Lake | 2.21 | 0.85 | 1.04 | 1.69 | 0.78 | 0.96 |
| Pearl Lake | 1.03 | 0.98 | 0.98 | 2.23 | 0.35 | 1.00 |
| Belle Lake | 1.03 | 0.96 | 1.03 | 1.53 | 0.69 | 1.00 |
| Red Sand Lake | 1.86 | 0.94 | 0.97 | 2.77 | 0.36 | 0.99 |
| Portage Lake | 1.41 | 0.97 | 0.98 | 1.91 | 0.31 | 0.99 |
| Average ± STD 4 | 1.48 ± 0.32 | 0.96 ± 0.02 | 0.98 ± 0.01 | 2.02 ± 0.49 | 0.50 ± 0.22 | 0.99 ± 0.02 |
| Lake Name | Daily Model (MINLAKE2012) | |||||
| Carrie Lake | 2.47 | 0.77 | 1.08 | 2.76 | 0.42 | 0.92 |
| Pearl Lake | 1.04 | 0.97 | 0.98 | 2.58 | 0.13 | 0.98 |
| Belle Lake | 1.14 | 0.96 | 1.01 | 2.09 | 0.43 | 0.94 |
| Red Sand Lake | 2.48 | 0.79 | 0.97 | 2.90 | 0.29 | 0.98 |
| Portage Lake | 1.82 | 0.86 | 1.03 | 2.03 | 0.22 | 0.96 |
| Average ± STD | 1.79 ± 0.69 | 0.87 ± 0.09 | 1 ± 0.03 | 2.47 ± 0.39 | 0.30 ± 0.13 | 0.96 ± 0.03 |
| Surface Depths | Carrie Lake | Pearl Lake | Belle Lake | Red Sand Lake | Portage |
|---|---|---|---|---|---|
| RMSE | 1.82 | 1.22 | 1.19 | 1.95 | 1.33 |
| NSE | 0.95 | 0.98 | 0.98 | 0.94 | 0.99 |
| Slope | 0.98 | 0.98 | 0.99 | 0.97 | 0.99 |
| Pearl Lake | 1.7 m | 2.4 m | 3.4 m | 4.4 m | 5.0 m |
| RMSE | 1.08 | 1.18 | 1.47 | 1.47 | 1.42 |
| NSE | 0.98 | 0.98 | 0.97 | 0.96 | 0.97 |
| Slope | 0.98 | 0.99 | 0.98 | 0.97 | 0.98 |
| Lake Name | Geometry Ratio (Secchi Depth) | % Hours or Days of Temperature Stratification | |||
| Ice Cover Period | Open Water Season | ||||
| Hourly Model | Daily Model | Hourly Model | Daily Model | ||
| Carrie | 3.12 (1.48 m) | 89 | 89 | 65 | 64 |
| Belle | 5.77 (1.46 m) | 86 | 80 | 37 | 35 |
| Pearl | 7.53 (1.85 m) | 93 | 81 | 80 | 67 |
| Portage | 7.71 (2.00 m) | 89 | 83 | 26 | 25 |
| Red Sand | 8.34 (3.04 m) | 90 | 89 | 32 | 16 |
| Lake Name | Geometry Ratio (Secchi Depth) | % Hours or Days of DO Stratification | |||
| Ice Cover Period | Open Water Season | ||||
| Hourly Model | Daily Model | Hourly Model | Daily Model | ||
| Carrie | 3.12 (1.48 m) | 75 | 66 | 58 | 71 |
| Belle | 5.77 (1.46 m) | 88 | 76 | 56 | 52 |
| Pearl | 7.53 (1.85 m) | 93 | 79 | 67 | 47 |
| Portage | 7.71 (2.00 m) | 89 | 67 | 48 | 38 |
| Red Sand | 8.34 (3.04 m) | 90 | 87 | 37 | 42 |
Publisher’s Note: MDPI stays neutral with regard to jurisdictional claims in published maps and institutional affiliations. |
© 2021 by the authors. Licensee MDPI, Basel, Switzerland. This article is an open access article distributed under the terms and conditions of the Creative Commons Attribution (CC BY) license (https://creativecommons.org/licenses/by/4.0/).
Share and Cite
Tasnim, B.; Jamily, J.A.; Fang, X.; Zhou, Y.; Hayworth, J.S. Simulating Diurnal Variations of Water Temperature and Dissolved Oxygen in Shallow Minnesota Lakes. Water 2021, 13, 1980. https://doi.org/10.3390/w13141980
Tasnim B, Jamily JA, Fang X, Zhou Y, Hayworth JS. Simulating Diurnal Variations of Water Temperature and Dissolved Oxygen in Shallow Minnesota Lakes. Water. 2021; 13(14):1980. https://doi.org/10.3390/w13141980
Chicago/Turabian StyleTasnim, Bushra, Jalil A. Jamily, **ng Fang, Yangen Zhou, and Joel S. Hayworth. 2021. "Simulating Diurnal Variations of Water Temperature and Dissolved Oxygen in Shallow Minnesota Lakes" Water 13, no. 14: 1980. https://doi.org/10.3390/w13141980