
Artificial and Natural Water Bodies Change in China, 2000–2020

 , ,
, ,
Abstract
:1. Introduction
2. Materials and Methods
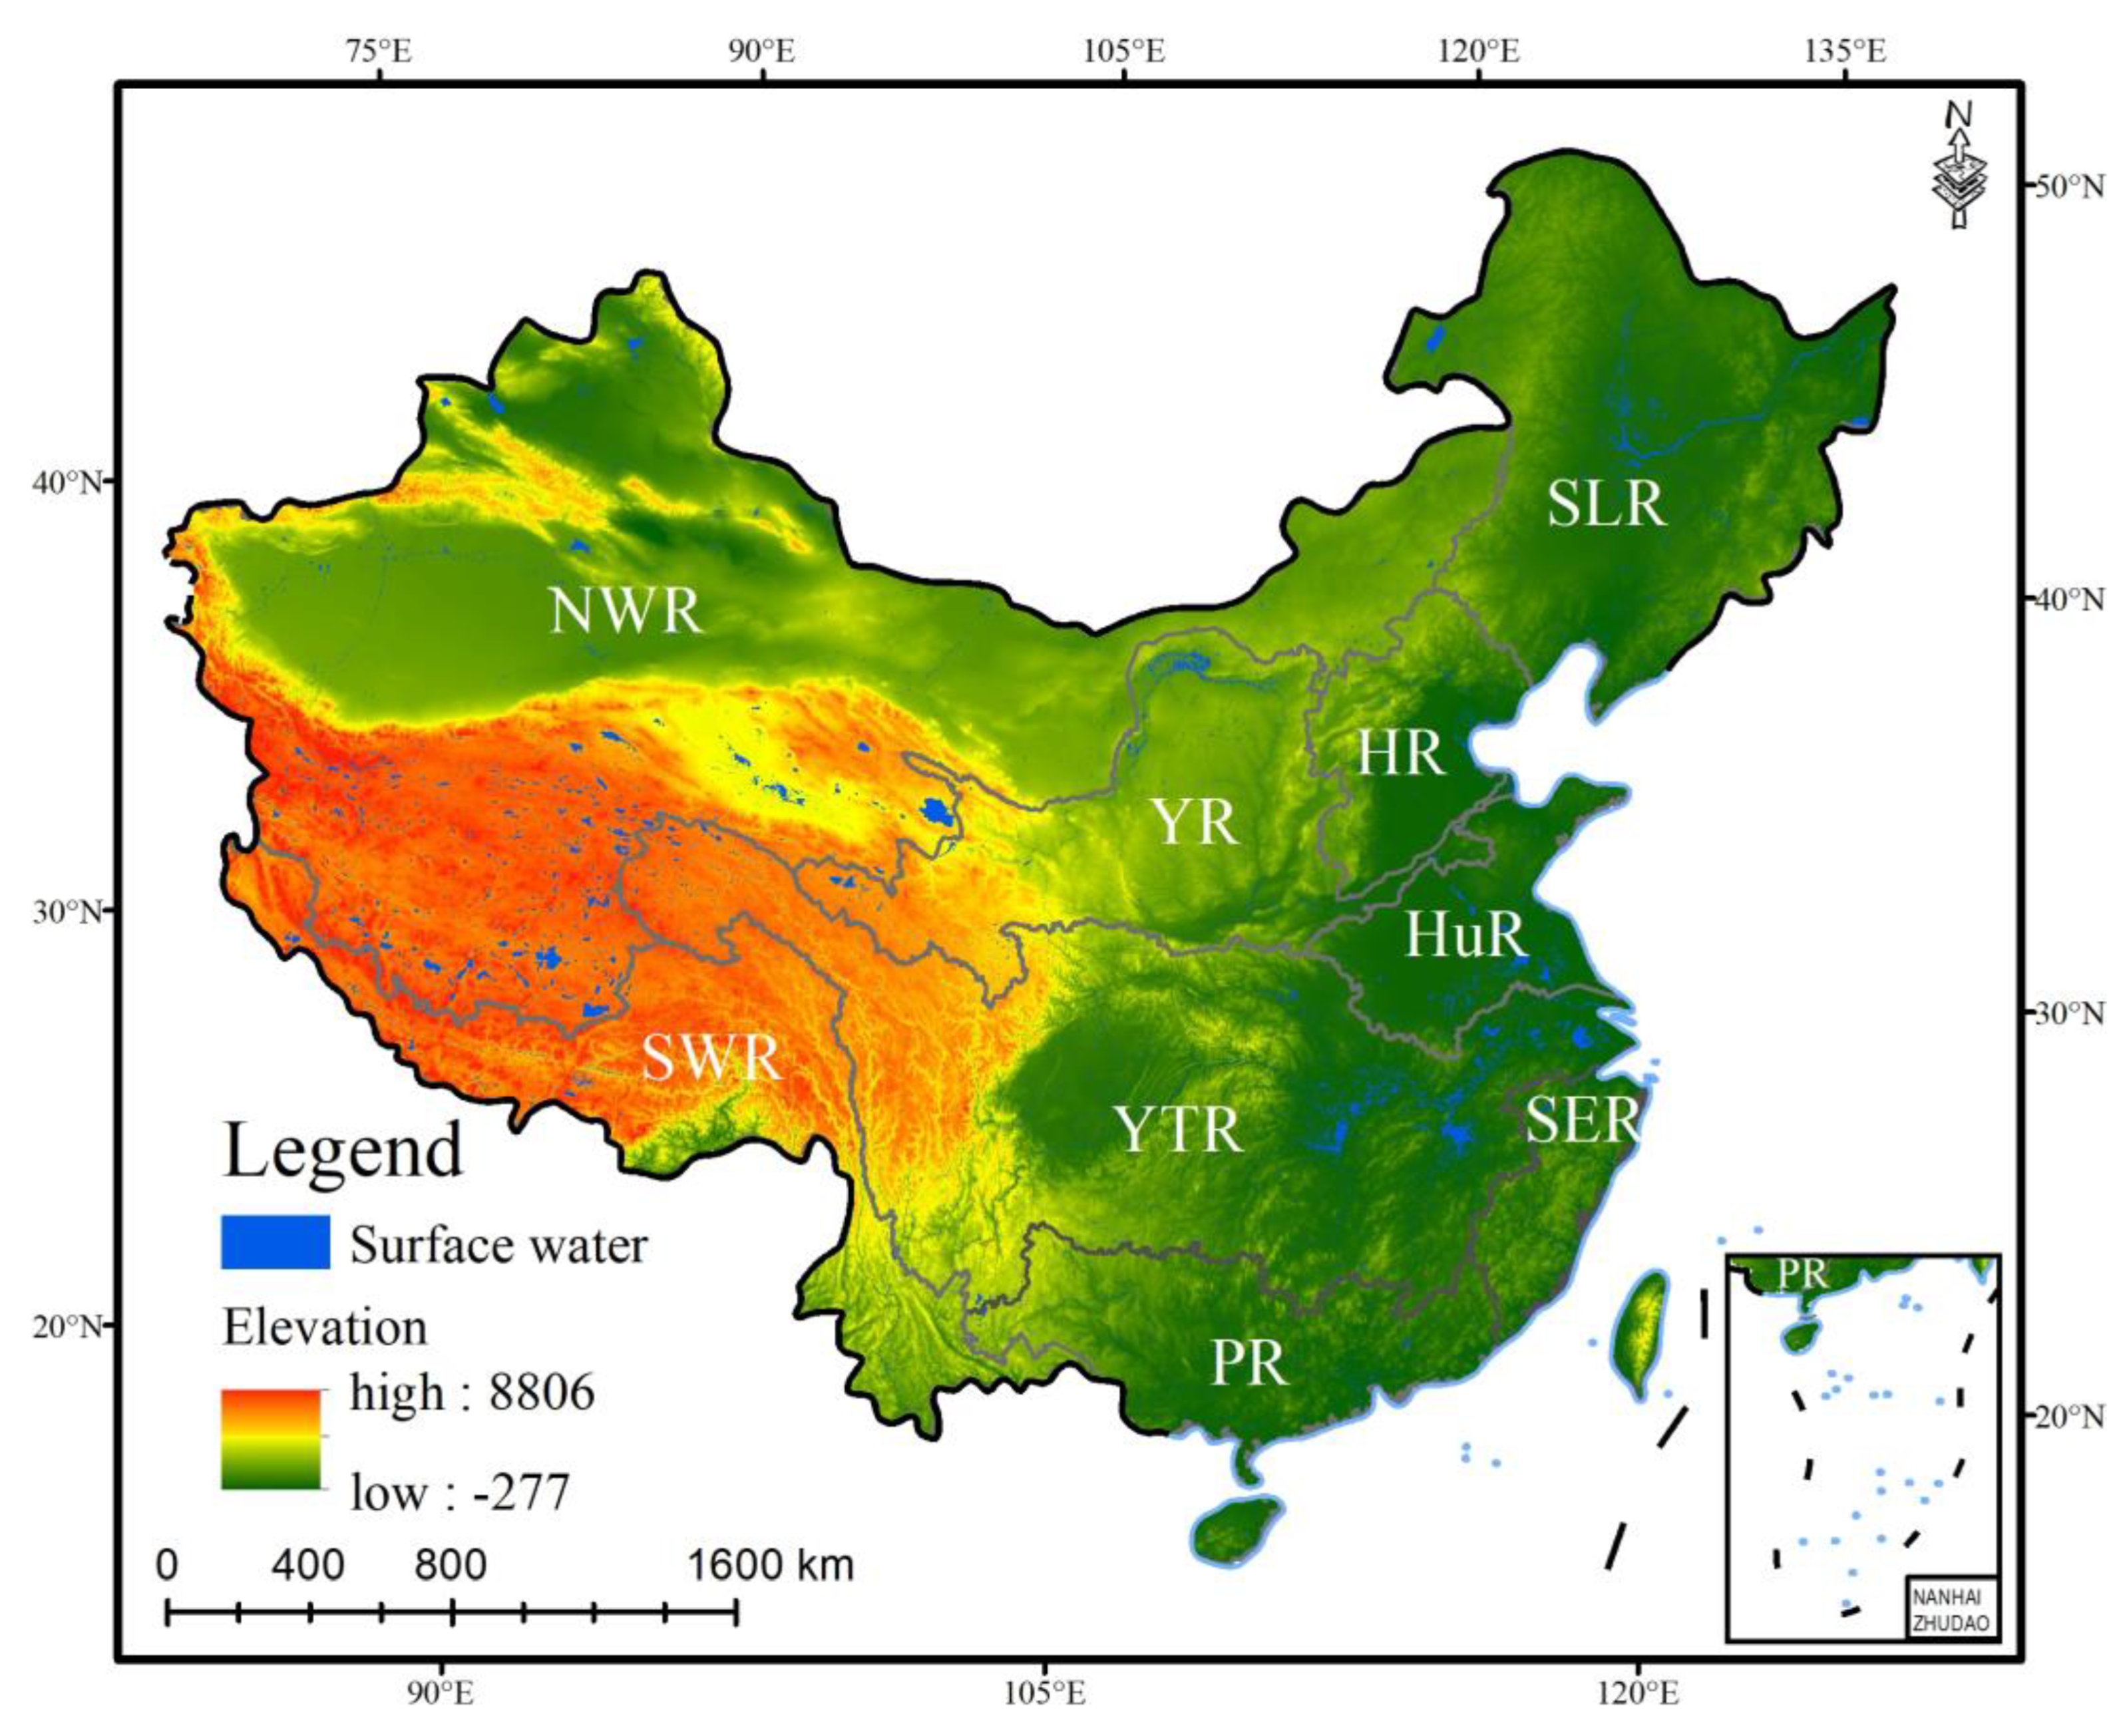
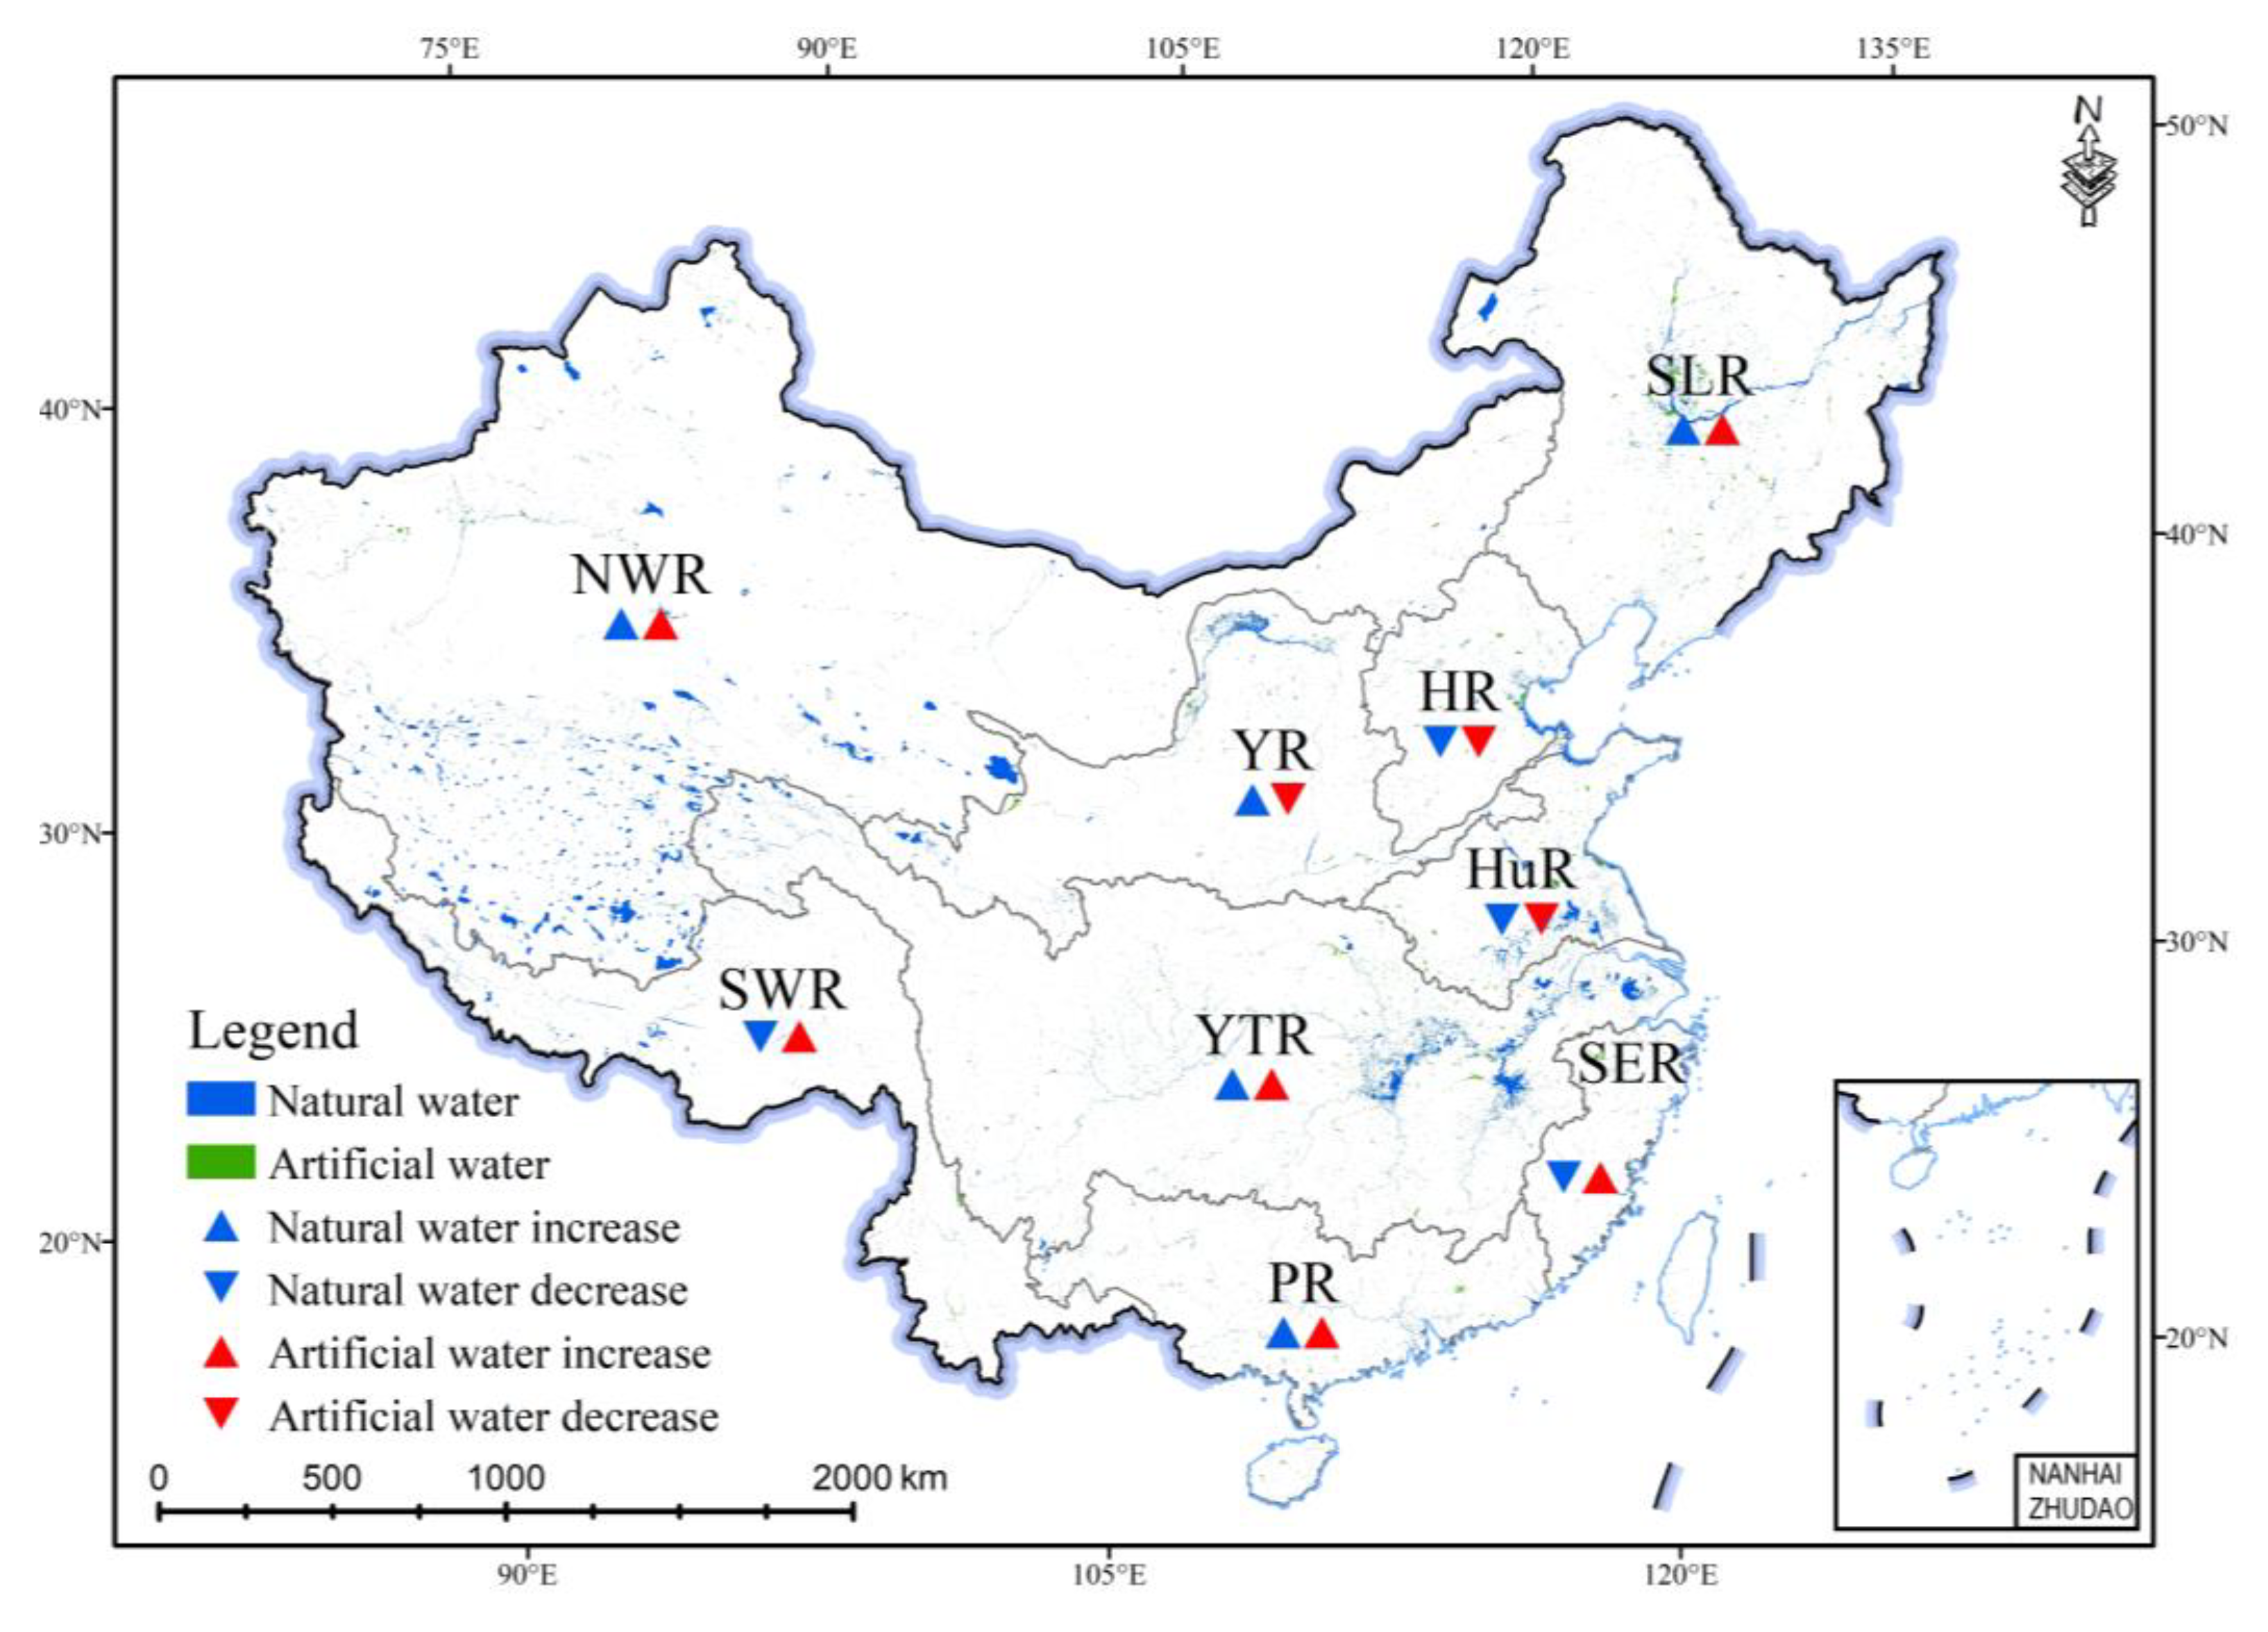
2.1. Study Area
2.2. Data Sources
- (1)
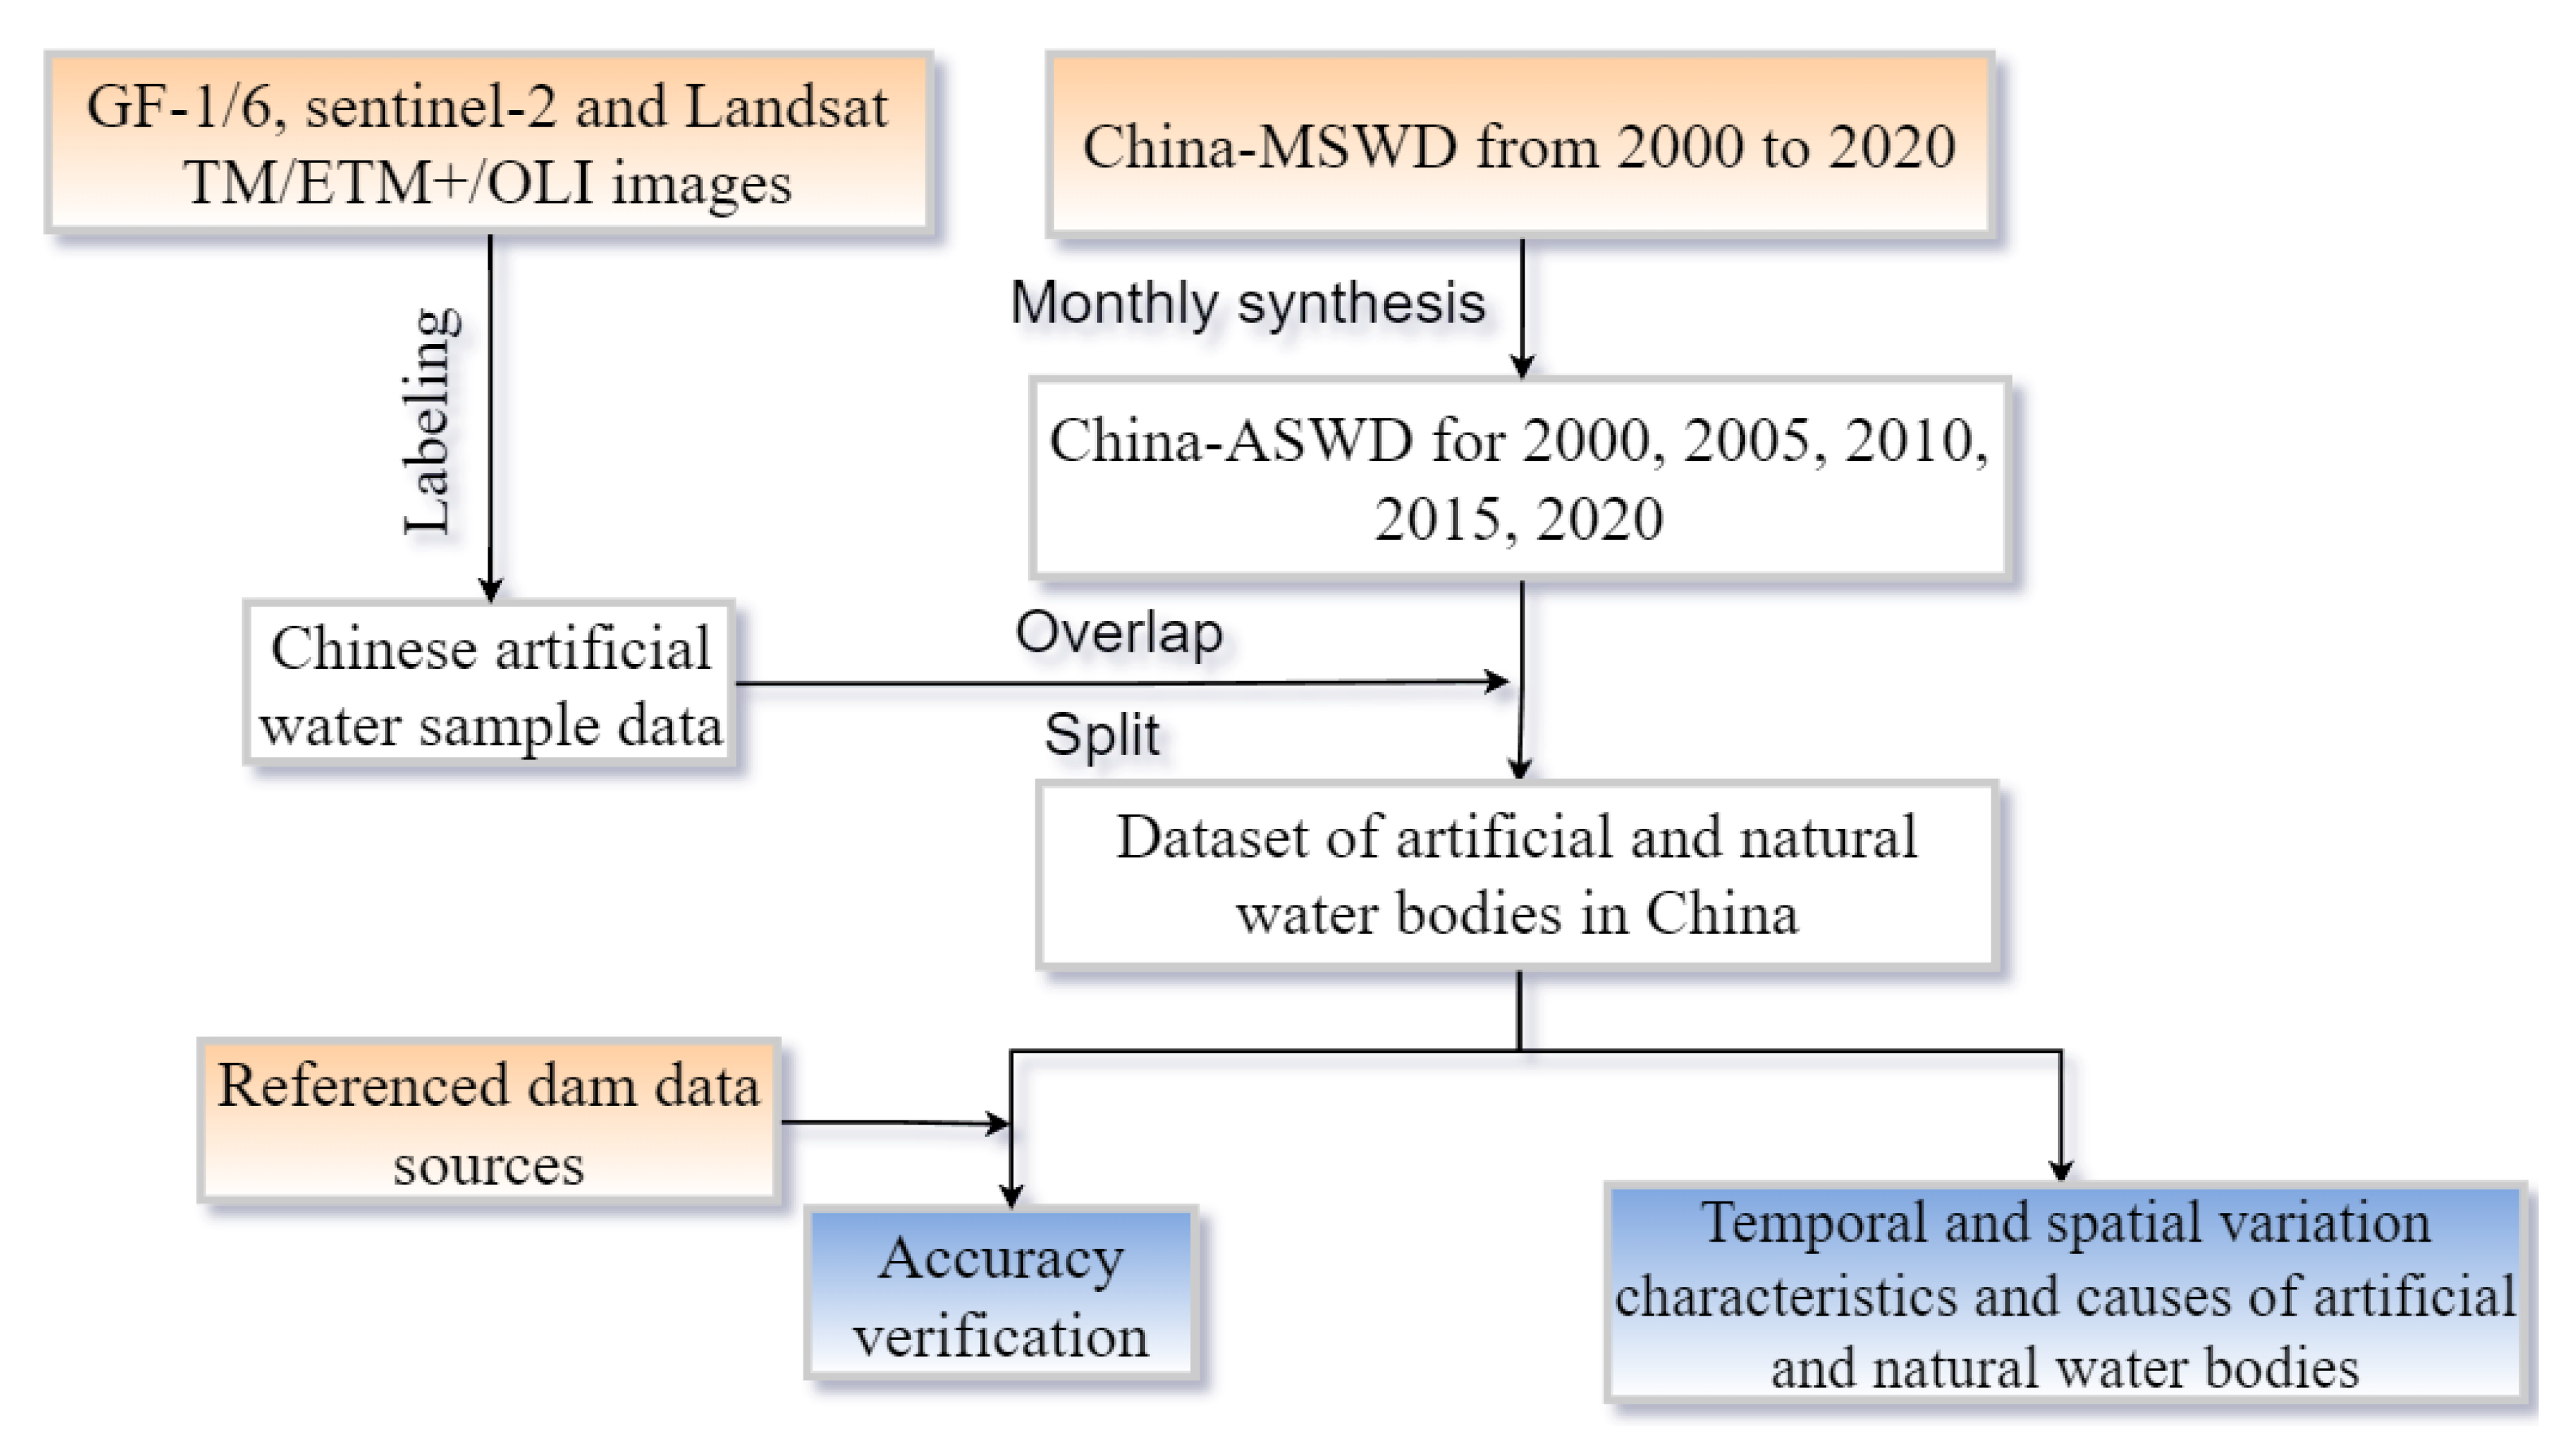
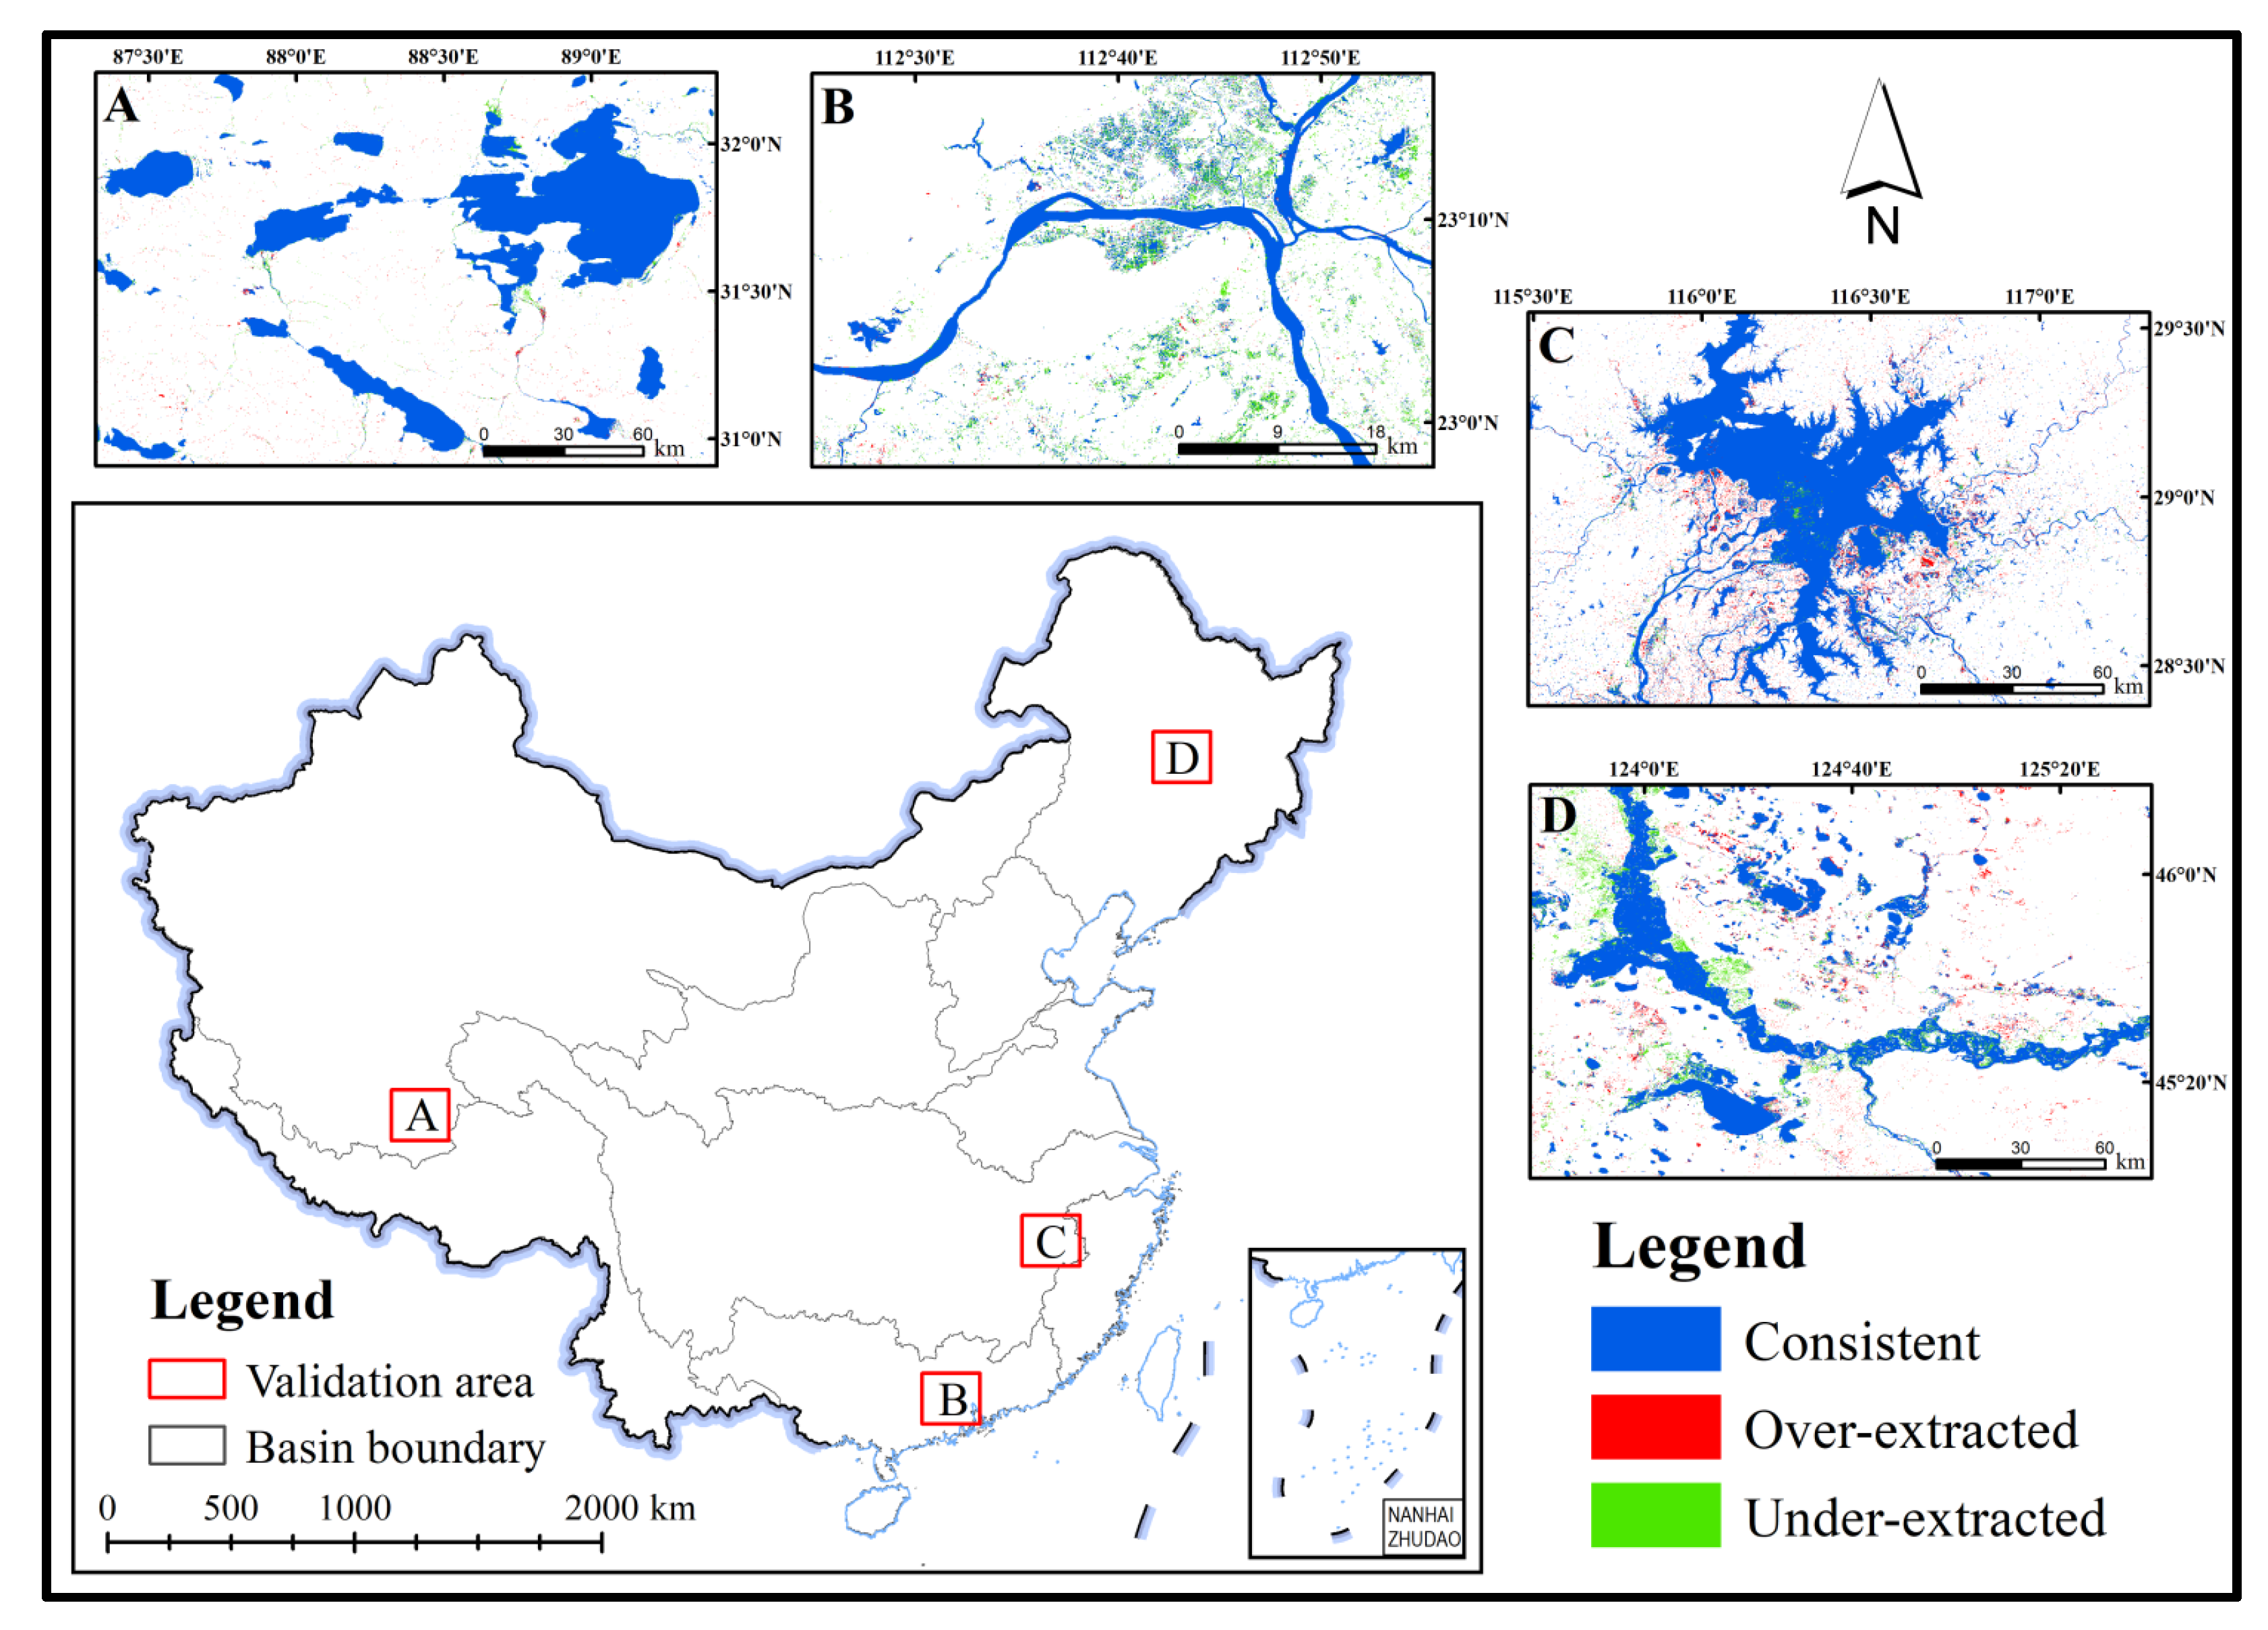
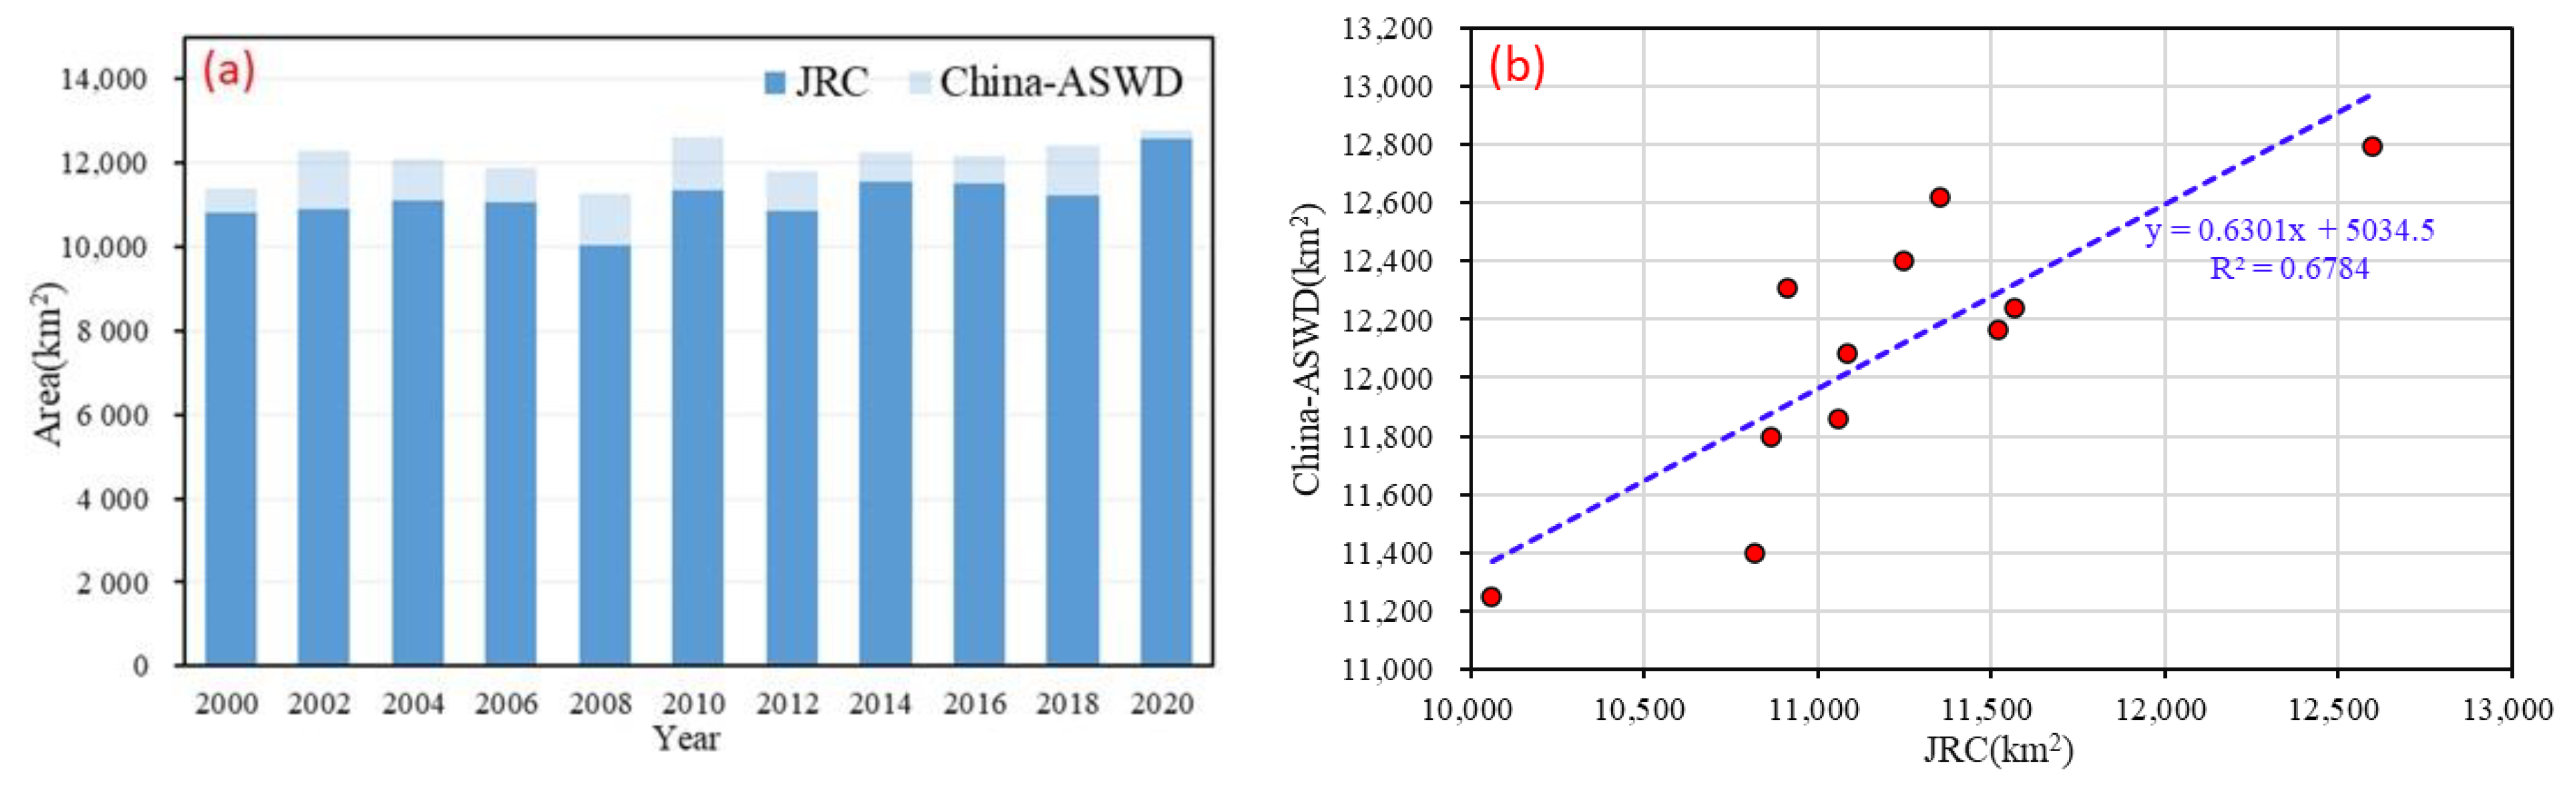
- Surface water remote sensing monitoring data. The surface water data are derived from the monthly surface water distribution data set (2000–2020) extracted from Landsat TM/ETM+/OLI imagery by our research team [44]. The European Commission’s Joint Research Centre (JRC) global water surface distribution data (JRC Yearly Water Classification History, v1.3) from Google Earth Engine (GEE) was used for comparative validation.
- (2)
- Sample data for artificial water body distribution. Based on GF-1/6, sentinel-2 and Landsat TM/ETM+/OLI images taken in 2019 and 2020, 45,585 artificial water body location points were manually annotated by visual interpretation.
- (3)
- Dam latitude and longitude coordinate data. These mainly include China-IWRHR: dam location data provided by the China Institute of Water Resources and Hydropower Research; China-LDRL: the China Open Data Set on Large Dams, Reservoirs and Lakes developed and freely shared by Wang et al. [39]; GRanD v1.3: the Global Reservoir and Dam Database curated and hosted by Global Dam Watch [45]; and AQUASTAT: a global georeferenced database of dams collected by the Food and Agriculture Organization of the United Nations (FAO) global information system on water resources and agricultural water management [46].
2.3. Methodology
- (1)
- Synthesis of annual water surface data sets
- (2)
- Classification of artificial and natural water bodies
- (3)
- Construction of artificial and natural water body change indicators
- (4)
- Spatial and temporal variation characteristics and causes of artificial and natural water bodies
3. Results
3.1. Accuracy Evaluation
3.1.1. Accuracy Evaluation of Surface Water Data Sets
3.1.2. Accuracy Verification of Artificial Water Body Data Set
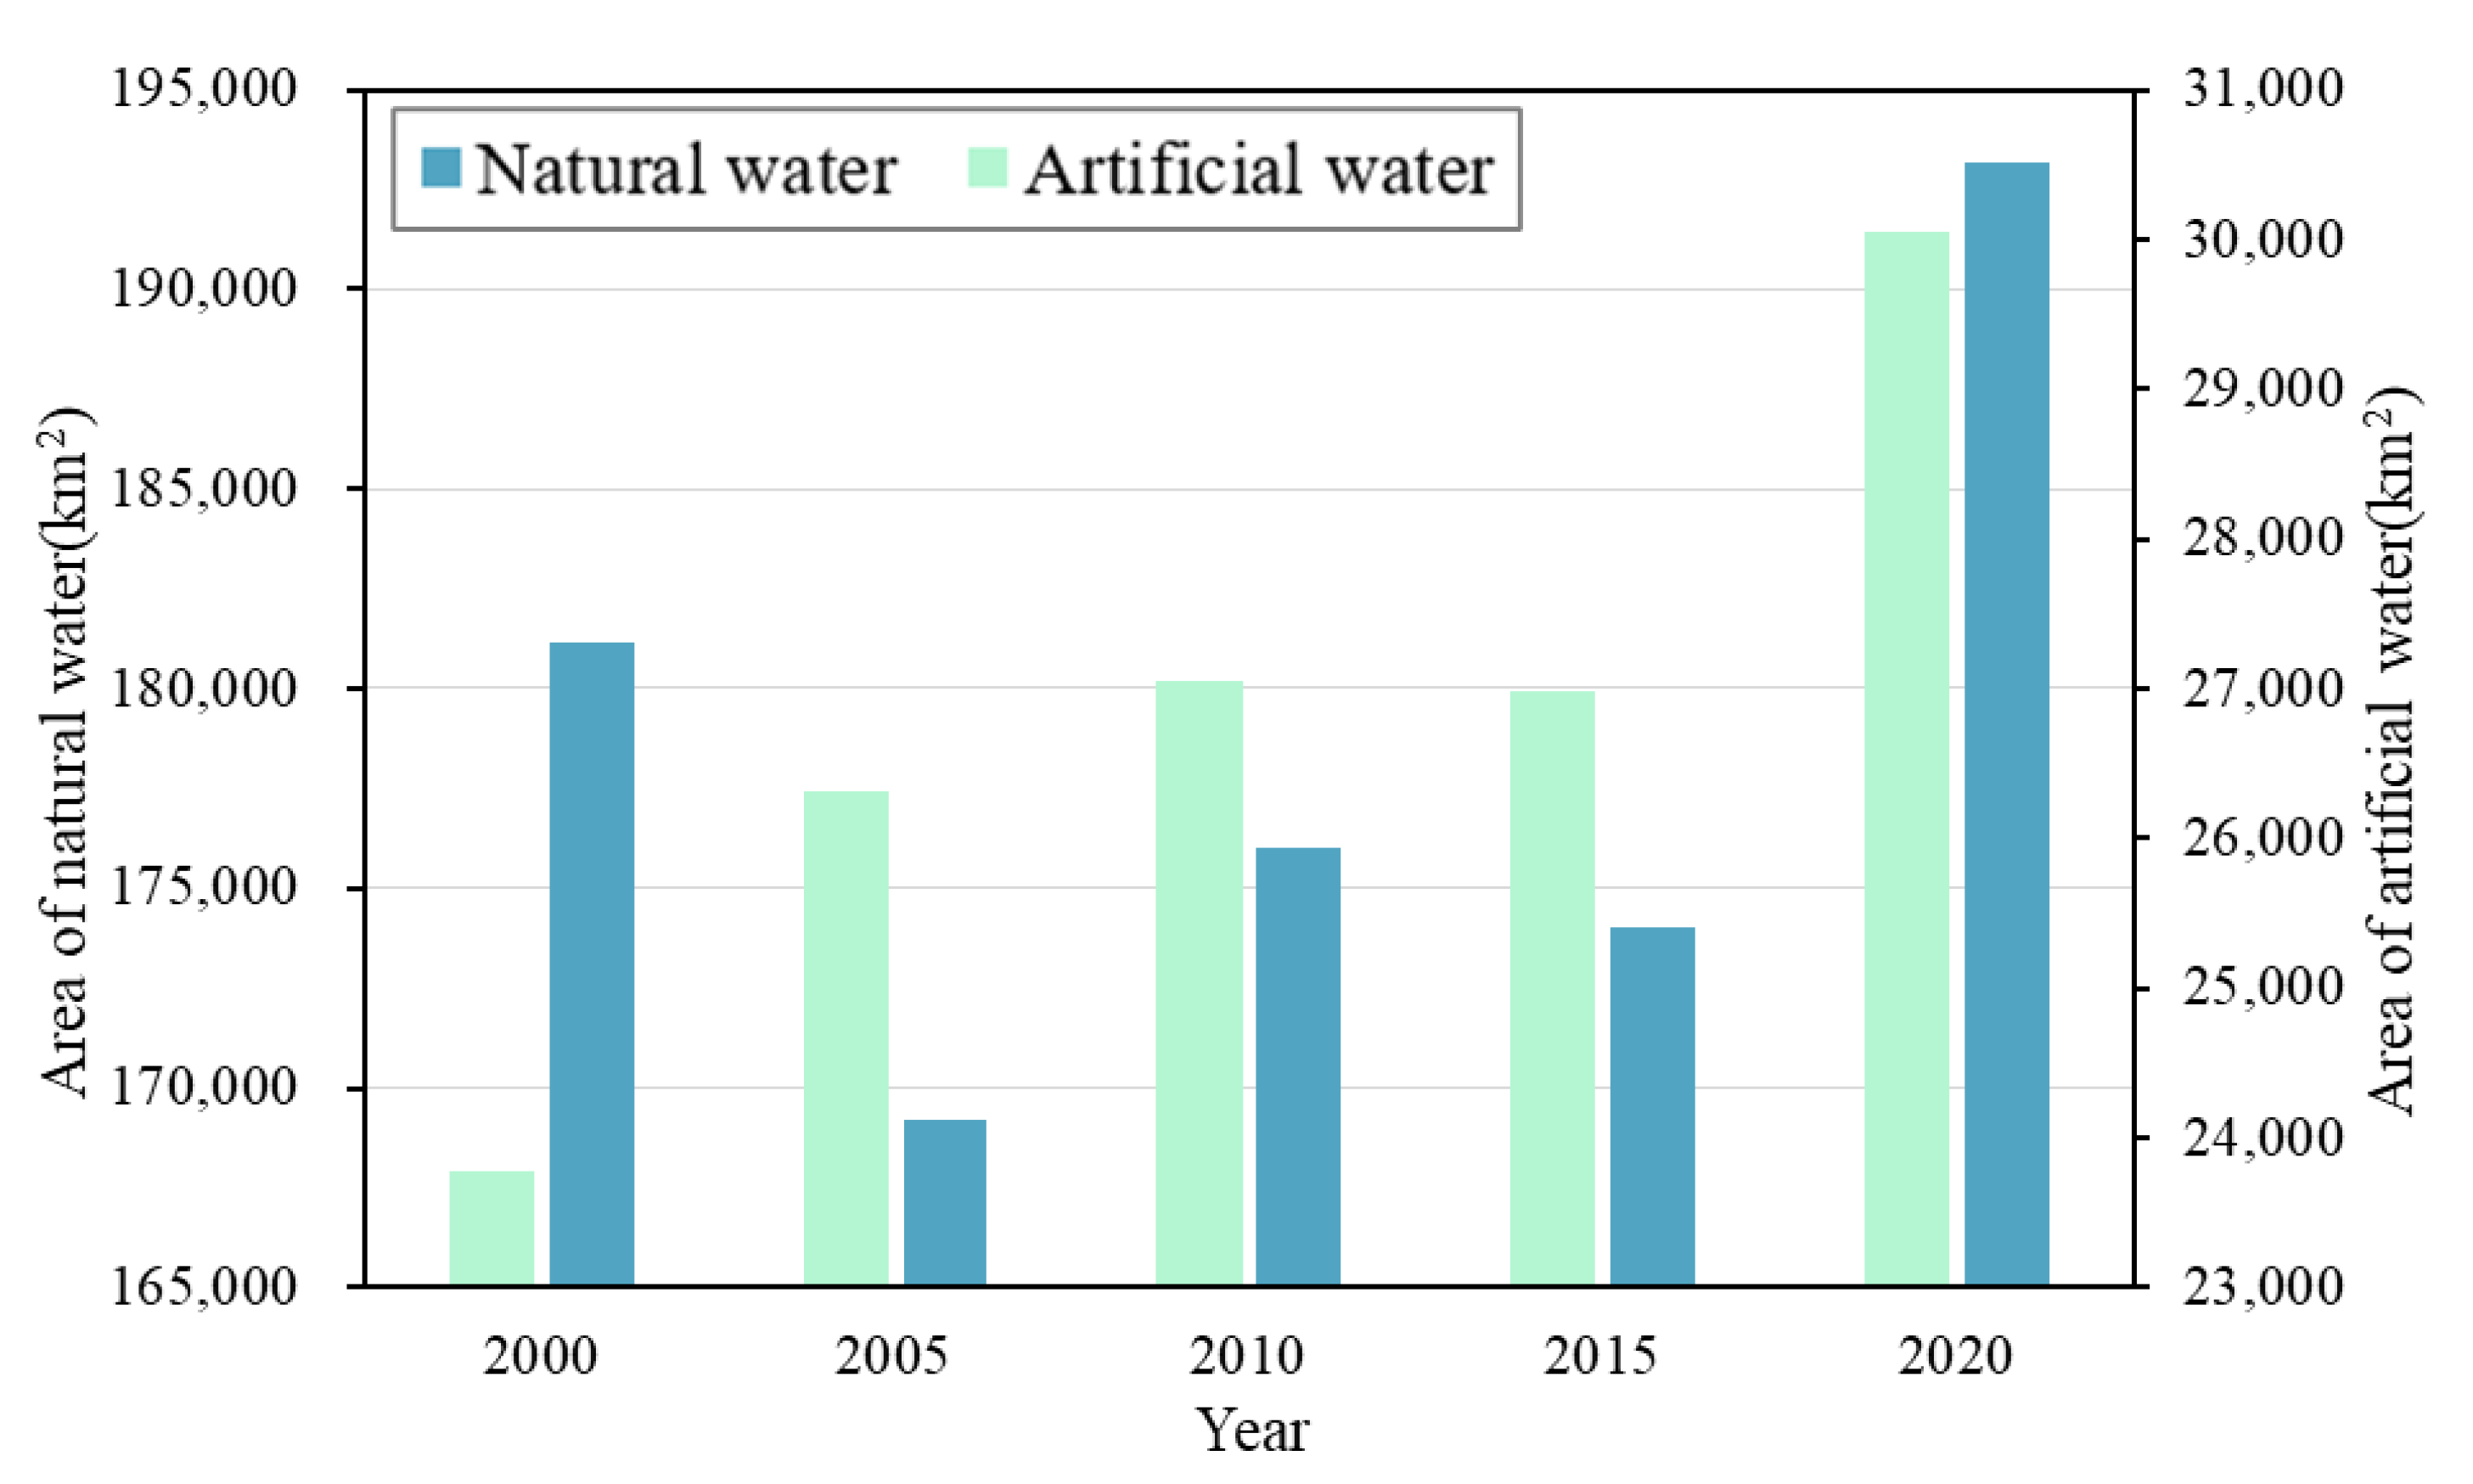
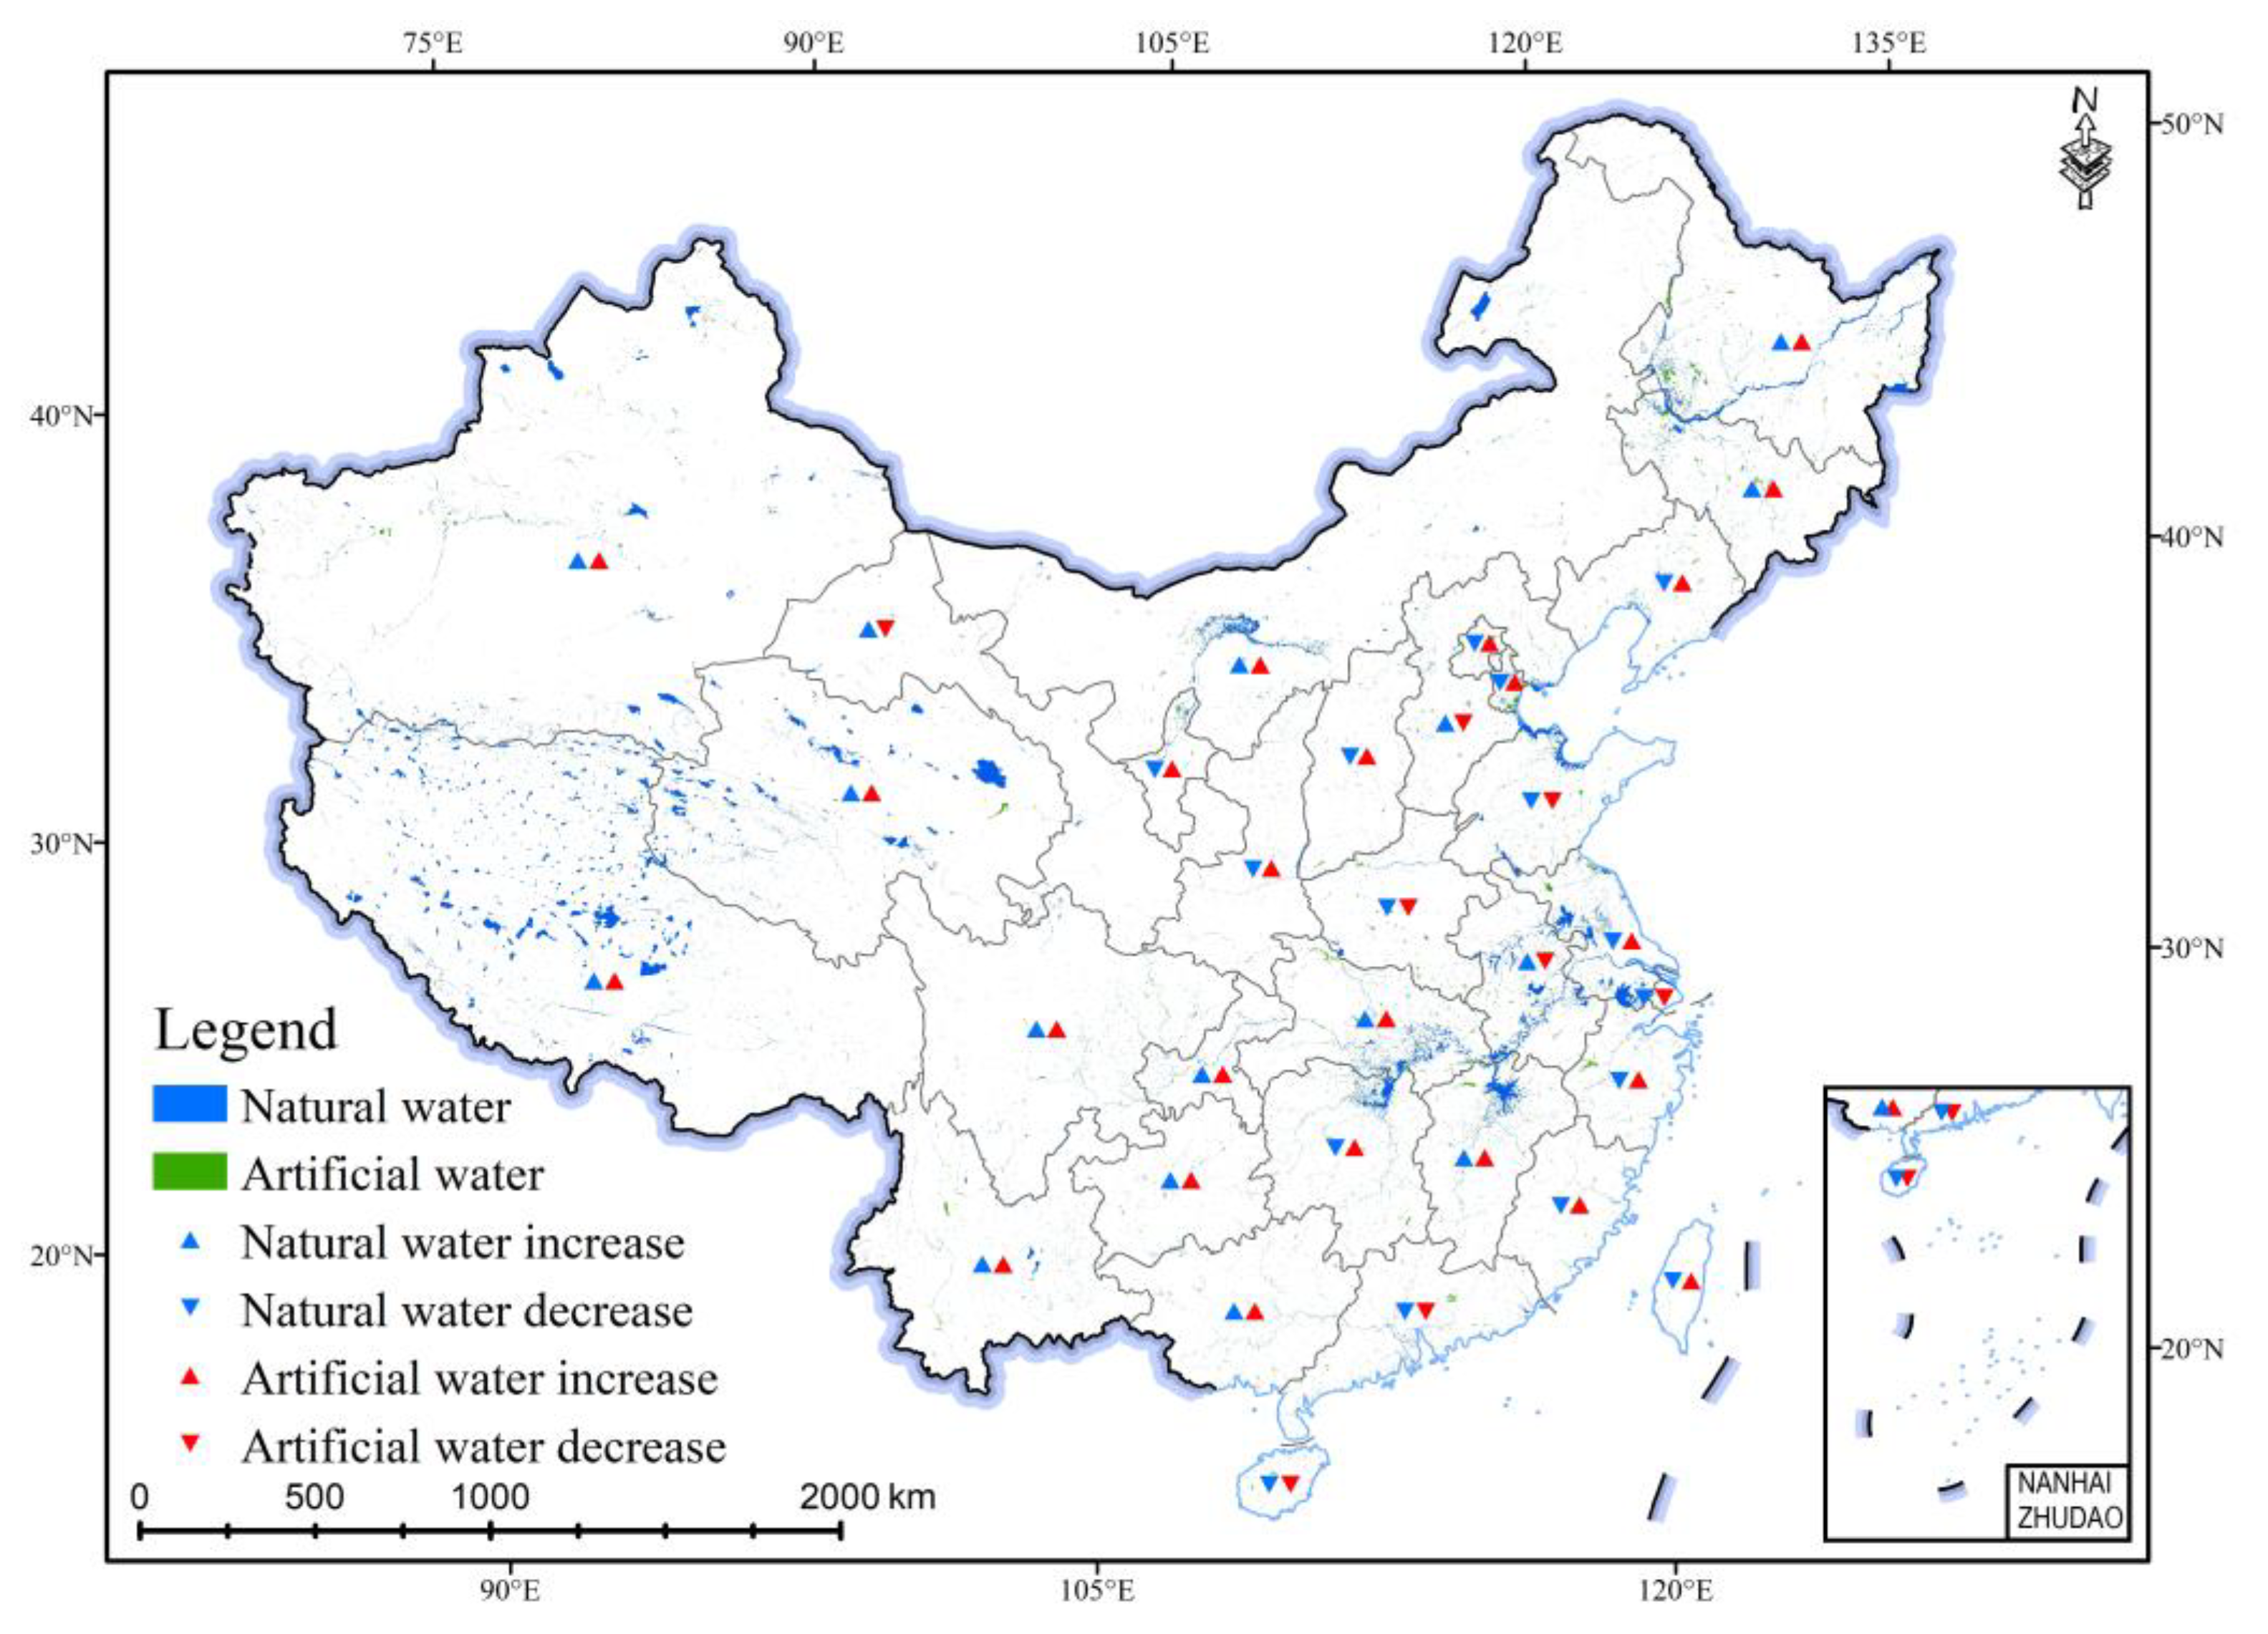
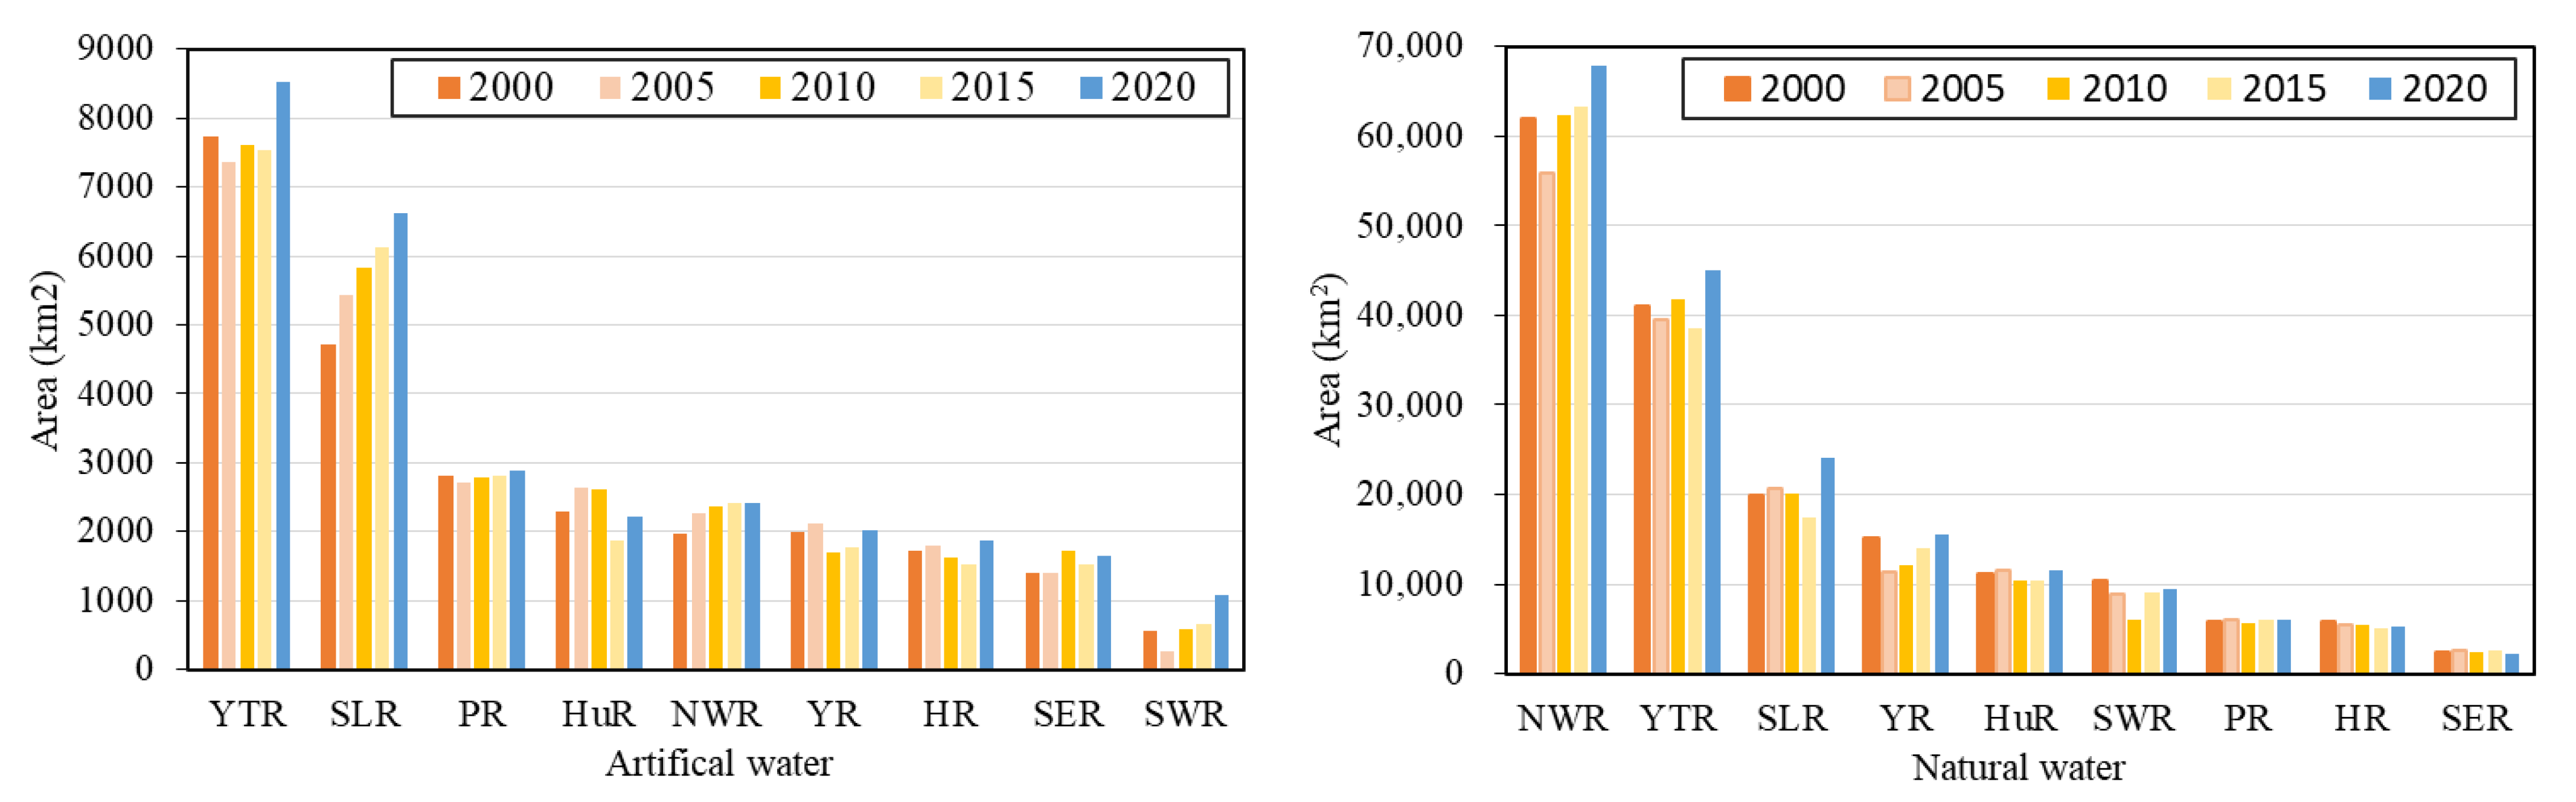
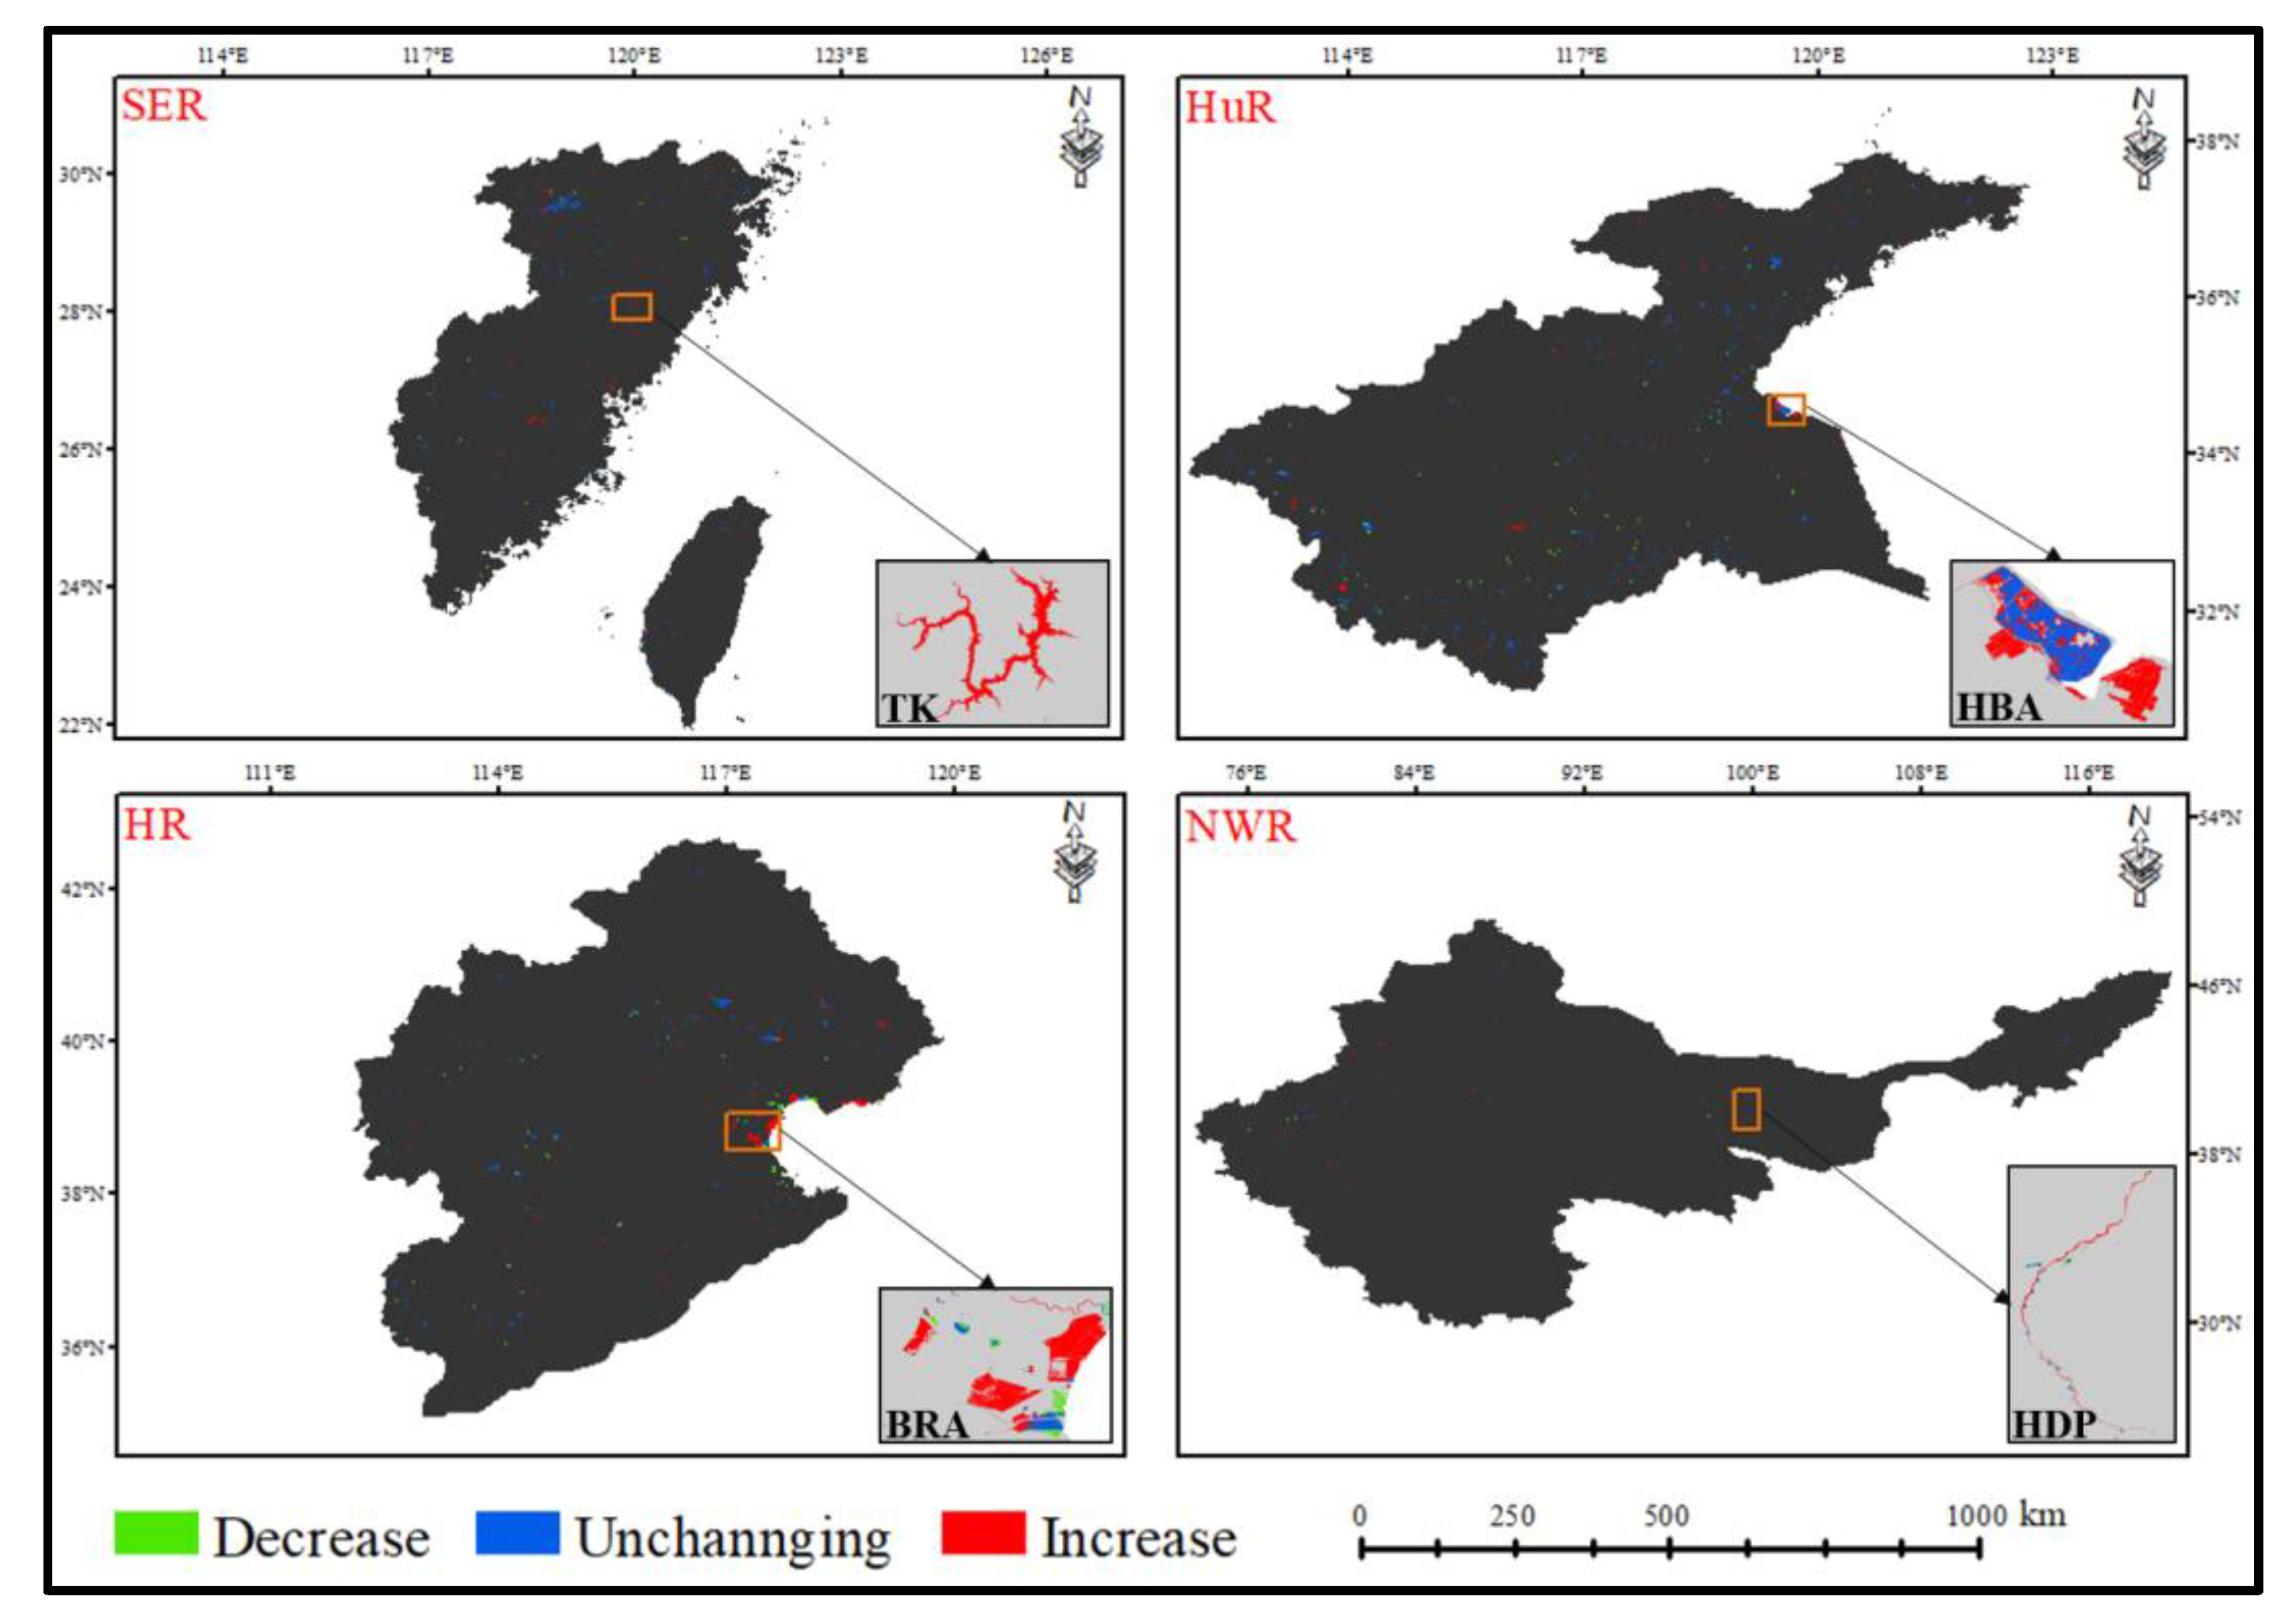
3.2. Spatial and Temporal Evolution of Artificial and Natural Water Bodies
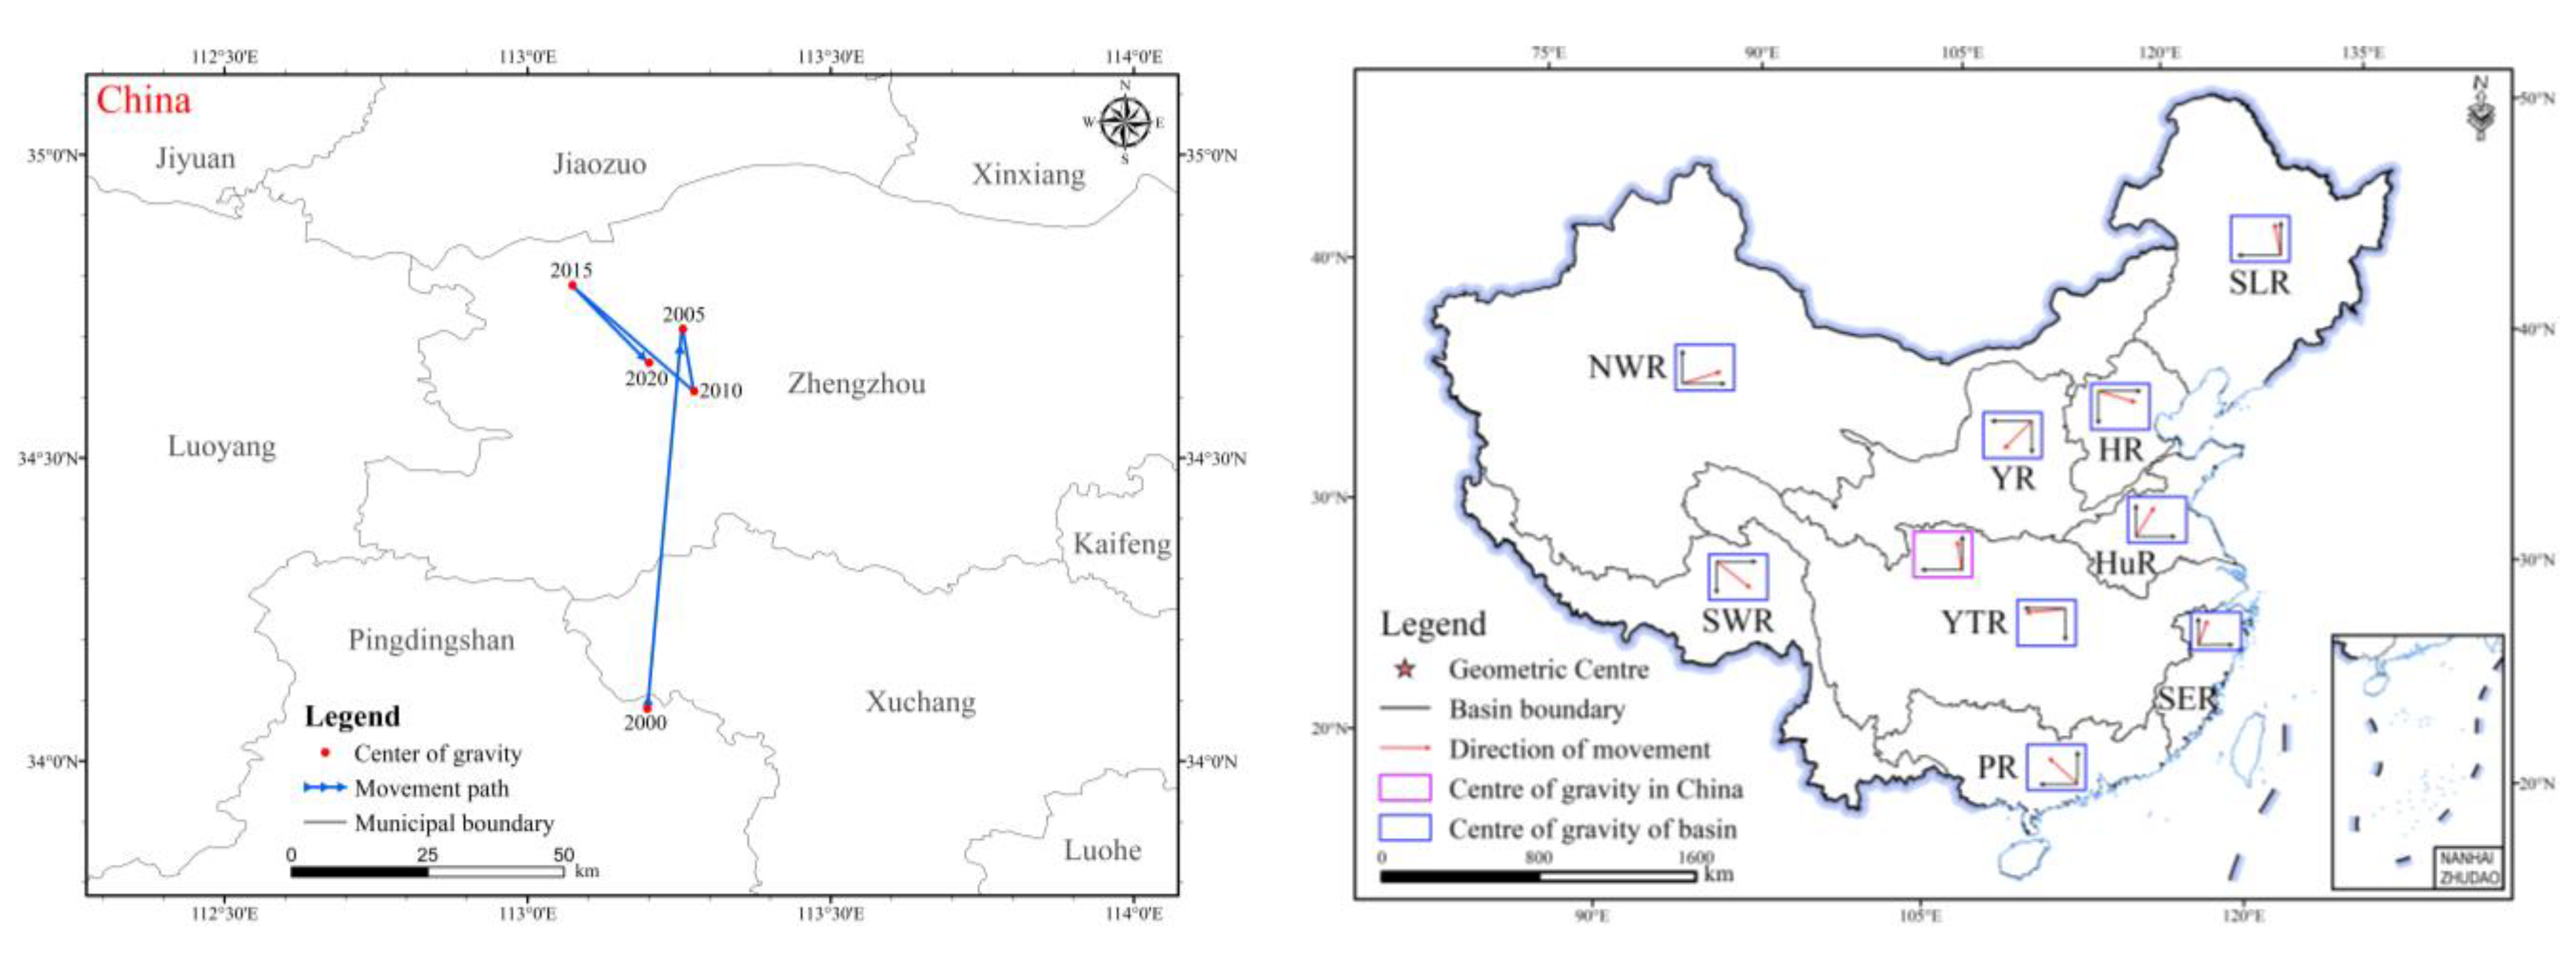
3.3. Changes in the Geometric Center of Gravity of Artificial Water Bodies
4. Discussion
4.1. Reasons for Changes in the Center of Gravity of the Distribution of Artificial Water Bodies in Typical Basins
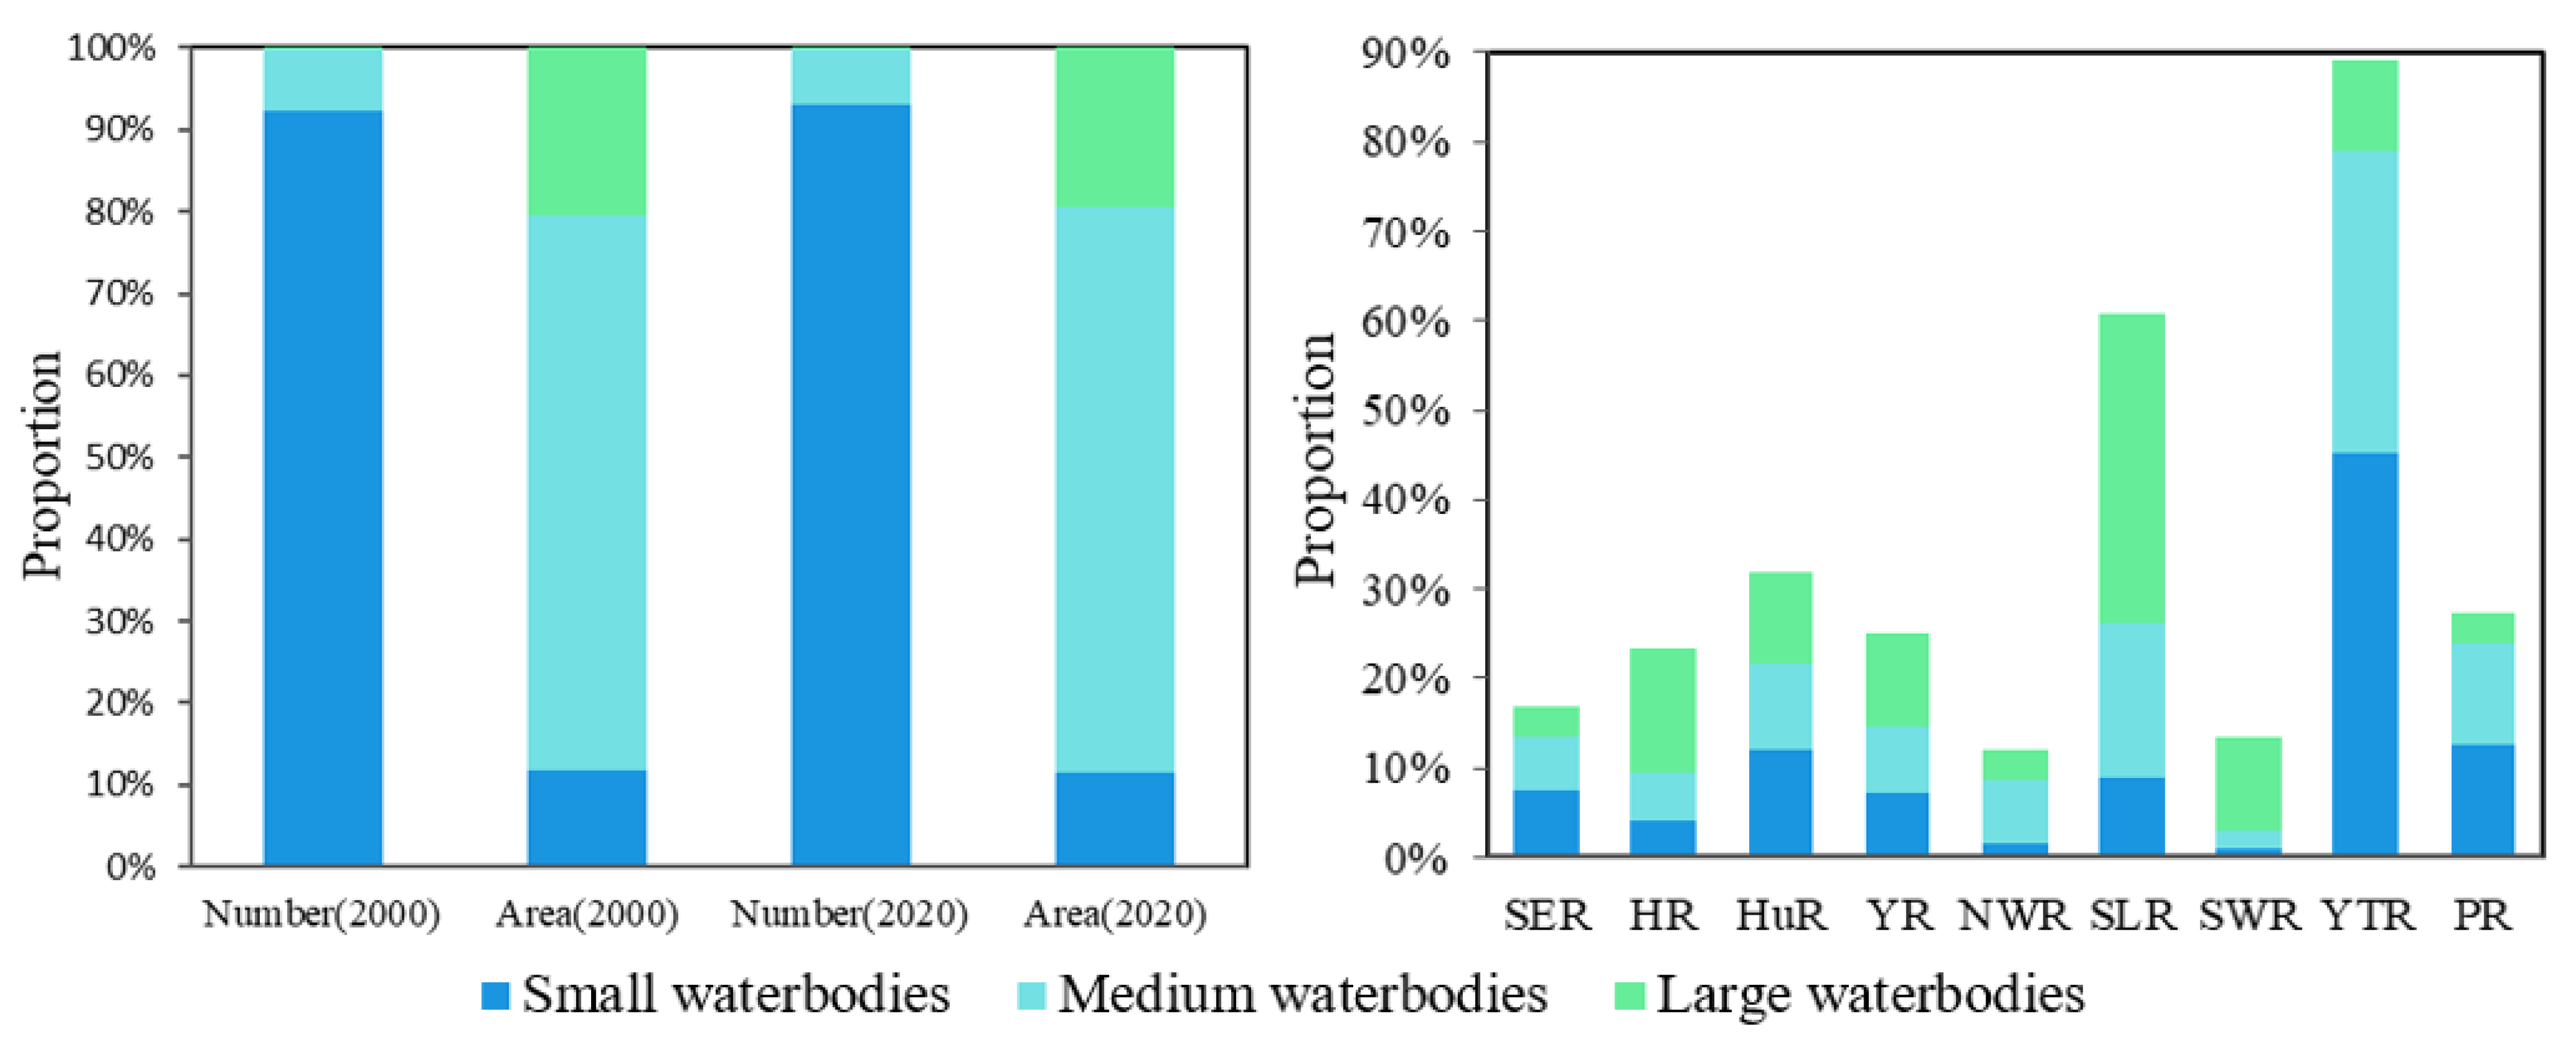
4.2. The Impact of Small and Medium-Sized Water Projects on Changes in the Distribution of Artificial Water Bodies
4.3. Outlooks, Implications and Limitations
5. Conclusions
Supplementary Materials
Author Contributions
Funding
Institutional Review Board Statement
Informed Consent Statement
Data Availability Statement
Acknowledgments
Conflicts of Interest
References
- Tulbure, M.G.; Broich, M.; Stehman, S.V.; Kommareddy, A. Surface water extent dynamics from three decades of seasonally continuous Landsat time series at subcontinental scale in a semi-arid region. Remote Sens. Environ. 2016, 178, 142–157. [Google Scholar] [CrossRef]
- Ferguson, I.M.; Maxwell, R.M. Human impacts on terrestrial hydrology: Climate change versus pum** and irrigation. Environ. Res. Lett. 2012, 7, 044022. [Google Scholar] [CrossRef] [Green Version]
- Pekel, J.F.; Cottam, A.; Gorelick, N.; Belward, A.S. High-resolution map** of globasurface water and its long-term changes. Nature 2016, 540, 418–422. [Google Scholar] [CrossRef] [PubMed]
- United Nations Environment Programme. Progress on Freshwater Ecosystems: Tracking SDG 6 Series—Global Indicator 6.6.1 Updates and Acceleration Needs. 2021. Available online: https://www.unwater.org/publications/progress-on-water-related-ecosystems-661-2021-update/ (accessed on 20 April 2022).
- Hayes, N.M.; Deemer, B.R.; Corman, J.R.; Razavi, N.R.; Strock, K.E. Key differences between lakes and reservoirs modify climate signals: A case for a new conceptual model. Limnol. Oceanogr. Lett. 2017, 2, 47–62. [Google Scholar] [CrossRef]
- ** effects of plain reservoir artificial islands based on MIKE21 SW model. Water Sci. Eng. 2019, 12, 179–187. [Google Scholar] [CrossRef]
- Wang, X.; ** Based on Landsat and Sentinel-1 Images. Water 2022, 14, 1454. [Google Scholar] [CrossRef]
- Lehner, B.; Liermann, C.R.; Revenga, C.; Vörösmarty, C.; Fekete, B.; Crouzet, P.; Döll, P.; Endejan, M.; Frenken, K.; Magome, J.; et al. High-resolution map** of the world’s reservoirs and dams for sustainable river-flow management. Front. Ecol. Environ. 2011, 9, 494–502. [Google Scholar] [CrossRef] [Green Version]
- Rufin, P.; Levers, C.; Baumann, M.; Jägermeyr, J.; Krueger, T.; Kuemmerle, T.; Hostert, P. Global-scale patterns and determinants of crop** frequency in irrigation dam command areas. Glob. Environ. Change 2018, 50, 110–122. [Google Scholar] [CrossRef]
- Duan, Y.; Tian, B.; Li, X.; Liu, D.; Sengupta, D.; Wang, Y.; Peng, Y. Tracking changes in aquaculture ponds on the China coast using 30 years of Landsat images. Int. J. Appl. Earth Obs. Geoinf. 2021, 102, 102383. [Google Scholar] [CrossRef]
- Chin, A.; Laurencio, L.R.; Martinez, A.E. The hydrologic importance of small-and medium-sized dams: Examples from Texas. Prof. Geogr. 2008, 60, 238–251. [Google Scholar] [CrossRef]
- Ayalew, T.B.; Krajewski, W.F.; Mantilla, R.; Wright, D.B.; Small, S.J. Effect of spatially distributed small dams on flood frequency: Insights from the soap creek watershed. J. Hydrol. Eng. 2017, 22, 04017011. [Google Scholar] [CrossRef]
- Messager, M.L.; Lehner, B.; Grill, G.; Nedeva, I.; Schmitt, O. Estimating the volume and age of water stored in global lakes using a geo-statistical approach. Nat. Commun. 2016, 7, 13603. [Google Scholar] [CrossRef]
- Bulletin of First National Census for Water. Available online: http://slpc.mwr.gov.cn/gbzq/ (accessed on 28 April 2022).
- Graf, W.L. Geomorphology and American dams: The scientific, social, and economic context. Geomorphology 2005, 71, 3–26. [Google Scholar] [CrossRef]
- Zhao, Q.; Liu, S.; Deng, L.; Dong, S.; Yang, Z.; Yang, J. Landscape change and hydrologic alteration associated with dam construction. International J. Appl. Earth Obs. Geoinf. 2012, 16, 17–26. [Google Scholar] [CrossRef]
- Costigan, K.H.; Daniels, M.D. Damming the prairie: Human alteration of Great Plains river regimes. J. Hydrol. 2012, 444, 90–99. [Google Scholar] [CrossRef]
- McManamay, R.A.; Orth, D.J.; Dolloff, C.A. Revisiting the homogenization of dammed rivers in the southeastern US. J. Hydrol. 2012, 424, 217–237. [Google Scholar] [CrossRef] [Green Version]
- Piégay, H.; Gregory, K.J.; Bondarev, V.; Chin, A.; Dahlstrom, N.; Elosegi, A.; Gregory, S.V.; Joshi, V.; Mutz, M.; Rinaldi, M.; et al. Public perception as a barrier to introducing wood in rivers for restoration purposes. Environ. Manag. 2005, 36, 665–674. [Google Scholar] [CrossRef] [PubMed]
- Ferreira, S.; Meunier, S.; Heinrich, M.; Cherni, J.A.; Darga, A.; Quéval, L. A decision support tool to place drinking water sources in rural communities. Sci. Total Environ. 2022, 833, 155069. [Google Scholar] [CrossRef]
- Magilligan, F.J.; Graber, B.E.; Nislow, K.H.; Chipman, J.W.; Sneddon, C.S.; Fox, C.A. River restoration by dam removal: Enhancing connectivity at watershed scalesRiver restoration by dam removal. Elem. Sci. Anthr. 2016, 4, 000108. [Google Scholar] [CrossRef] [Green Version]
- **g, M.; Jie, Y.; Shou-yi, L.; Lu, W. Application of fuzzy analytic hierarchy process in the risk assessment of dangerous small-sized reservoirs. Int. J. Mach. Learn. Cybern. 2018, 9, 113–123. [Google Scholar] [CrossRef]
- Measuring Changes in Reservoir Surface Area. Available online: https://www.sdg661.app/productsmethods (accessed on 21 May 2022).
- Howard Coker, E.; Hotchkiss, R.H.; Johnson, D.A. Conversion of a Missouri River Dam and Reservoir to a Sustainable System: Sediment Management 1. JAWRA J. Am. Water Resour. Assoc. 2009, 45, 815–827. [Google Scholar] [CrossRef]
- Biggs, J.; Von Fumetti, S.; Kelly-Quinn, M. The importance of small waterbodies for biodiversity and ecosystem services: Implications for policy makers. Hydrobiologia 2017, 793, 3–39. [Google Scholar] [CrossRef]
- Cantonati, M.; Poikane, S.; Pringle, C.M.; Stevens, L.E.; Turak, E.; Heino, J.; Richardson, J.S.; Bolpagni, R.; Borrini, A.; Cid, N.; et al. Characteristics, main impacts, and stewardship of natural and artificial freshwater environments: Consequences for biodiversity conservation. Water 2020, 12, 260. [Google Scholar] [CrossRef] [Green Version]


| Region | JRC (km2) | Consistent (km2) | Under-Extracted (km2) | Over-Extracted (km2) | Matching Rate (%) |
|---|---|---|---|---|---|
| A | 4686.81 | 4548.55 | 138.26 | 100.76 | 97.05 |
| B | 252.91 | 230.82 | 22.08 | 9.00 | 91.27 |
| C | 4431.94 | 4314.65 | 117.29 | 415.96 | 97.35 |
| D | 3174.11 | 2964.07 | 210.04 | 316.86 | 93.38 |
| Data Set | Total Dams | Dams in China | Matching Dams | Precision | Average Precision |
|---|---|---|---|---|---|
| China-IWRHR | 4662 | 4662 | 4200 | 90.1% | 89.5% |
| China-LDRL | 2140 | 2140 | 1830 | 85.5% | |
| GRanD v1.3 | 7320 | 921 | 831 | 90.2% | |
| AQUASTAT | 14,500 | 722 | 666 | 92.2% |
| MK Test Parameters | Artificial Water | Natural Water |
|---|---|---|
| Kendall’s tau | 0.800 | 0.200 |
| p-value | 0.086 | 0.806 |
| Alpha(α) | 0.10 | 0.10 |
| H0 | Reject | Accept |
| MK null hypothesis H0: There is no trend in the series. | ||
| Region | Type | (km2) | (km2) | |
|---|---|---|---|---|
| SER | Artificial | 1404.79 | 1586.99 | 13.0 |
| Natural | 2459.98 | 2411.52 | −2.0 | |
| HR | Artificial | 1757.57 | 1701.03 | −3.2 |
| Natural | 5684.63 | 5220.06 | −8.2 | |
| HuR | Artificial | 2459.65 | 2047.92 | −16.7 |
| Natural | 11,383.76 | 10,980.19 | −3.5 | |
| YR | Artificial | 2056.57 | 1901.43 | −7.5 |
| Natural | 13,259.74 | 14,751.92 | 11.3 | |
| NWR | Artificial | 2124.99 | 2409.33 | 13.4 |
| Natural | 58,971.60 | 65,569.37 | 11.2 | |
| SLR | Artificial | 5072.70 | 6370.03 | 25.6 |
| Natural | 20,320.17 | 20,726.47 | 2.0 | |
| SWR | Artificial | 416.11 | 859.98 | 106.7 |
| Natural | 9683.71 | 9222.60 | −4.8 | |
| YTR | Artificial | 7542.90 | 8023.30 | 6.4 |
| Natural | 40,234.77 | 41,831.63 | 4.0 | |
| PR | Artificial | 2758.85 | 2848.74 | 3.3 |
| Natural | 5882.33 | 6023.87 | 2.4 |
Publisher’s Note: MDPI stays neutral with regard to jurisdictional claims in published maps and institutional affiliations. |
© 2022 by the authors. Licensee MDPI, Basel, Switzerland. This article is an open access article distributed under the terms and conditions of the Creative Commons Attribution (CC BY) license (https://creativecommons.org/licenses/by/4.0/).
Share and Cite
Wang, Y.; Lu, S.; Zi, F.; Tang, H.; Li, M.; Li, X.; Fang, C.; Ikhumhen, H.O. Artificial and Natural Water Bodies Change in China, 2000–2020. Water 2022, 14, 1756. https://doi.org/10.3390/w14111756
Wang Y, Lu S, Zi F, Tang H, Li M, Li X, Fang C, Ikhumhen HO. Artificial and Natural Water Bodies Change in China, 2000–2020. Water. 2022; 14(11):1756. https://doi.org/10.3390/w14111756
Chicago/Turabian StyleWang, Yong, Shanlong Lu, Feng Zi, Hailong Tang, Mingyang Li, **nru Li, Chun Fang, and Harrison Odion Ikhumhen. 2022. "Artificial and Natural Water Bodies Change in China, 2000–2020" Water 14, no. 11: 1756. https://doi.org/10.3390/w14111756